Configure browser monitors
- Dynatrace Classic
- How-to guide
- 15-min read
Configure your browser monitors easily when first setting them up and at any time after that.
During browser monitor creation (single-URL or clickpath, configuration settings appear after you select Create a browser monitor. These settings are a subset of the full set available in edit mode (described below) after the monitor has been deployed. For example, you can set performance or availability thresholds only after monitor creation.
Configure an existing browser monitor
To configure/edit an existing single-URL browser monitor or browser clickpath
-
Go to Synthetic Classic.
-
Select the browser monitor you want to configure.
-
Select Edit from the quick links to go to monitor settings. Alternatively, you can go to Synthetic Classic, select the checkbox next to the monitor you want to edit, and select Edit at the bottom of the page.
-
Browse through the Monitor settings tabs on the left to configure settings (see explanations below—a subset of these settings are available when you first set up a monitor).
-
Save changes at bottom right when done editing your monitor. (You can also Discard changes.)
General
Specify the Monitor name. The name is limited to 500 characters.
For single-URL browser monitors, you can edit your monitor's HTTP/HTTPS URL here. (For clickpaths, this information is captured in the Navigate event.)
Device profile
Emulated device properties are the Device profile/type, orientation, Screen size, Bandwidth, and User agent.
The default device profile is Desktop.
- For mobile device profiles (including tablets), you can select an orientation and Bandwidth. The User agent is autoselected but can be changed.
- For a Custom device, specify if the device is a Mobile device and select the orientation, Bandwidth, and Screen size. This profile uses the default Dynatrace user agent, which can be changed.
- For desktop and laptop profiles, you can choose Bandwidth. These profiles use the default Dynatrace user agent.
Default user agent
-
The default Dynatrace user agent during recording and local playback is in the format
Mozilla/5.0 (Windows NT 10.0; Win64; x64) AppleWebKit/537.36 (KHTML, like Gecko) Chrome/{version} Safari/537.36 RuxitSynthetic/1.0 v0 t0 cfeatureHash=7efgijmoqtvx caes=1 ccux=1 sia=1 smf=1, where:-
{version}is the current browser version used for recording. -
v0andt0identify Synthetic Monitoring traffic. -
sia=1indicates faster RUM JavaScript injection (value can be1or0). -
smf=1indicates monitoring of pages in frames (requires enabling Capture performance metrics for pages loaded in frames in Advanced setup; value is0if not enabled). -
cfeatureHash=<value>appears when custom RUM JavaScript settings are enabled in Advanced setup. -
Other key-value pairs beginning with
cappear when any custom RUM JavaScript properties defined in Advanced setup.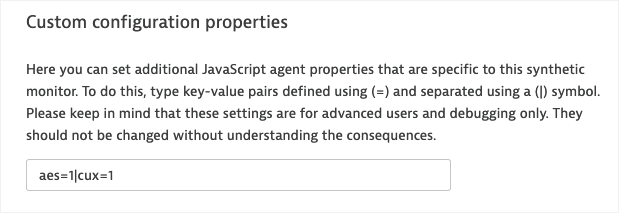 Custom JS tag properties
-
-
The default user agent string for browser monitor execution from public or private Synthetic locations is
Mozilla/5.0 (X11; Ubuntu; Linux x86_64) AppleWebKit/537.36 (KHTML, like Gecko) Chrome/{version} Safari/537.36 RuxitSynthetic/1.0 v{id} t{id} ath{id} alt{id} cfeatureHash=7efgijmoqtvx caes=1 ccux=1 sia=1 smf=1, where:{id}represents long IDs used by Dynatrace to identify a monitor execution.- Other parameters are as described above.
Note that even if a custom user agent is defined, Dynatrace always automatically adds
RuxitSynthetic/1.0 v{id} t{id} ath{id} alt{id},sia,smf, and, if applicable,cfeaturehashand any key-value pairs beginning withcto the user agent to make sure that Synthetic Monitoring traffic can be identified.
Bandwidth caps
These are the Synthetic monitoring bandwidth throttling options and their simulated speeds and latency:
| Bandwidth | Download | Upload | Latency |
|---|---|---|---|
DSL | 2 Mb/s | 1 Mb/s | 5ms RTT |
GPRS | 50 kb/s | 20 kb/s | 500ms RTT |
Good 2G | 450 kb/s | 150 kb/s | 150ms RTT |
Good 3G | 1 Mb/s | 750 kb/s | 40ms RTT |
Regular 2G | 250 kb/s | 50 kb/s | 300ms RTT |
Regular 3G | 750 kb/s | 250 kb/s | 100ms RTT |
Regular 4G | 4 Mb/s | 3 Mb/s | 20ms RTT |
WiFi | 30 Mb/s | 15 Mb/s | 2ms RTT |
If your monitor has a device that is no longer available in the list
All device settings (such as screen size, bandwidth, and orientation) stay the same; the device selection is changed to Custom.
Key performance metrics
This setting is available in edit mode only.
You can choose one key performance metric for each load action and XHR action included in a browser monitor or clickpath.
Key performance metrics enable you to choose performance goals that best fit the variable needs of each application you monitor. For example, you might want to choose User action duration to optimize the performance of a traditional web application. For other applications where the speed of user interaction is more important than the UI, you might want to optimize the time it takes for JavaScript resources to load. The default is Visually complete for both load and XHR actions as it measures how long it takes for the visible portion of a user’s browser to be fully rendered.
As Dynatrace captures a list of key performance metrics out of the box, you can switch your selection in monitor settings and immediately have historical data available.
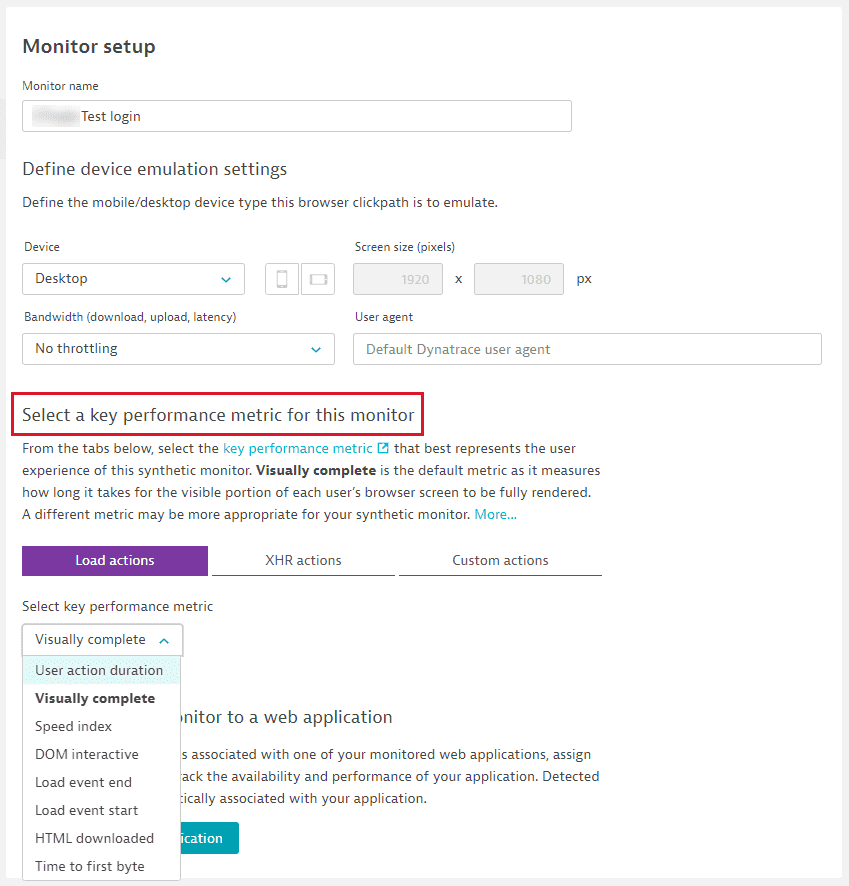
The key performance metric is calculated and displayed as an average on the Synthetic details page in the performance visualizations and on the Synthetic events and actions card.
Assigned applications
This setting is available in edit mode only.
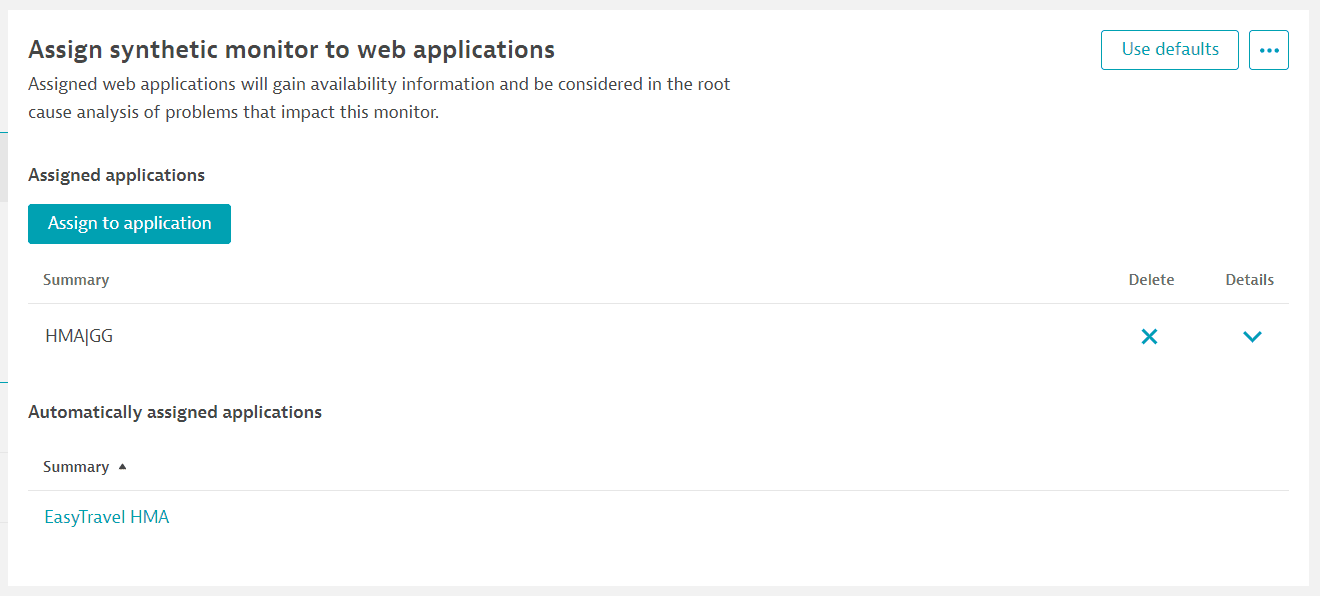
If this synthetic monitor is associated with one of your monitored applications, you can assign the monitor to the application so you can track application availability and performance. Detected problems are then automatically associated with your application. If the monitor is unavailable, the associated application is also considered to be unavailable.
Select Assign to application and choose an application from the list. You can assign a monitor to multiple applications, and an application can have several assigned monitors.
You can assign a browser monitor to a web application.
This tab also displays separate lists of auto-assigned and manually associated applications. You can dissociate manually associated applications from here.
Note that you cannot block Synthetic Monitoring traffic for RUM applications by excluding bots, spiders, or the IP addresses of Synthetic locations.
Recorded clickpath
You can edit a recorded clickpath.
When your recorded clickpath captures a credential such as a password, you see an option to save it to the credential vault. The image below shows a recorded clickpath with a captured password.
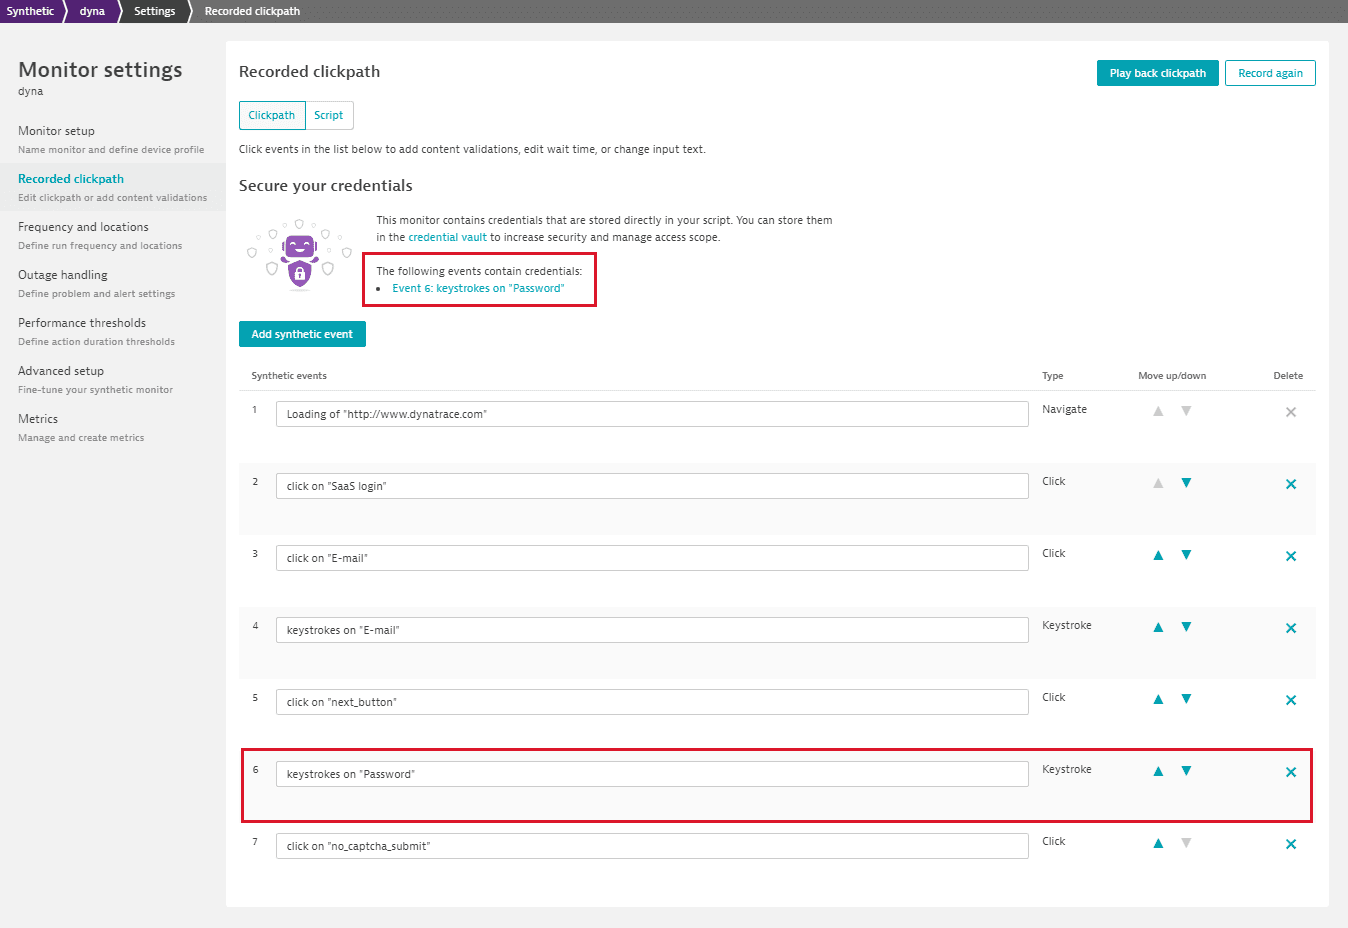
Read more about credentials in the Navigate event and Keystroke event.
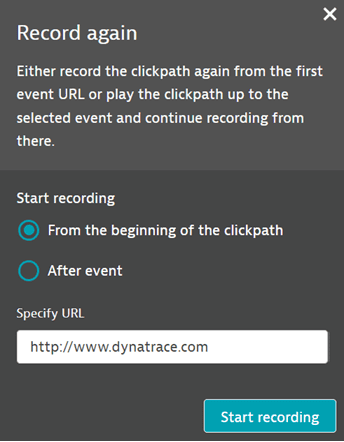
Select Record again to re-record your clickpath. You can choose between recording the clickpath over completely (from the first event URL) or after playing back to a specified event. Note that any JavaScript events that precede an initial Navigate event will be erased when you re-record your clickpath—see Browser clickpath events.
You can also perform local playback (Play back clickpath) so you can verify that your recorded clickpath plays back as expected.
If your browser monitor has any associated credentials, whether public or owner only, users need to enter the credentials in order to play back the monitor locally. However, if you Enable local playback of Synthetic browser monitors without entering credentials in the credential vault, users need not enter the credentials that they have access to in order to play back the browser monitor.
For example, if you want to play back a clickpath containing one public credential and one owner-only credential belonging to another user, you don't need to enter the public credential. In effect, this means that you might not be able to play back a clickpath containing credentials to which you don't have access.
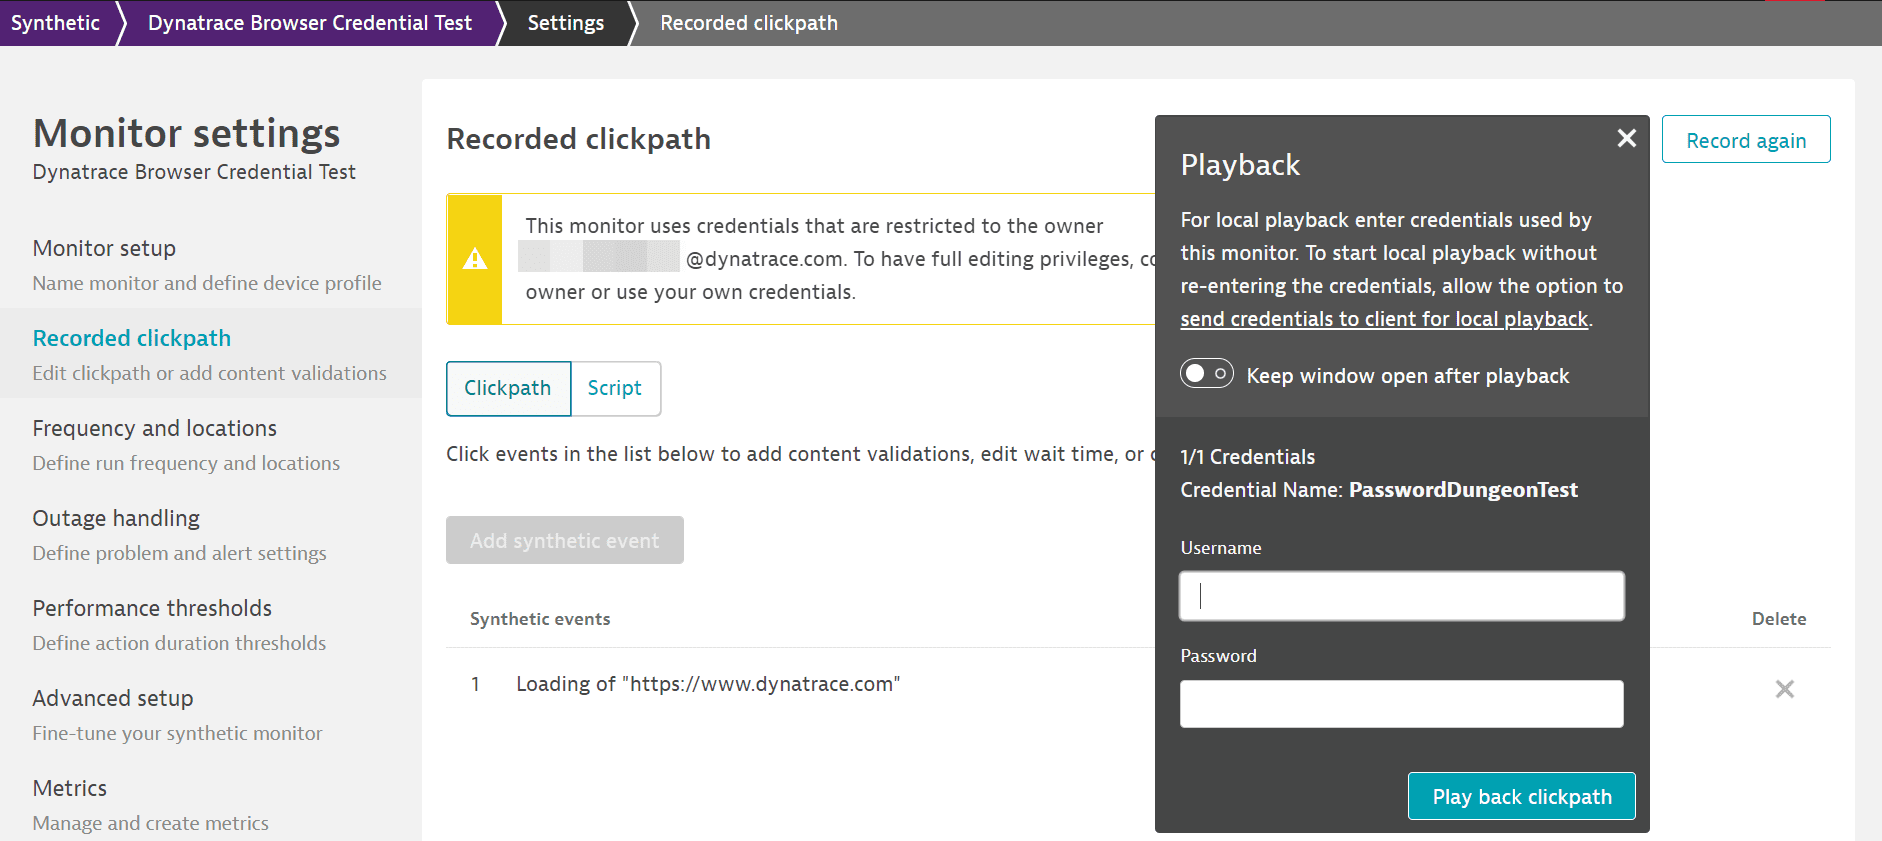
You can opt to keep the playback window open after playing back a clickpath (Keep window open after playback), say, to debug a failed execution or test some JavaScript code on the website.
- Each monitor run begins in a clean state, that is, with a clean browser cache and empty local storage.
- Local playback in Dynatrace is in emulation mode, based on the device profile and user agent you select during monitor configuration. That is, playback emulates your chosen device. If you navigate to the same URL or perform the same transaction outside Dynatrace, your experience might vary.
You aren't limited to just one mode to view and edit your clickpath—you can switch back and forth between the UI and script modes by selecting Clickpath or Script. For details on editing your clickpath in JSON format, see Script mode for browser monitor configuration.
In visual/UI mode, you can avail of these controls to edit events in your script:
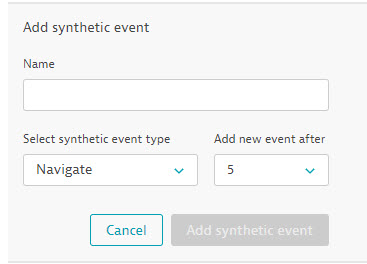
If necessary, you can delete events from your clickpath by selecting x under Delete for the respective event. You can also add events—select Add synthetic event. Specify a name, event type, and the event it should follow.
Use the Move up/down arrows 

Although we do our best to name events intuitively, you can edit event names as required—simply click in the field provided for the event name.
In addition, you can configure each event by hovering over it and clicking when your cursor changes to a finger pointer. From event details, you can delete the event by selecting Delete synthetic event. Note that the first Navigate event of a clickpath cannot be deleted.

The fields available to edit depend on the event type—see Browser clickpath events for detailed descriptions. When you are done editing, be sure to Save changes. Select Close details to exit event details if necessary.
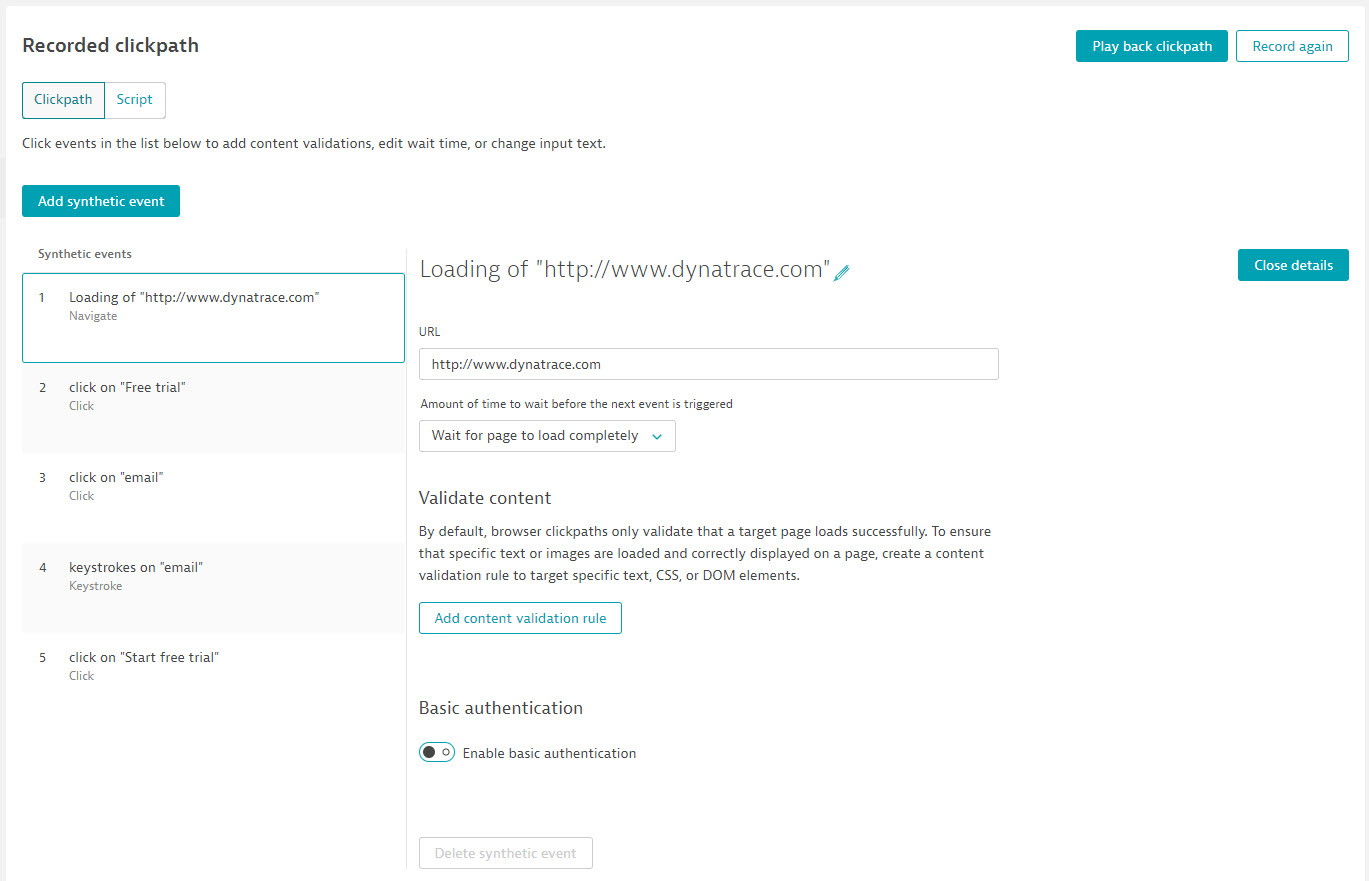
A clickpath event is not the same thing as an action. See Number of actions consumed by browser clickpaths for details.
Frequency and locations
Two factors make up your monitoring schedule—how frequently your browser monitor runs and the number of locations it's executed from.
Dynatrace offers a global network of public Synthetic Monitoring locations out-of-the-box. You can also create private Synthetic locations within your own network infrastructure. Both public and private locations appear on this settings page.
The frequency and number of locations determine the number of monitor executions per hour. For example, running a monitor from 3 locations every 15 minutes results in 12 executions per hour (4 times per hour from each of the 3 locations). Monitor executions are evenly spaced within the selected interval. That is, for a monitor running from 3 locations every 15 minutes, executions are triggered at 5-minute intervals.
You can choose a frequency of every 5, 10, 15, or 30 minutes; or 1, 2, or 4 hours. You can also set up your monitor to be executed On demand only. You can select multiple global locations from where your browser monitor is to be executed.
Note that all public Synthetic locations are set to Coordinated Universal Time, or UTC. If your monitor script requires the local time or time zone, you can use the api.getContext() method and the system clock to implement conditional logic.
Validate content
For single-URL browser monitors, this tab appears in monitor settings and is only available in edit mode.
For browser clickpaths, you can set up content validation for each event in the Recorded clickpath tab of monitor settings. You can also set up validation during the recording workflow for recorded or manually inserted clickpath events.
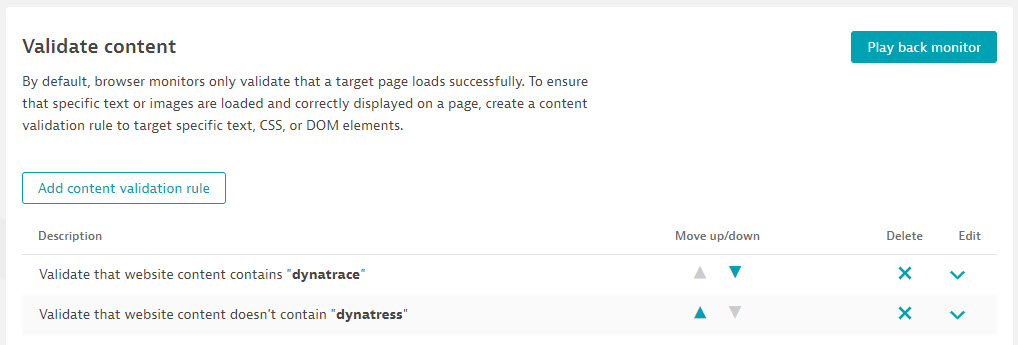
Content validation helps to verify that your browser monitor loads the expected page content or element. Validations are performed through validation rules: Select Add custom content validation to define a validation rule.
In browser clickpaths, you define validations for each event; for single-URL monitors, which contain a single event, you define validation for the monitor as a whole.
Validation is performed after following all redirects, even if the very first response delivers HTML content.
You can validate based on specific text on a webpage, a specific element, text included within an element, or text in the DOM or any resource. You can opt to pass or fail your monitor/event based on your validation criteria. If pass criteria are not met (or fail criteria are met), the monitor/event fails and the execution is aborted.
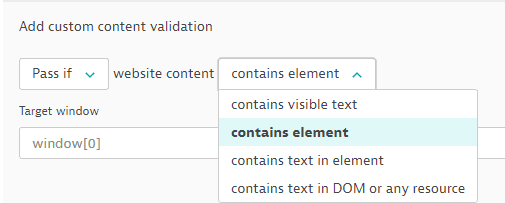
Target window defines the tab in which the text/element is found. window[0] is the first tab opened and window[1] represents the second tab. It can also be window[N].frames[X] where X is a number of the iframe that is displayed on the page in tab N. Frames can also be chained, where window[N].frames[X].frames[Y] means that elements with given locators are within frame Y, which is within frame X on tab N.
You can also use a placeholder in the Target window value, for example, window[0].frames[{index}], where {index} is a variable defined earlier using the api.setValue() method in a JavaScript event.
If your validation is based on visible text (contains text), text found in a specific element (contains text in element), or markup text in the DOM or a resource (contains text in DOM or any resource), you need to Specify text (not case sensitive). Enclose placeholder values in brackets, for example, {email}. Optionally, you can specify text as a regular expression (Evaluate as regular expression).
If your validation searches for an element (contains element) or text found in a specific element (contains text in element), you need to specify the CSS selectors or DOM locators to use during replay: Select Add locator, then select DOM or CSS, and provide the locator reference. When pasting the locator string, be sure to remove any > characters.
You can add and reorder as many locators as you like. Validation is performed in the order you define till a locator is matched.
You can add and reorder more than one validation to an event/monitor. Validation is performed in the order you define; if any of the rules fail, the monitor fails.
Example 1 - Content validation based on visible text
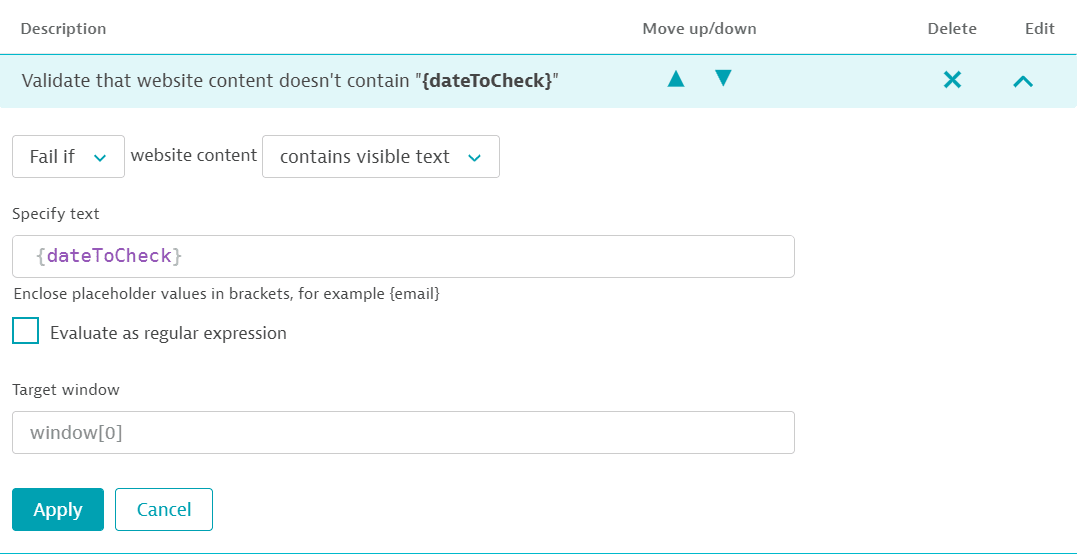
Select contains visible text and provide the text to look for (the string is not case sensitive). This text must be visible on the webpage. Determine whether the monitor should fail or pass based on the provided text. In the example below, the monitor is set to fail if the text in a placeholder (specified earlier in the script) is found.
Example 2 - Content validation based on an element
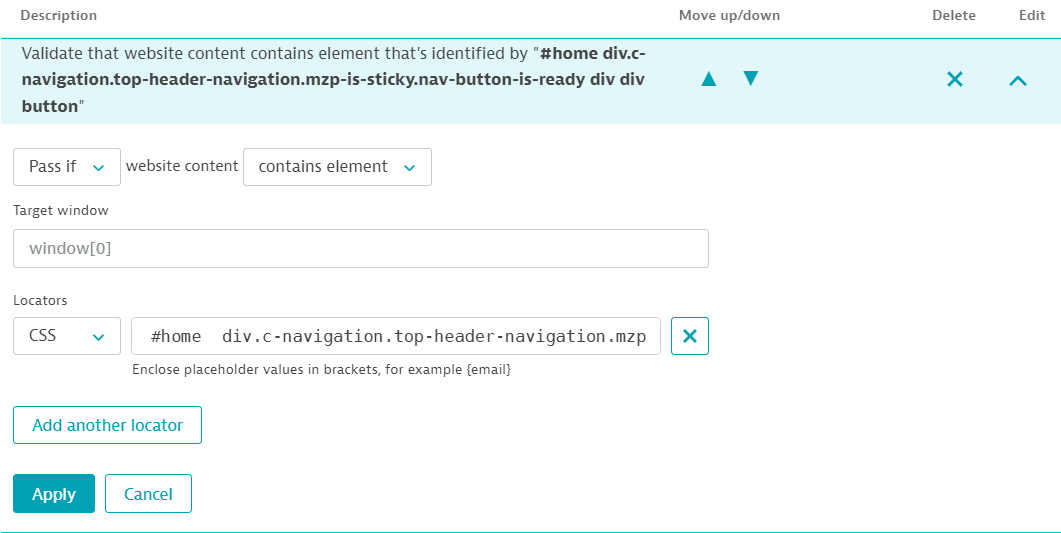
Select contains element. You need to provide the locator for the element you wish to validate.
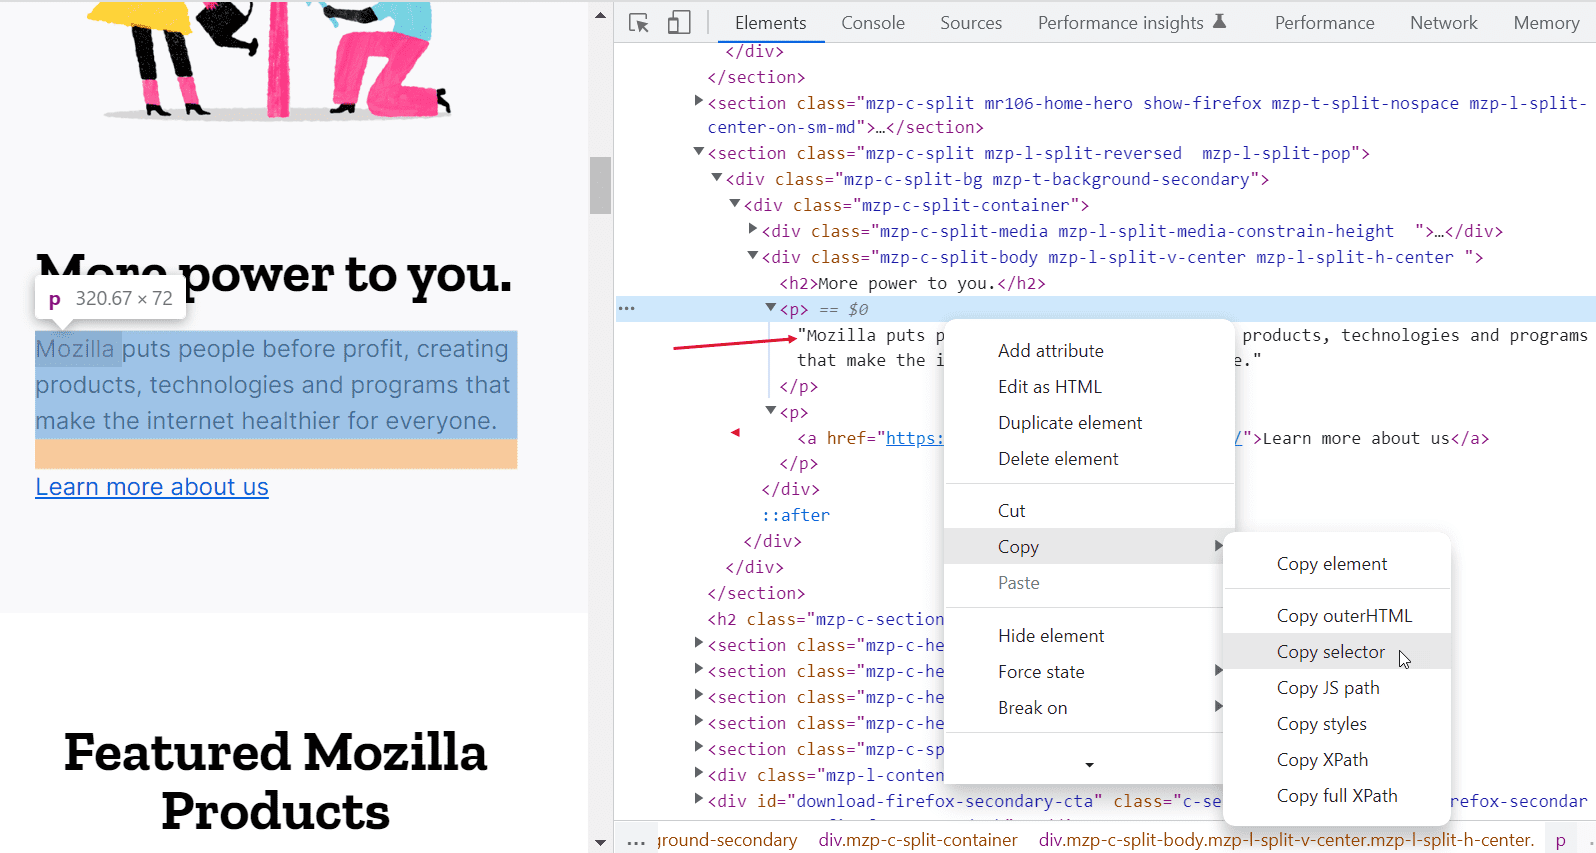
To find the locator, open developer tools for your webpage (right-click > Inspect). Right-click the element you're interested in and select Copy > Copy selector. Then paste the CSS selector, making sure to remove any > characters.
The example below shows a validation rule based on the presence of an element.
Example 3 - Content validation based on text in an element
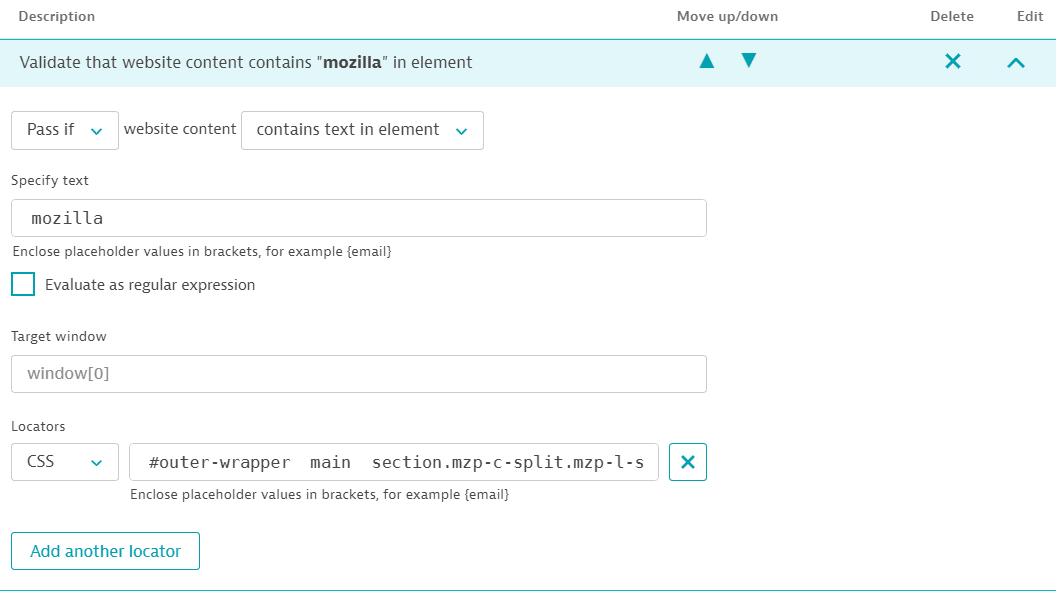
Select contains text in element. In addition to the text string to identify, you need to provide the locator for the element containing the text. The string doesn't need to be visible on the webpage but must be part of the text between the opening and closing tags of an element; the string cannot contain attribute names or values.
To find the locator, open developer tools for your webpage. Right-click the element you're interested in and select Copy > Copy selector. Then paste the CSS selector, making sure to remove any > characters.
The screenshots below show a specific element containing the text Mozilla in developer tools and the corresponding validation rule in a browser monitor.
Example 4 - Content validation based on DOM or resource text
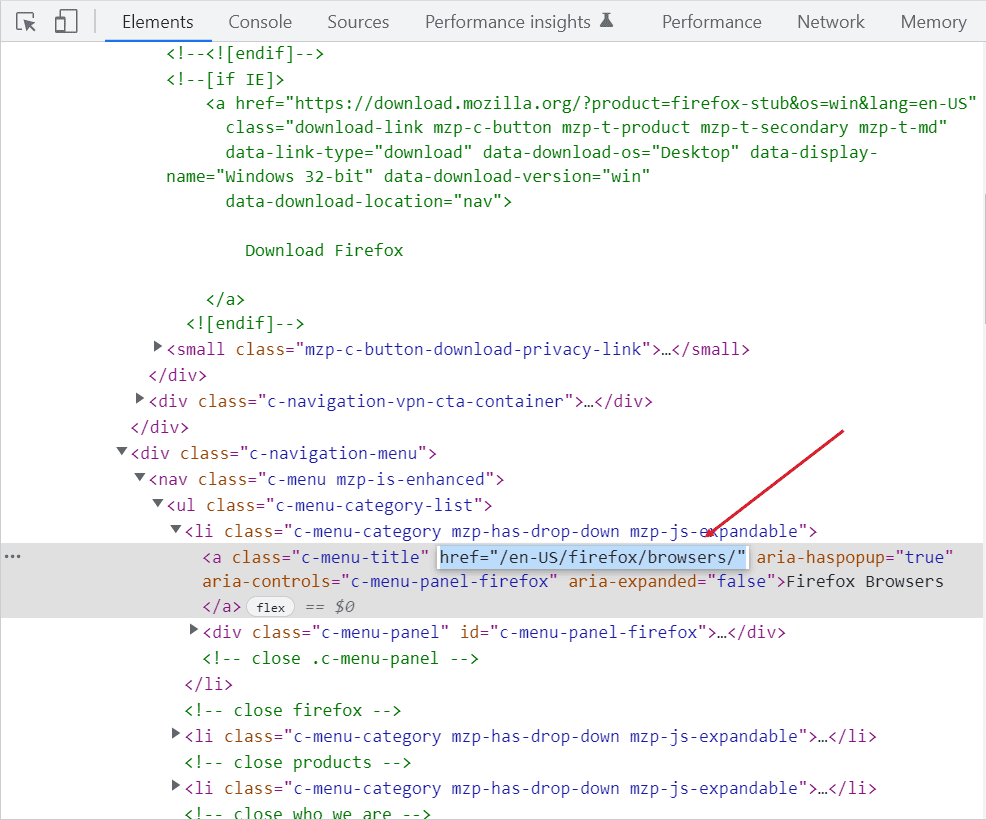
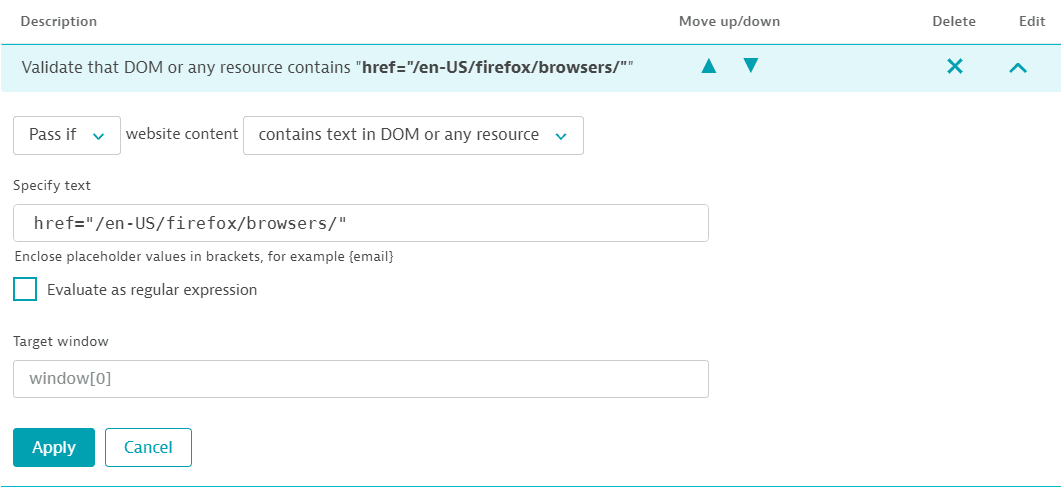
Select contains text in DOM or any resource to validate content based on any string in the DOM, including comments and attribute names and values.
To find your string, open developer tools for your webpage. Copy the text you wish to validate and paste it in the validation rule.
The screenshots below show the attribute and value for a destination URL (href="/en-US/firefox/browsers/") selected in the DOM. The selected string is used as validation text for a browser monitor.
You can play back your single-URL browser monitor from here (Play back monitor). Read more about local playback above.
Outage handling
Outage handling settings determine what to do in the event of monitor failures (availability outages). Default outage handling behavior can be defined at the environment level for all browser monitors or all HTTP monitors—go to Settings > Web and mobile monitoring and select the respective Outage handling tab. You can opt to use Dynatrace-provided defaults (Use defaults) to define environment-level outage handling. When enabled, these defaults apply for all browser or HTTP monitors that do not override them with monitor-level outage handling settings.
At the monitor level, this setting is available in edit mode only. The outage handling options available at the environment or the monitor level are the same. You can override the default, environment-wide settings at the monitor level. You can also restore environment-level defaults (Remove override).
You can disable problem generation for global and local outages if you're testing a volatile site or have scheduled downtime that you don't want to be alerted on.
-
Generate a problem and send an alert when this monitor is unavailable at all configured locations
This setting is enabled by default for newly created monitors. It alerts you of global availability outages, that is, when all locations experience a failure simultaneously.
By default, a global outage problem is generated when all locations fail one time. However, you can specify the number of consecutive failures (from 1 to 5) for a global outage problem, that is, how many times all locations need to fail consecutively in order to generate a global outage problem.
-
Generate a problem and send an alert when this monitor is unavailable for one or more consecutive runs at any location
This allows you to raise a problem when there are consecutive failures at one or more locations. At the environment level, you can choose the number of failures. At the monitor level, you can also determine the number of monitor locations that need to fail in order to generate a local outage problem.
In the example below, a monitor is configured for
4locations, and a problem will be generated if3of those4locations are unable to access your site during2or more consecutive executions.
-
Automatic retry on error
With this setting, enabled by default, single-URL browser monitors and browser clickpaths are automatically retried from the same location when errors are encountered. Upon subsequent success, the initial error data point is discarded. This approach reduces false positive errors.
Retry on error occurs regardless of your availability thresholds. The retry does not consume additional DEM units.
You might want to disable retries when investigating underlying issues if retries might mask the issues. With retries disabled, every monitor failure counts towards an outage.
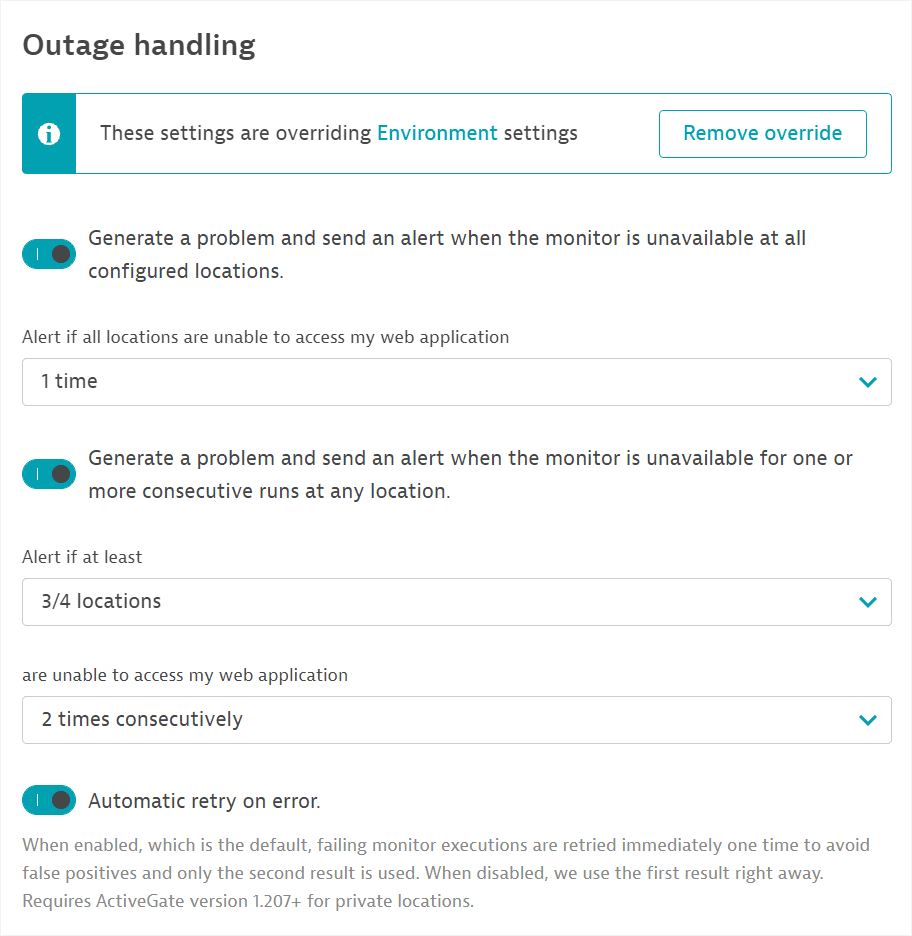
An outage problem is resolved when there are as many consecutive successful executions as the configured number of failed executions for generating the problem. The successful executions must occur on the number of locations that = the total number of locations–the number of locations required for the problem+1.
Note that when a global outage problem is resolved, you might still have one or more locations experiencing monitor failure. Set up local outage rules to be alerted on these.
See Synthetic calculations for more information on:
Performance thresholds
This setting is available in edit mode only.
Performance thresholds enable you to be proactive about site latency.
Select Add threshold. For clickpaths, you can set a threshold for the monitor as a whole (Total duration of all events) and/or individual events. Note that you can only select events that generate network activity. In the case of single-URL browser monitors, you can only set a threshold for the monitor as a whole.
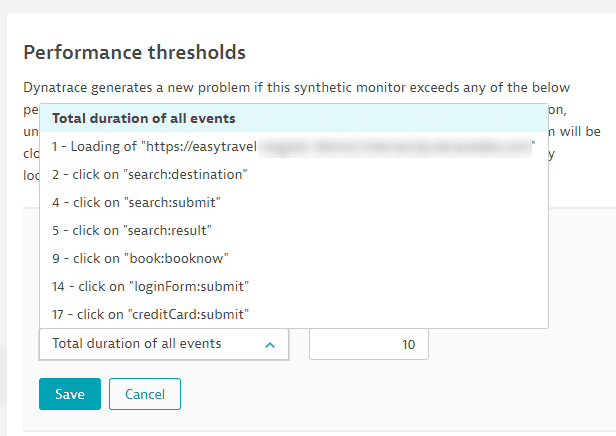
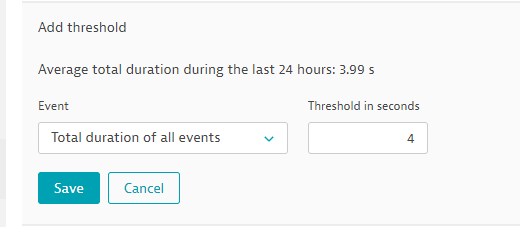
You can see the 24-hour average performance up until that point to help you set a threshold. Simply enter a performance Threshold in seconds and Save. You can set multiple performance thresholds.
You can delete or edit your performance thresholds at any time.
Performance thresholds are defined as the Total duration of the monitor or of individual events, which, in turn, can comprise multiple load or XHR actions. (Total duration is not available as a metric for individual load or XHR actions when viewing browser monitor Multidimensional analysis or a waterfall graph.)
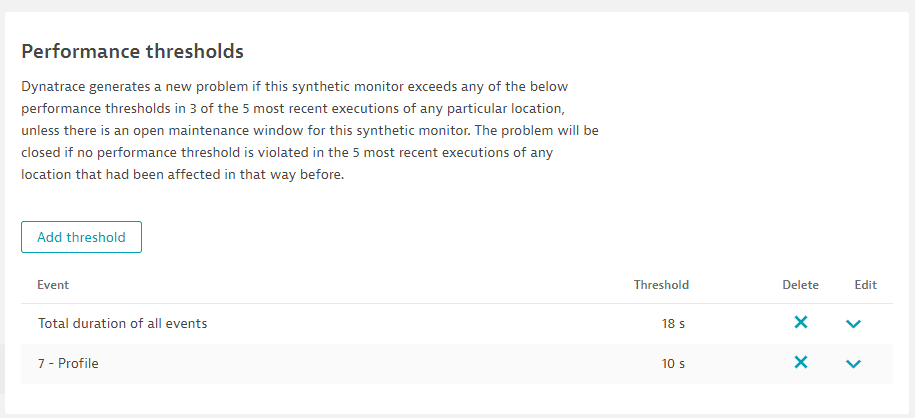
Dynatrace generates a performance problem if a monitor at a given location violates any of the defined performance thresholds in 3 of the 5 most recent executions, unless there is an open maintenance window for the monitor. That is, the violations must occur at the same location. Multiple locations can have such violations and be included in a problem.
The problem is closed if the performance thresholds are not violated in the 5 most recent executions at each of the previously affected locations.
See Synthetic calculations for more information.
Monitor script
This tab appears for single-URL browser monitors and contains the script code of the monitor in JSON format. You can edit the script directly in the Dynatrace web UI or Download the script to edit in a text editor of your choice. For details, see Script mode for browser monitor configuration.
Advanced setup
This tab contains controls for:
During the creation of single-URL browser monitors or clickpaths, these controls are listed as Additional options for monitor configuration.
Enable global login authentication
Dynatrace makes it easy to automate signing in to password-protected pages. This is achieved with Dynatrace LoginSenseTM technology, which enables intelligent and secure login to your web application for each browser monitor execution.
Single-URL browser monitors
When initially setting up a single-URL browser monitor, you can select Enable global login authentication and choose between HTTP authentication and Kerberos authentication methods. In edit mode, this setting is available for single-URL browser monitors within Advanced setup. For details, see Supported authentication methods in Synthetic Monitoring.
Web form authentication
Deprecated
Web form authentication is no longer supported for the single-URL browser monitors. You can instead create browser clickpath monitors for the test scenarios that require web form login. Your previously configured single-URL monitors will run as before, but we recommend to re-record them as clickpaths to clearly separate each step of the login process.
Re-recording is required if you want to modify any part of your monitor's configuration. You can no longer save changes in their current format.
Starting from Dynatrace version 1.324+, the single-URL monitors with the web form login will be automatically updated by adding a free JavaScript step to support the login process.
Recorded browser clickpaths
When initially setting up a browser clickpath, Enable global login authentication is not supported for recording.
For browser clickpaths, login authentication does not appear within Advanced setup in edit mode.
- For web form-based authentication, you can simply record entering credentials into a web form. You can later edit your clickpath to use credentials stored in the credential vault.
- For HTTP-based authentication schemes, you need to manually enter the username and password in the browser-native dialog box when recording your clickpath. Then, in the Navigate event of your recorded clickpath in edit mode, turn on Enable HTTP authentication.
See Supported authentication methods in Synthetic Monitoring for more information.
How to use or store credentials in the credential vault
You can choose an existing credential (Select credentials). You can only see the credentials that you have access to in this list, that is, public credentials or owner-only credentials created by you.
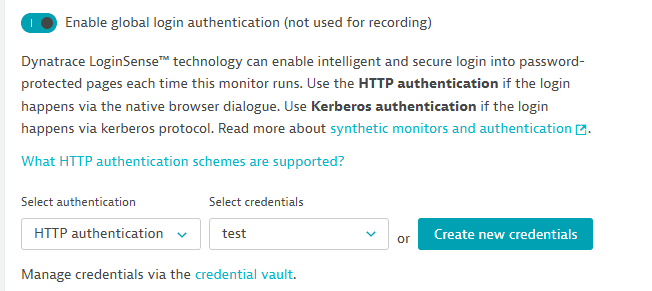
You can Create new credentials by entering a Username and Password. Provide a name for the credential and Save to vault. The credentials you create this way are automatically set to owner-only permissions and can only be used by you.
Note that you must have permission to access the credential vault in order to create credentials in script or UI mode in a browser monitor in this way. You can always capture entered credentials as part of a recorded clickpath.
Who can edit a monitor that has associated credentials?
- If a monitor is associated with a public credential, anyone on your team can switch on/off, delete, or edit the monitor.
-
If a browser monitor (clickpath or single URL) is associated with a restricted credential (owner only or shared with a few users), any user can make changes to certain fields, even if they don't have access to the credential used. You can edit monitor name, device emulation settings, wait conditions, frequency, locations, outage alerting, performance thresholds, metrics, connected applications, validation, and HTTP status codes to be ignored. And, of course, you can change a token or user ID/password credential. You can create a credential within monitor settings in edit mode. You'll need to change all credentials in the monitor to ones that you have access to. Note that replacing another user's credential with one you have access to is irreversible.
Controls that you cannot edit—such as the URL, switching on/off HTTP authentication, adding or deleting clickpath events, data entry in Keystroke, and Advanced setup in monitor settings—are grayed out or display an error message when you attempt to save changes, whether in script or UI mode.
- You can enable/disable or delete a synthetic monitor that's secured by another user's owner-only credentials.
Read more about credential permissions in Credential vault for synthetic monitors.
Use client certificates
Dynatrace version 1.272+
ActiveGate version 1.271+
You can set up certificate authentication for browser monitors running on any public location and private locations with Linux-based ActiveGates (containerized as well as non-containerized). This control is available in edit mode for single-URL browser monitors and browser clickpaths.
Before first recording a clickpath on a website that requires certificate authentication, ensure that you have installed the required certificate in the browser. Then, when you navigate to the website in the recording window, the native browser dialog simply selects the correct certificate.
If there is at least one expired certificate in a chain, the whole chain can be rejected. It results in failing monitor executions. The results can be different when using the same certificate chain with an HTTP monitor or when running a curl command manually from the host.
After you record the clickpath, you need to specify the certificate to use for browser monitor execution in Advanced setup in edit mode, as described below.
-
Select the Advanced setup tab in browser monitor settings.
-
Turn on Use client certificates.
-
Select Add client certificate.
-
Enter the Domain that the certificate is valid for.
-
Select a credential from the list of certificate credentials displayed. Alternatively, select Create new credential to upload and use a new client certificate. Any certificate credential you create is automatically designated as owner only and stored in the credential vault.
You can specify and upload certificate files in PFX, P12, or PEM format.
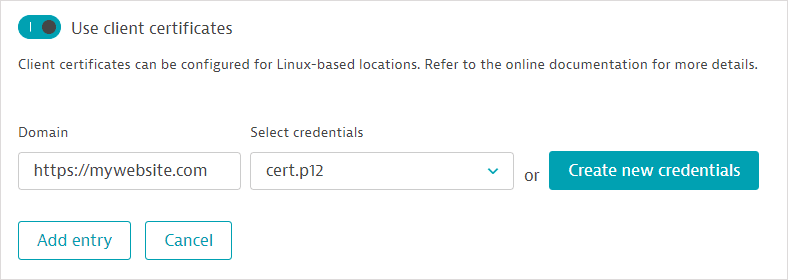 Certificate authentication setting for browser monitors
 -
Select Add entry.
-
Repeat these steps to add multiple certificates for use in your clickpath. However, each certificate must be tied to a single domain.
-
Save changes.
Enable additional HTTP headers
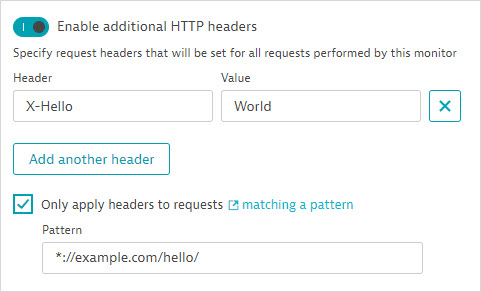
The monitor is created with a bare minimum set of headers required by the protocol. To enable custom headers:
- Select Enable additional HTTP headers.
- Enter a Header name and Value.
- Select Add another header as needed.
You can specify multiple HTTP headers. They will be set for all requests the monitor makes.
If you want to set headers only for specific requests, check Only apply headers to requests matching a pattern and then define a Pattern. After that, the header is only set for requests that match the pattern you’ve defined.
Block specific requests
You can block one or more requests by specifying complete URLs or match patterns. The URL or regex string cannot exceed 90 characters and is case insensitive.
Blocking requests allows you to analyze how these requests affect your application's performance and optimize it accordingly.
Enable Block specific requests. You can then provide a complete URL as shown below.
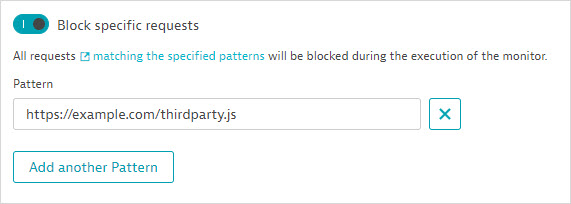
You can also define patterns, for example, http:*://*/*.png or https*://*/*.png to block all requests to PNG images.
Matching requests are blocked throughout monitor execution and aren’t dependent on events.
If you're unable to block specific requests, refer to the Dynatrace Community article Unable to block specific requests (owing to limitations on the length of regular expressions).
Ignore specific status codes
This enables you to exclude HTTP status codes 400–599 from causing availability outages/errors if encountered in the main document request. Typically, this is the base page in a load action. If this setting is enabled and the base page of a load action encounters HTTP errors 400–599, an availability outage is not triggered.
You can specify an exact status code, range, or status class mask. Use commas to separate multiple values; use the minus sign (-) with no spaces for a range, for example, 404, 405-410, 5xx. You can apply the rule only to document requests that match a specific regular expression (Only apply to document request matching this regex).
- This setting does not apply to XHR requests or document requests in iframes; browser monitors do not fail when an XHR request or a document request in an iframe fails.
- This setting applies to future executions, that is, executions that take place after the setting is enabled.
Set cookies
Cookies enable you to store browser state information on the client side so that each monitor execution is based on the same state and you can accurately monitor a performance baseline.
You can set cookies in Additional options when creating a browser monitor or in Advanced setup in monitor settings in edit mode. These cookies are valid for the entire monitor execution. If you want to set cookies only for a specific portion of your clickpath, use the Cookie event.
In edit mode, enable Set cookies, then provide a Name and cookie Value. Every cookie must be unique within the list.
The following symbols are not allowed in the cookie value: ;,\". Provide the Domain of the cookie, and optionally, the Path to the cookie. Save your cookie.
Select Add cookie to define additional cookies.

Bypass Content Security Policy (CSP) of monitored page
If you have a Content Security Policy in place, it's likely to prevent the browser from sending monitoring data to the Dynatrace Cluster. As a first and preferred method to have the browser bypass the CSP of any monitored pages in your single-URL browser monitor or browser clickpath, enable this option.
If you're unable to use this option for some reason, refer to the advanced solutions for bypassing CSP in the Dynatrace Community article Browser monitors: Issues with Content Security Policy.
Capture performance metrics for pages loaded in frames
Turn on this toggle to begin capturing performance data for pages in iframes or framesets. The resulting waterfall graph for the action in question will contain results for each frame. You can select the page you want to view waterfall data for.
Enable using deprecated JavaScript frameworks
With the release of Dynatrace version 1.266+, we no longer support certain JavaScript frameworks. Turn on this toggle to enable these deprecated frameworks for monitor and script continuity.
The deprecated frameworks are then enabled in the JavaScript framework support section in Advanced setup.
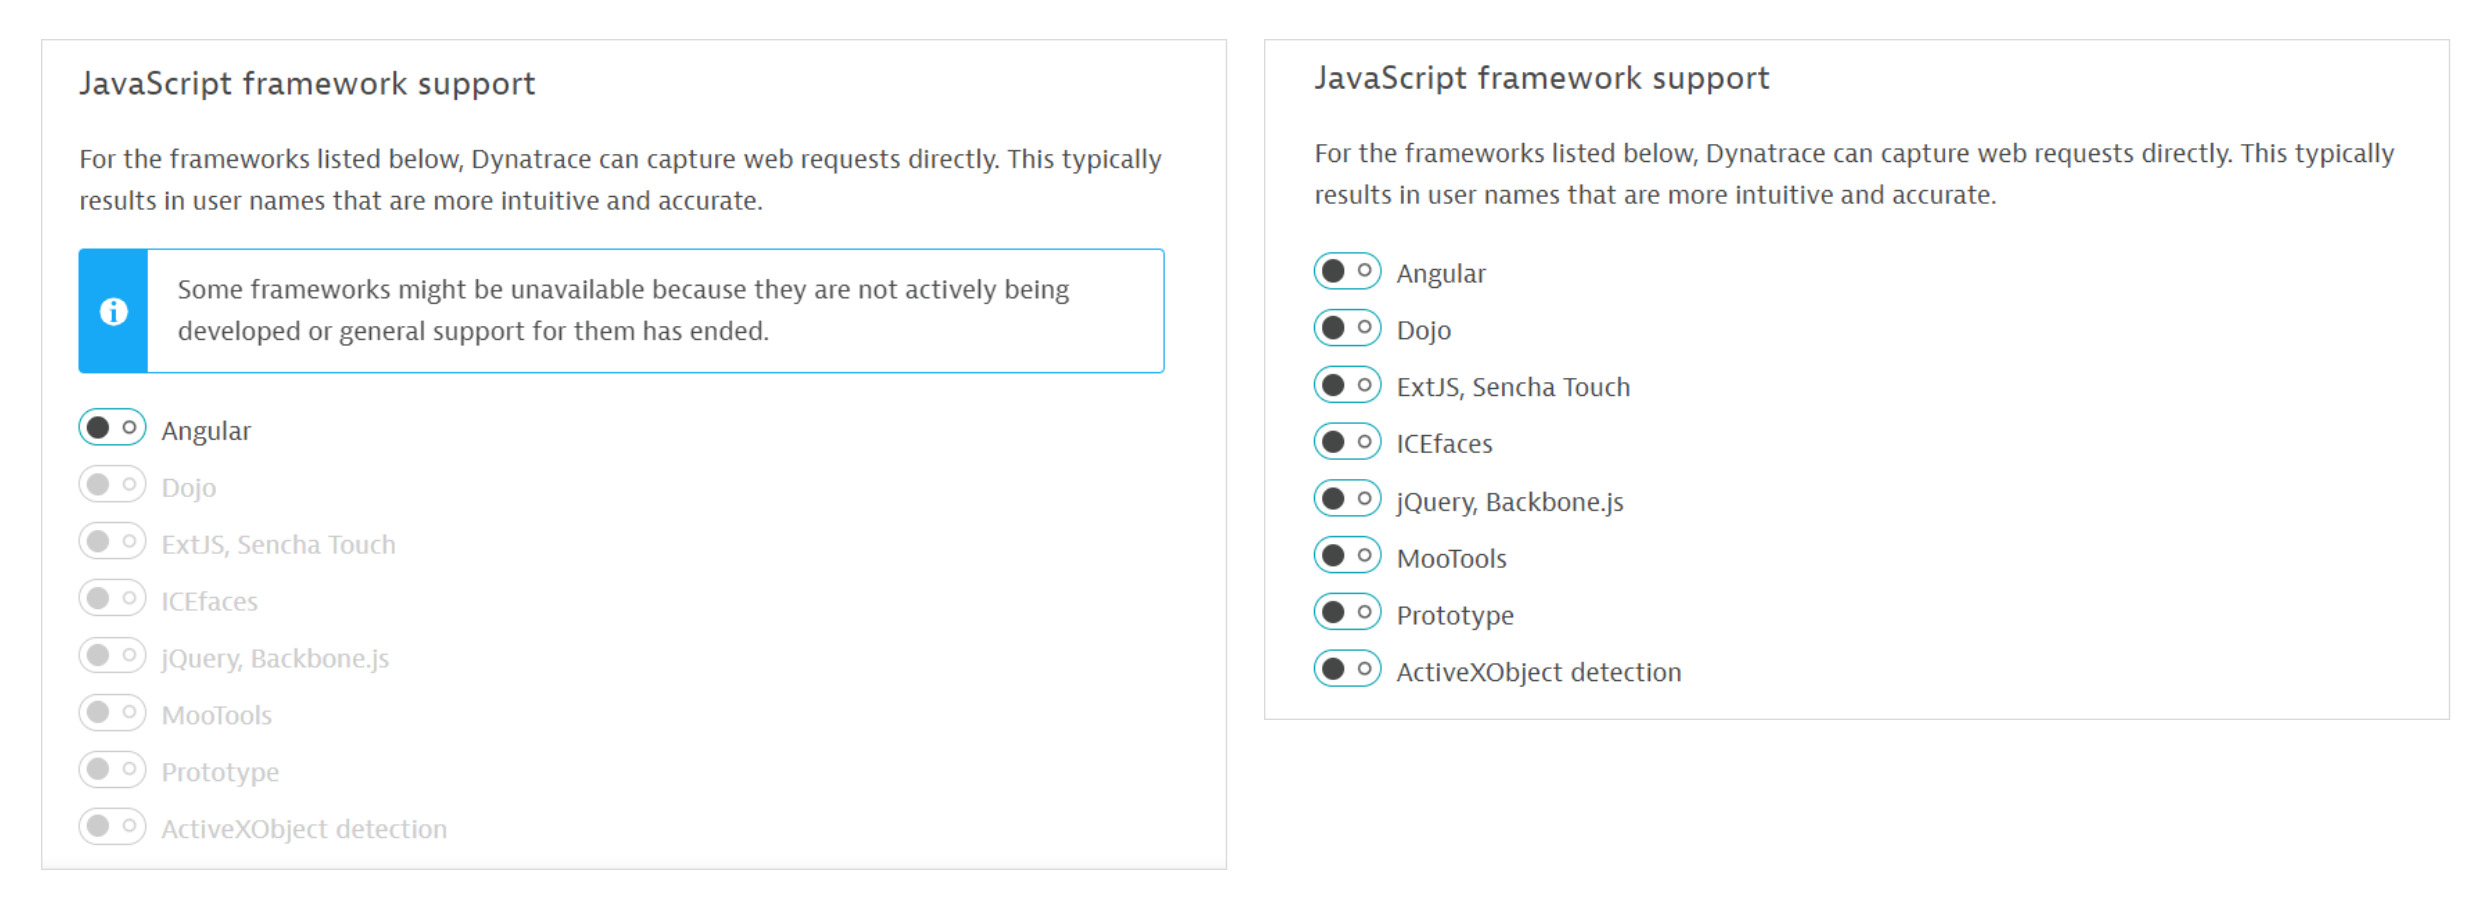
Select Use default to use the default value of this setting for your Dynatrace monitoring environment. Note that you can only change the default value by contacting Support.

In script mode, the parameter "useIESupportedAgent": true enables support for deprecated JavaScript frameworks; when set to false, the parameter doesn't appear in the browser monitor script, and any settings enabling deprecated JavaScript frameworks (javaScriptFrameworkSupport) are ignored.
Metrics
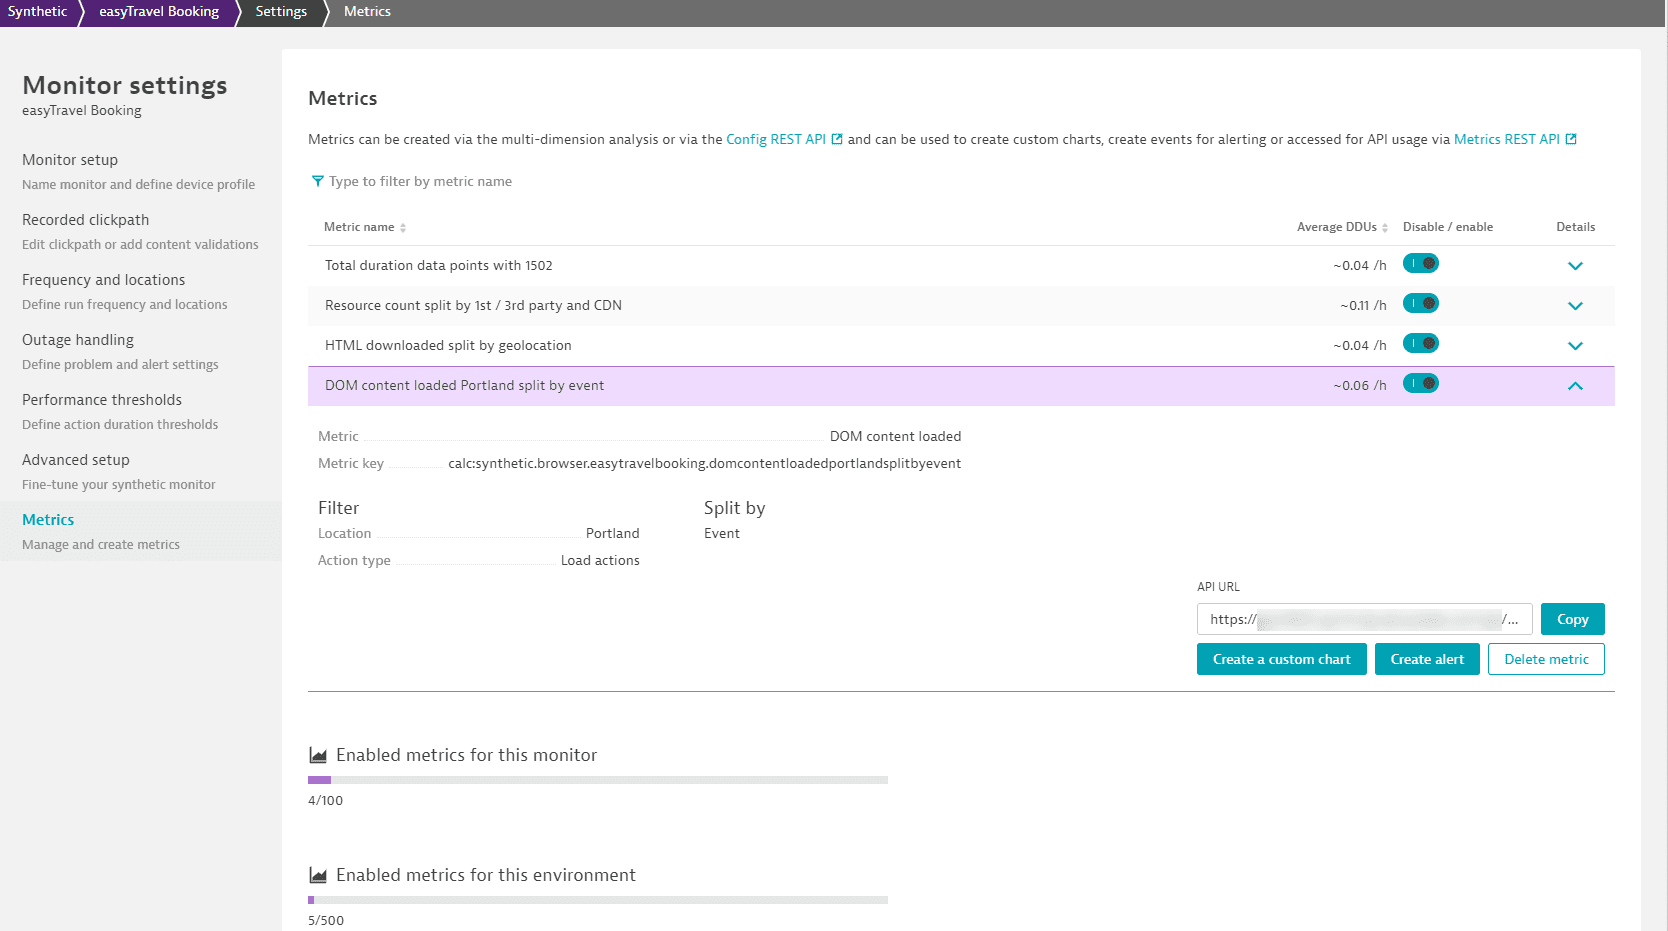
Dynatrace Synthetic Monitoring enables you to capture your metric customizations (filters and splitting factors) as calculated metrics and track their performance over a long period of time. This tab displays all calculated metrics for your monitor and a count of calculated metrics for your monitoring environment as a whole. The settings in this tab are available in edit mode only.
Expand a metric to view details. You can disable/enable, delete, or create custom charts and alerts based on a calculated metric. While you cannot change the metric name, key, or configuration once created, you can choose whether you want to display any splitting factors in custom charts based on the metric.
 Synthetic Classic