Synthetic calculations in Classic
- Dynatrace Classic
- Explanation
- 4-min read
Dynatrace uses specific formulas to calculate metric values and generate problems based on these metrics.
Availability
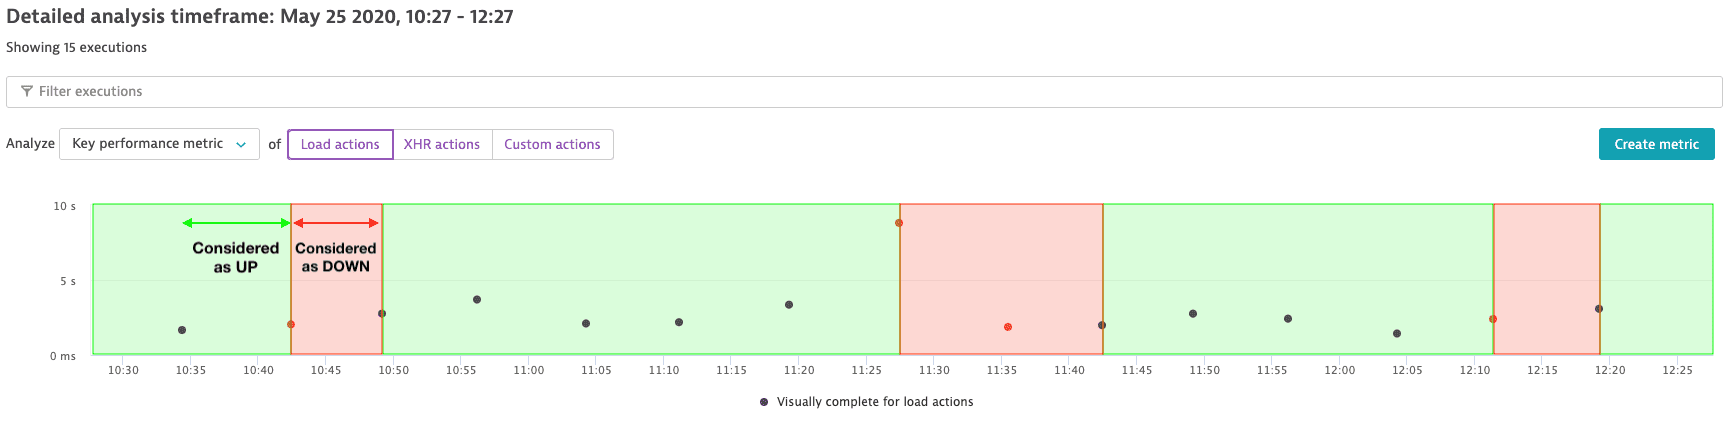
Availability calculation for a synthetic monitor isn't based on the number of successful executions but on the length of time (duration) that a monitor is considered to be UP. Dynatrace stores timestamps of state changes—UP, DOWN, and UNMONITORED.
The timespan covered by successive successful monitor executions is considered to be uptime (UP). The time between the last successful execution and the first failed execution is also considered to be uptime (UP). Likewise, the timespan covered by successive failed executions is considered to be downtime (DOWN). The time between the last failed execution and the first successful execution is considered to be downtime (DOWN). This is illustrated in the image below.
The time that a monitor spends in the UNMONITORED state isn't considered in availability calculations.
- Uptime is the duration in ms during which a synthetic monitor is in state
UP. - Downtime is the duration in ms during which a synthetic monitor is in state
DOWN. - Availability % per location is
Uptime / (Uptime + Downtime) × 100. - Overall availability of a monitor is the
sum of availability % per location / number of locations.
Availability is stored as a percentage with two decimal places.
Maintenance windows
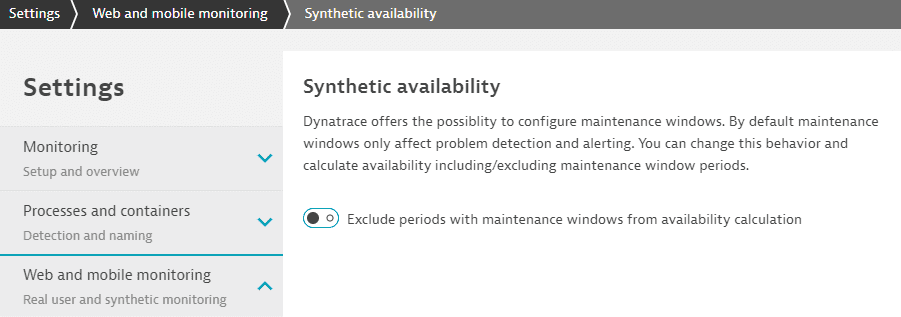
Maintenance windows can be excluded from availability calculation for synthetic monitors, displayed, for example, in Synthetic Classic, synthetic monitor details pages, and reports. A global setting enables you to always exclude maintenance windows from availability calculations—go to Settings > Web and mobile monitoring > Synthetic availability to access it.
Outages that occur within such excluded maintenance windows are shown, for example, in graphs and data points on the Multidimensional analysis page. Any failing resources are highlighted in waterfall graphs. However, failed executions are not included in availability calculations for the maintenance periods.
This setting also applies to retroactive maintenance windows. That is, you can exclude a retroactive maintenance window from synthetic availability calculations for the same period. Note, however, that maintenance windows are not retroactively excluded from any reports that were generated before the maintenance windows were created.
Data Explorer charts and the Metrics API provide availability metrics with the option of including or excluding maintenance windows.
Retries
Retry on error for single-URL browser monitors and browser clickpaths is configurable via monitor settings and is enabled by default. Discarded executions are ignored in availability calculations.
- Browser monitors: Automatic retry (first unsuccessful execution is ignored) when option is enabled in monitor settings
- HTTP monitors: No retries
Key performance metrics
Total duration is calculated as a summation of the User action duration of the load and XHR actions in a monitor. Other key performance metric values are averages, calculated separately for load actions and XHR actions.
Performance problems, resolution, and timeouts
Dynatrace generates a performance problem if a monitor at a given location violates any of the defined performance thresholds in 3 of the 5 most recent executions, unless there is an open maintenance window for the monitor. That is, the violations must occur at the same location. Multiple locations can have such violations and be included in a problem.
A problem is not created, for example, if your monitor runs from 3 locations, and each location has 1 violation.
Many locations, each with 3 violations in the 5 most recent executions, can be part of the same problem if the violations occur around the same time. If the violations are further apart in time, separate problems are generated for each location.
The problem is closed if the performance thresholds are not violated in the 5 most recent executions at each of the previously affected locations.
Performance problem resolution occurs when a monitor is enabled/active. If a monitor is disabled/inactive, open performance problems are closed, or time out, after 10 minutes.
Performance thresholds
Performance thresholds for browser monitors are defined as the Total duration of the monitor or of individual events, which, in turn, can comprise multiple load or XHR actions. Total duration is the sum of the User action durations of the constituent actions. Where an event has just one action, Total duration is the same as the User action duration.
Note that Total duration is not available as a metric for individual load or XHR actions when viewing browser monitor Multidimensional analysis or a waterfall graph.
Performance thresholds for HTTP monitors are defined as the Response time of the monitor or of individual requests.
Availability problems, resolution, and timeouts
Synthetic monitors can experience global outage or local outage availability problems. A global outage occurs when all locations experience 1–5 consecutive failures simultaneously. A local outage occurs when the specified number of locations experiences the specified number of consecutive failures, for example, when 3 of 4 total locations experience two consecutive failures.
An outage problem is resolved when there are as many consecutive successful executions as the configured number of failed executions for generating the problem. The successful executions must occur on the number of locations that = the total number of locations–the number of locations required for the problem+1.
For example, for your monitor running on 4 locations configured to generate a problem when 3 locations have 2 consecutive failures, an outage problem is resolved when there are 2 consecutive successful executions on 2 (=4–3+1) locations.
Note that when a global outage problem is resolved, you might still have one or more locations experiencing monitor failure. Set up local outage rules to be alerted on these.
Outage problem resolution occurs when a monitor is enabled/active. If a monitor is disabled/inactive, open outage problems are closed, or time out, if there are no new executions for 2x the monitor frequency. For example, if a monitor scheduled to run every hour and has an open outage problem when it is disabled at 7:00 AM, the problem times out at 9:00 AM (2 × 1 hour).
 Synthetic Classic