Number of actions consumed by browser clickpaths
- Dynatrace Classic
- How-to guide
- 2-min read
- Published May 16, 2018
Dynatrace Synthetic Monitoring creates a separate synthetic action for each page interaction that triggers a web request, including a page load, navigation event, or an XHR. Synthetic actions (similar to user actions for Real User Monitoring) hold the performance data that's collected during the playback of clickpath events.
To find out how many synthetic actions a specific browser clickpath consumes:
-
Go to Synthetic Classic.
-
Select a browser clickpath.
-
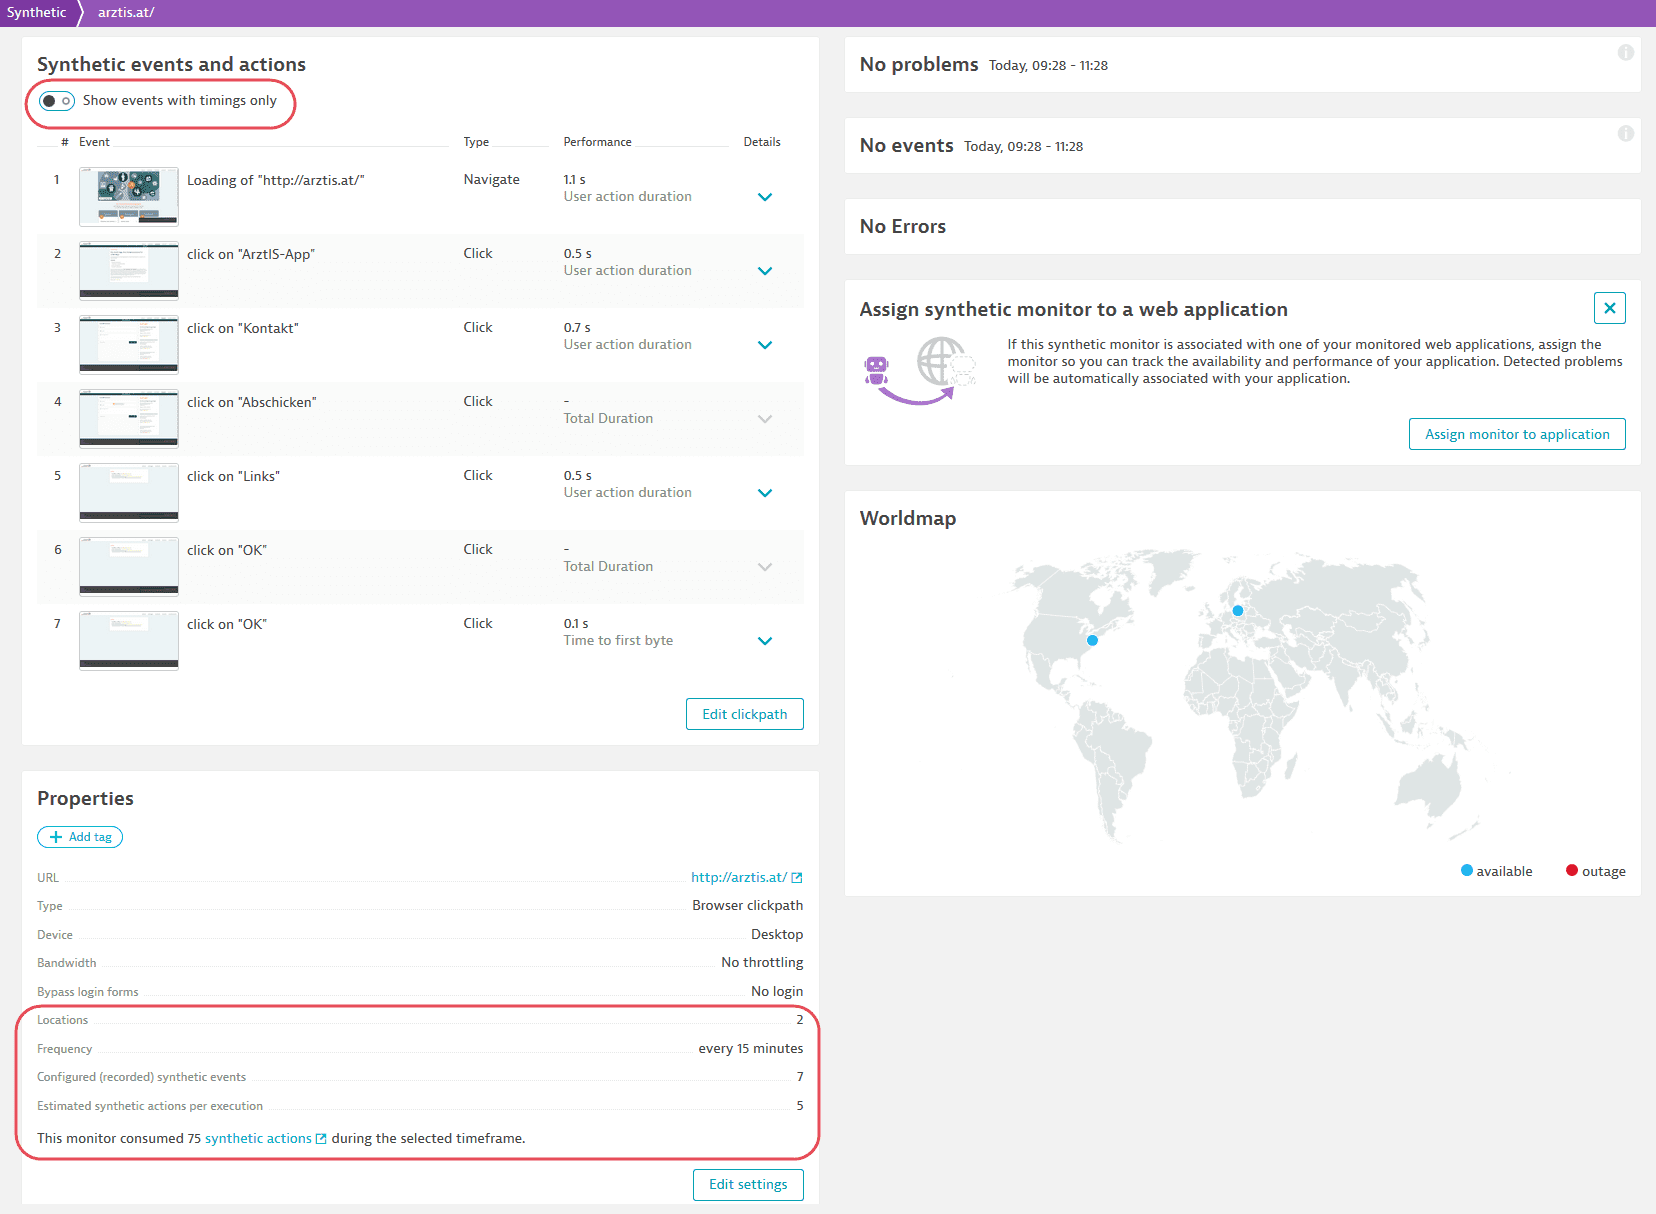
On the Synthetic details page, the Properties section displays the count of synthetic actions (versus events) for the clickpath.
 Actions on Synthetic details page
The number of actions and events, frequency, locations, and current consumption for the selected time frame are displayed. The number of actions consumed daily for this clickpath is calculated as follows.
4 executions per hour (runs every 15 minutes) × 24 x 2 locations × 5 actions = 960 synthetic actionsOn the Synthetic events and actions card, you can switch between viewing all events (default) or actions only (turn on Show events with timings only).
 KPM events
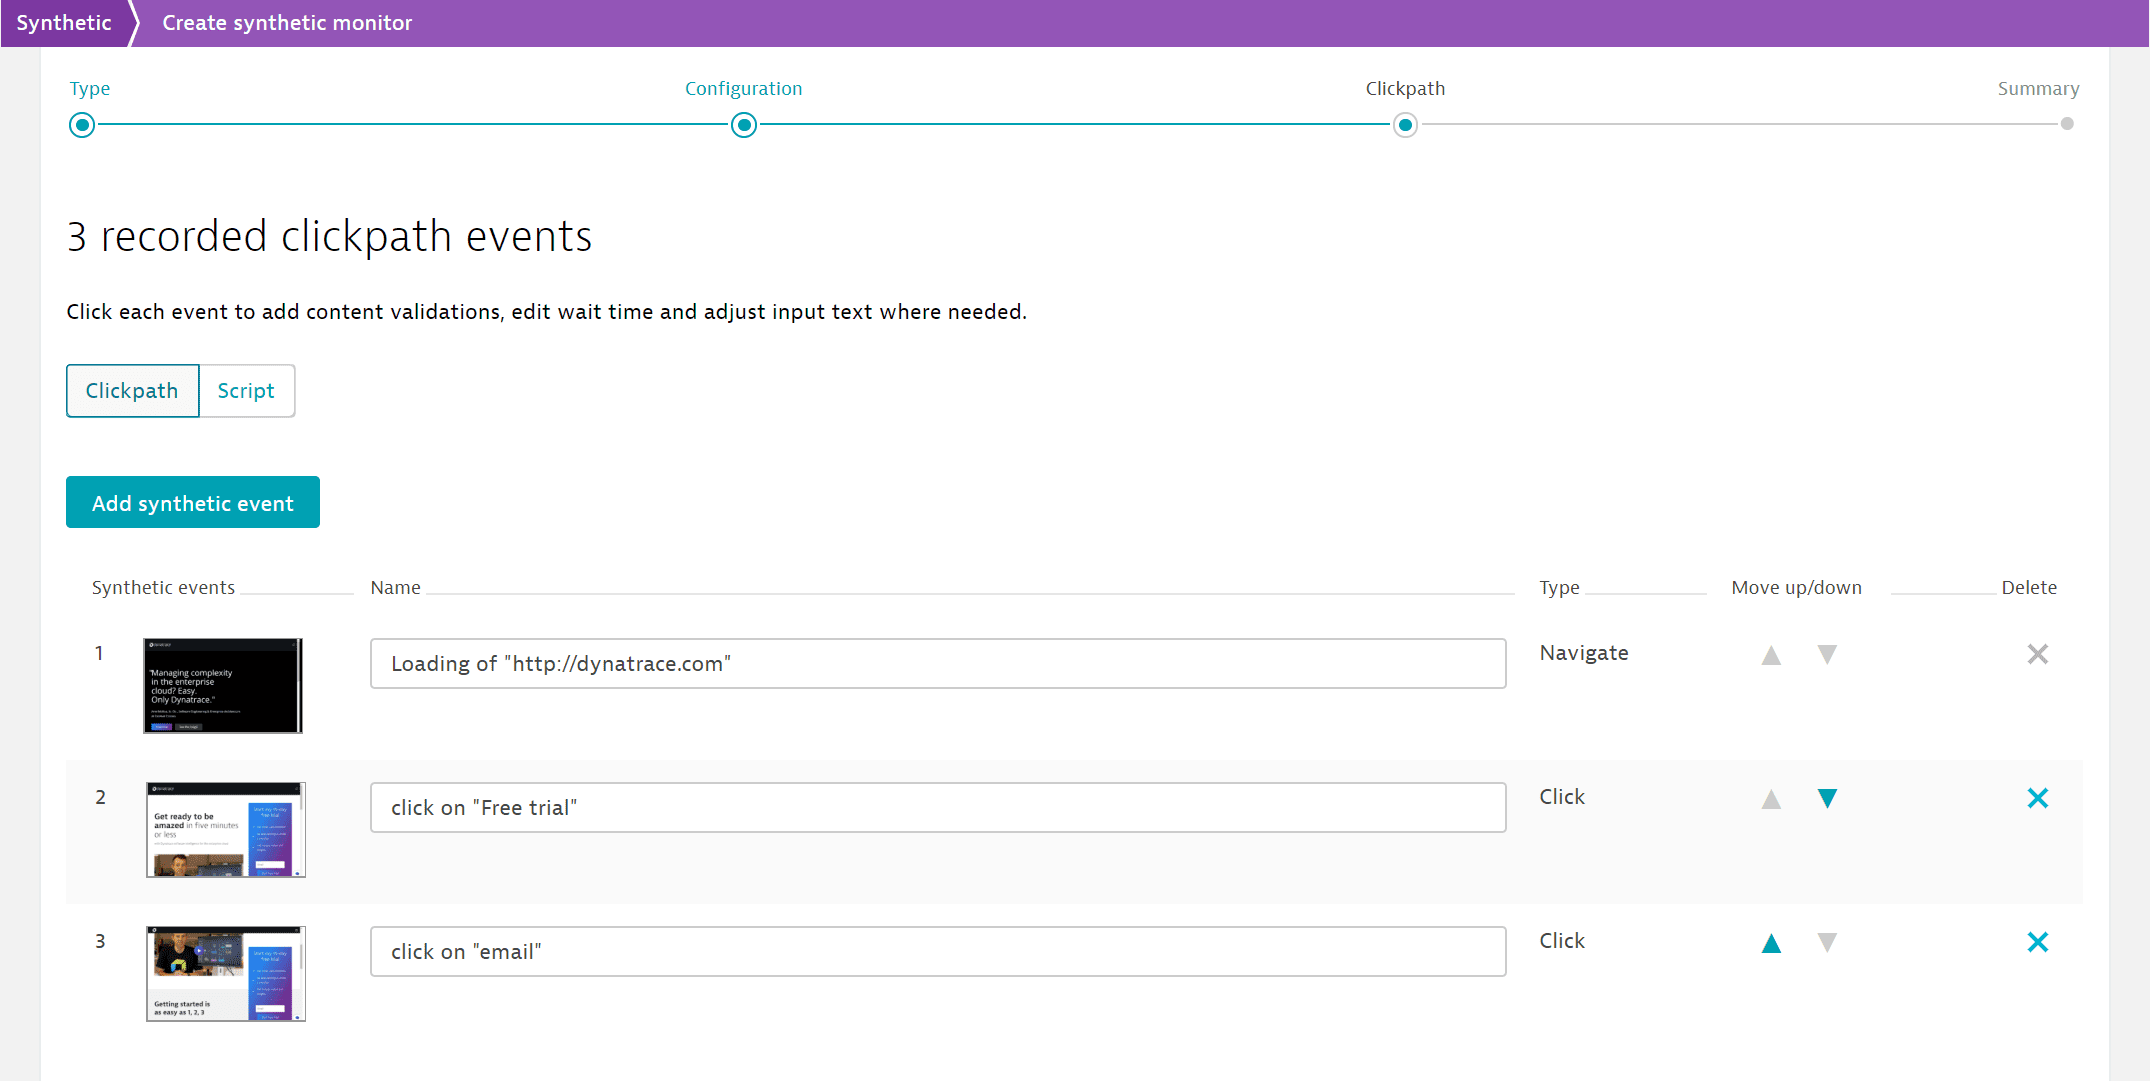
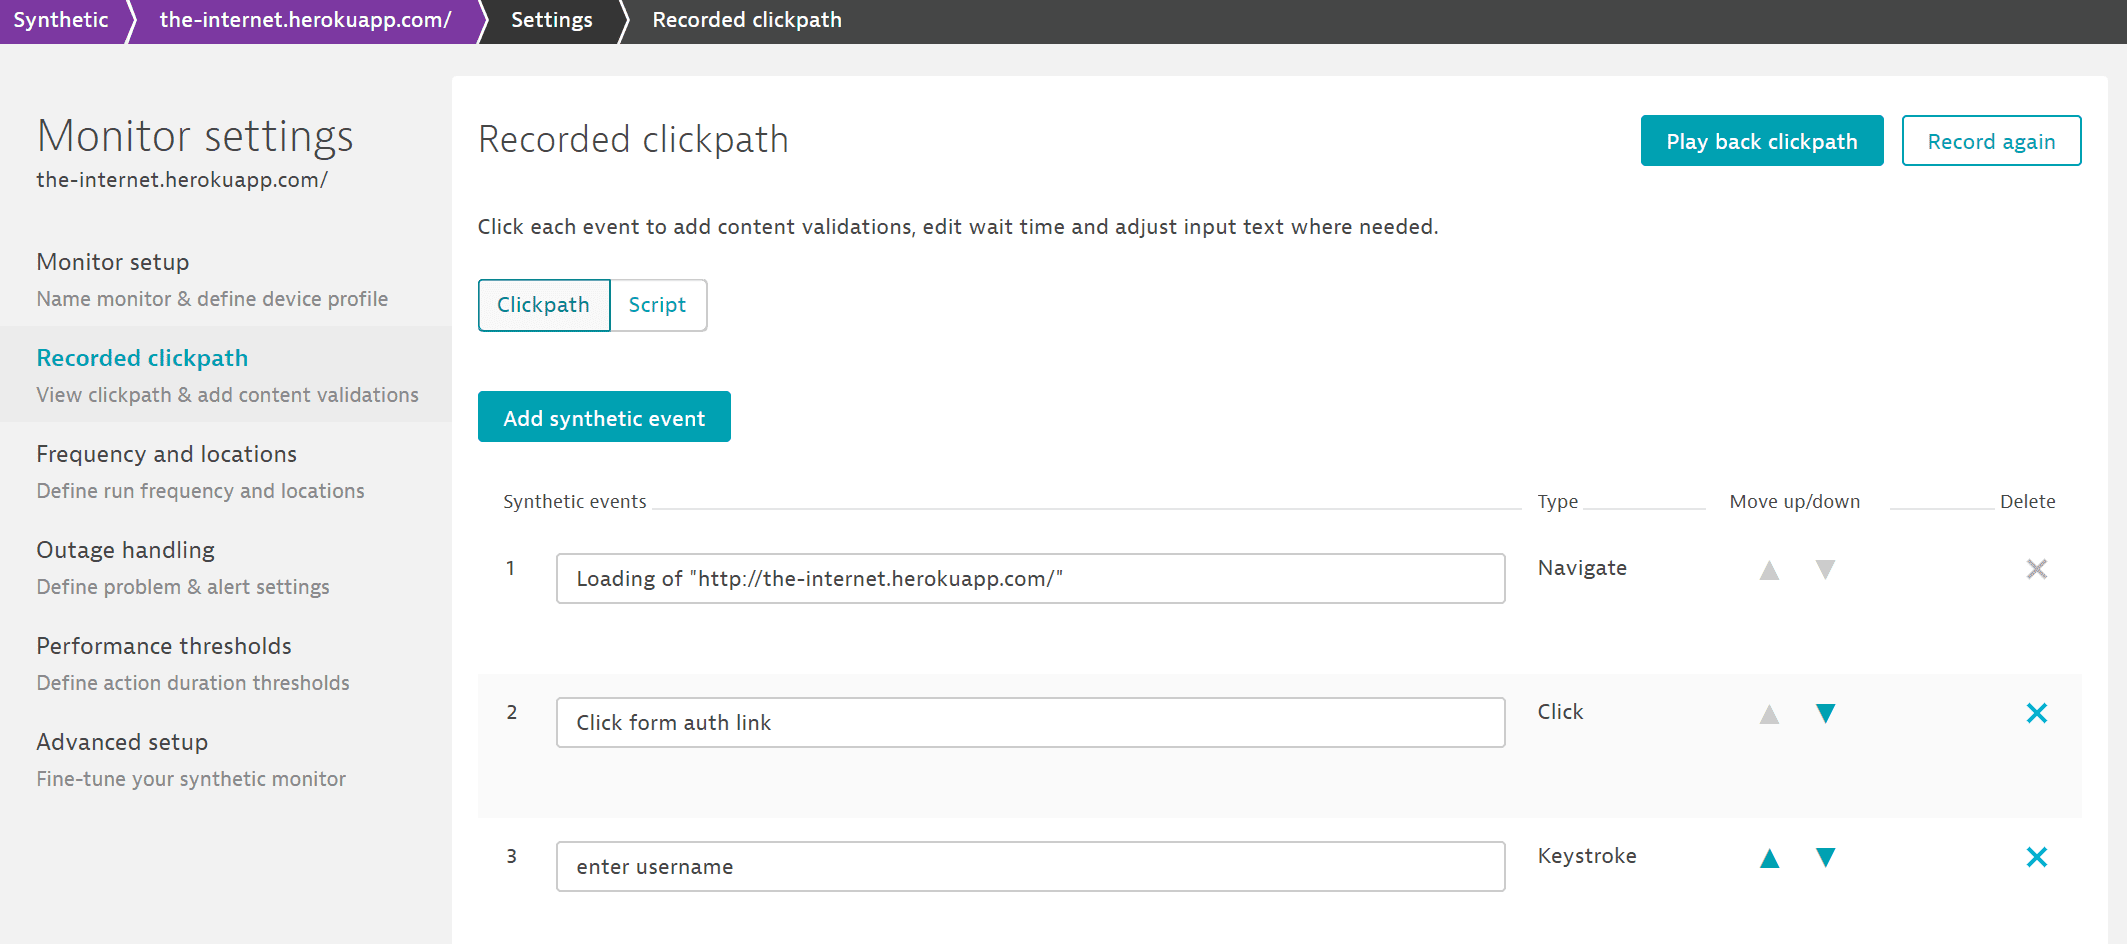
When recording or editing a clickpath, you'll notice that your interaction with your web application is captured in terms of events. The screenshots below show events captured during script recording and in edit mode.


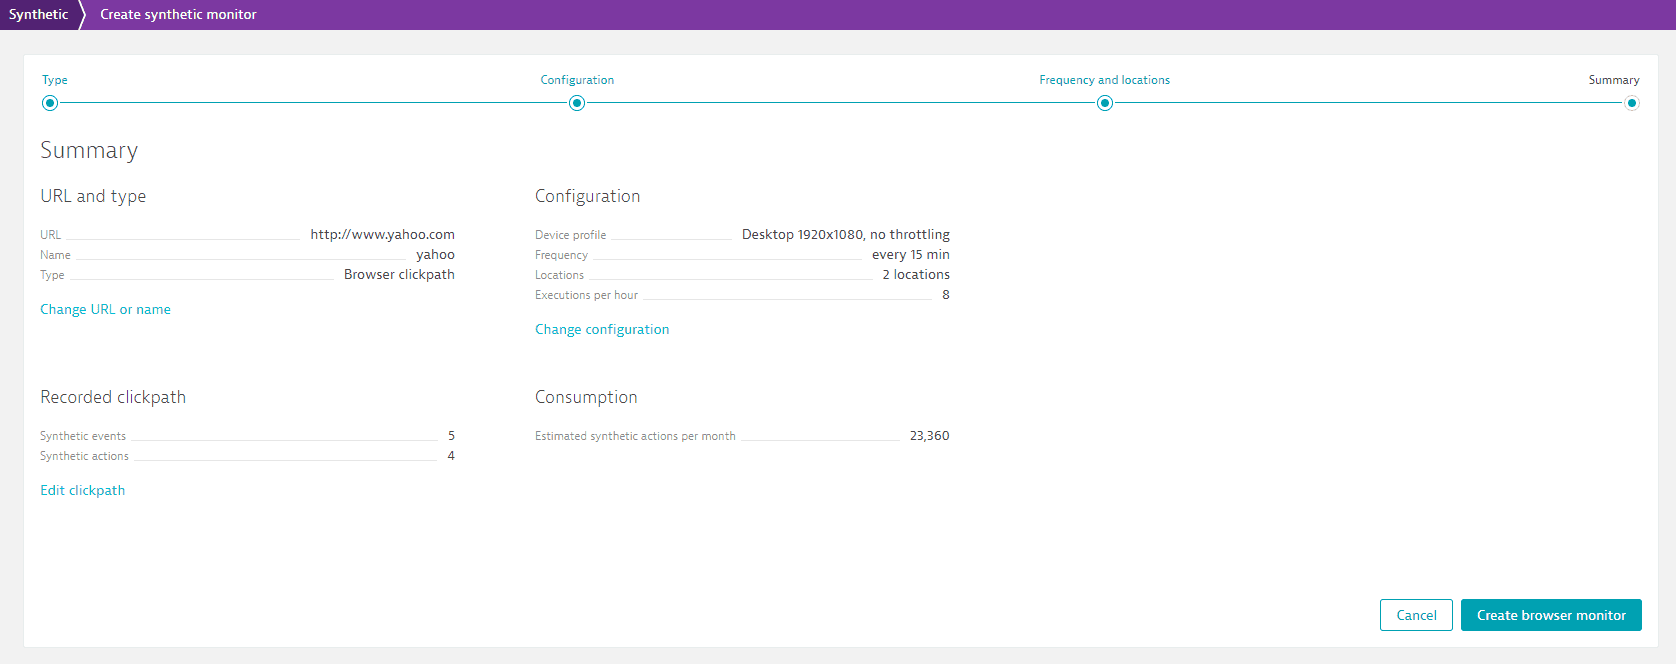
An event isn't the same thing as an action—only events that trigger web requests are actions, so your script might not have as many actions as events. Events such as clicking an input field or entering text into a form don't trigger network requests. These events are important from a functional perspective but don’t generate any performance data. When first setting up a clickpath, the Summary page clearly outlines the number of events versus actions in your clickpath.

You can access and edit your event list at any time: Select your monitor in Synthetic Classic > Edit > Recorded clickpath.
 Synthetic Classic