Ingest Checkmarx security findings, scan events, and audit logs
- Latest Dynatrace
- Extension
This page aligns with the new Grail® security events table. For the complete list of updates and actions needed to accomplish the migration, follow the steps in the Grail security table migration guide.
Ingest Checkmarx Software Composition Analysis and Container Security findings, scan events, and audit logs into Dynatrace as security events. With runtime context from Dynatrace, you can focus on the vulnerabilities that affect running production applications.
Get started
Overview
Dynatrace integration with Checkmarx allows you to unify and contextualize Checkmarx security findings and audit activity for visualization, analysis, and automation in Dynatrace.
Checkmarx provides security scanning capabilities such as Software Composition Analysis and Container Security, which scan code and build artifacts to identify security issues.
Dynatrace ingests and enriches Checkmarx findings with runtime context to help DevSecOps teams filter and prioritize the risks that affect production applications and code artifacts.
Use cases
With the ingested data, you can accomplish various use cases, such as
Requirements
See below for the Checkmarx and Dynatrace requirements.
Checkmarx requirements
-
A Checkmarx subscription with access to the security capabilities used by this integration, including:
-
An API key for authentication. The user generating the API key must have one of the following permissions:
view-applications,ast-scanner,ast-viewer,view-audit-trail, orast-admin.
Dynatrace requirements
-
ActiveGate version 1.310+ that must
- Run the Extensions 2.0 framework
- Reach the Checkmarx API endpoints
-
Permissions: For required permissions, go to Hub, select
 Extensions, and display Technical information.
 -
Generate an access token with the
openpipeline.events_securityscope and save it for later. For details, see Dynatrace API - Tokens and authentication.
Activation and setup
-
In Dynatrace, search for Checkmarx One and select Install.
-
Follow the on-screen instructions to configure the extension.
-
Verify configuration by running the following queries in
 Notebooks:
-
For audit logs:
fetch logs| filter log.source=="Checkmarx" -
For finding events:
fetch security.events| filter dt.system.bucket == "default_securityevents"| filter event.provider=="Checkmarx"AND event.type=="VULNERABILITY_FINDING" -
For scan events:
fetch security.events| filter dt.system.bucket == "default_securityevents"| filter event.provider=="Checkmarx"AND event.type=="VULNERABILITY_SCAN"
-
-
After the extension is installed and working, you can access and manage it in Dynatrace via
Extensions. For details, see About Extensions.
Details
How it works
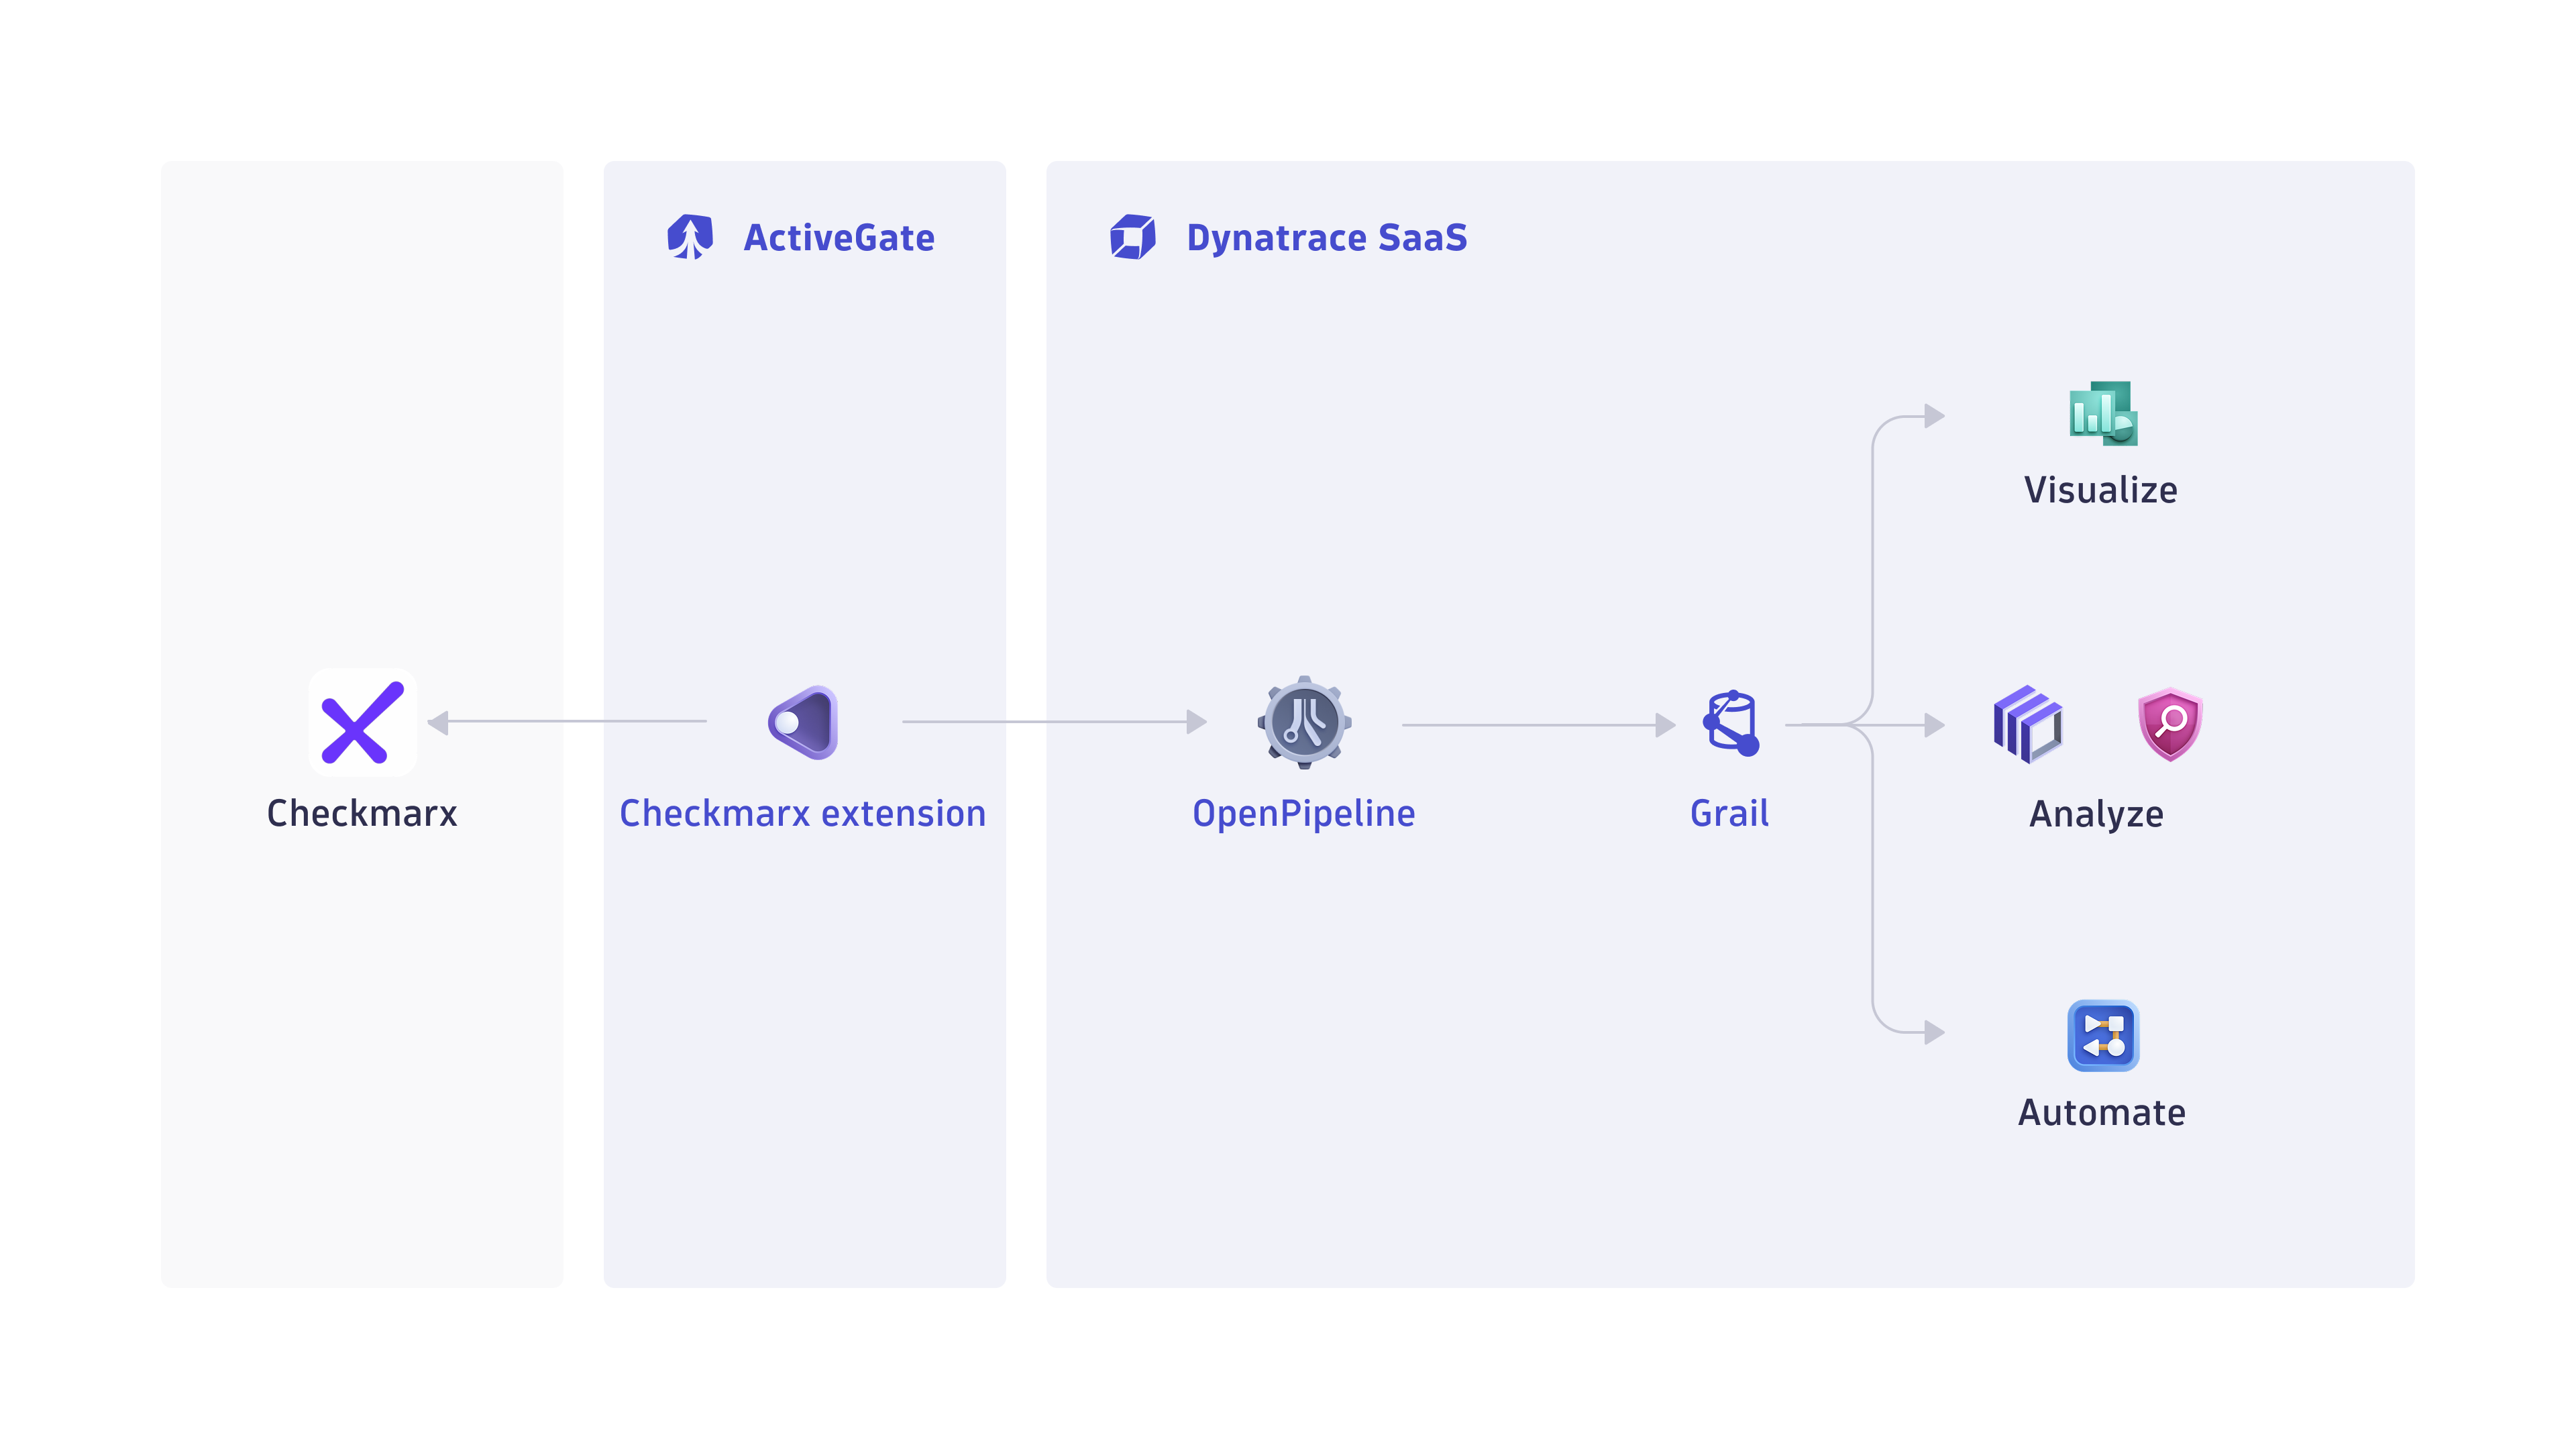
Dynatrace integration with Checkmarx is an extension running on Dynatrace ActiveGate. After you enable and configure the Dynatrace Checkmarx extension:
- It periodically collects security findings and audit logs using Checkmarx APIs.
- Dynatrace ingests the fetched data and maps it to the Dynatrace Semantic Dictionary.
- Dynatrace stores the data in a bucket called
default_securityevents(for details, see Built-in Grail buckets).
Licensing and costs
For billing information, see Events powered by Grail.
FAQ
Which Checkmarx products does Dynatrace integrate with?
This integration ingests security findings and scan events from the following products:
Which data model is used for the security logs and events coming from Checkmarx?
-
Vulnerability finding events store individual vulnerability findings reported by Checkmarx per affected artifacts and components.
-
Vulnerability scan events indicate scan coverage for individual artifacts.
-
Audit logs represent user activity logs.
Which Checkmarx security findings does Dynatrace import?
-
If you configure the extension to ingest data at an interval of
nhours, each run ingests all security events updated in the lastnhours. -
On the first ingest, Dynatrace considers findings updated in the last
mhours, wheremis the first ingest interval configured in the monitoring configuration. -
If Dynatrace detects no new or updated findings, it ingests none.
Which extension fields are added to the core fields of events ingested from Checkmarx?
The checkmarx namespace is added for Checkmarx-specific attributes on top of the core security event schema. The full upstream payload is stored in event.original_content.
Example fields:
checkmarx.project.id: Checkmarx project identifier.checkmarx.project.name: Project name.checkmarx.project.branch: Source branch associated with the scan or finding.checkmarx.application.id: Checkmarx application identifier.checkmarx.application.name: Checkmarx application name.checkmarx.finding.is_ignored: Boolean flag indicating whether the finding is marked as ignored.
How is risk score normalized for Checkmarx findings?
Dynatrace normalizes severity and risk scores for all findings ingested through this integration. This helps you prioritize findings consistently, regardless of their source. For details, see Severity and score normalization.
dt.security.risk.score is mapped from the Checkmarx numeric score returned as finding.score by the vulnerability findings API.
dt.security.risk.level is derived from dt.security.risk.score using the following mapping:
dt.security.risk.level (mapped from dt.security.risk.score) | dt.security.risk.score (mapped from finding.score) |
|---|---|
CRITICAL | 9.0 – 10.0 |
HIGH | 7.0 – 8.9 |
MEDIUM | 4.0 – 6.9 |
LOW | 0.1 – 3.9 |
NONE | 0.0 |