Upgrade metric selectors to DQL
- Dynatrace Classic
- Upgrade guide
- 20-min read
Grail metrics are queried with DQL, while Classic metrics are queried using metric selectors.
This guide shows how to convert Dynatrace Classic metric selector expressions to DQL so you can smoothly and efficiently transition to Latest Dynatrace.
Why upgrade?
- Advanced query capabilities: DQL lets you filter, aggregate, join, and transform data in a single query, going beyond what Classic metric selectors support.
- Full power of Grail: Converting your queries lets you use Grail metrics in
 Notebooks,
  Dashboards, and other Dynatrace apps.
What will you do?
- Automatically convert your Classic metric selector queries to DQL using the built-in conversion tool.
- For queries that can't be converted automatically, manually convert them by mapping Classic aggregations, transformations, and filters to their DQL equivalents.
- See common DQL equivalents for Classic metric selectors.
- Troubleshoot converted queries whose results don't match the original Classic metric selector.
Before you begin
Prerequisites
- Access to Notebooks or Dashboards to test and validate your converted DQL queries.
Prior knowledge
- Familiarity with Metrics Classic and metric selector syntax.
- Basic understanding of Grail and DQL.
- Familiarity with creating DQL queries in Notebooks or Dashboards.
How to upgrade
To upgrade your Classic metric selectors to DQL queries:
- Automatically convert your metric selectors using the built-in converter in
 Data Explorer.
 - Manually convert selectors that the automatic converter can't handle, using DQL and the mapping tables on this page.
- Verify your converted queries to confirm the results match your expected Classic metric data.
Automatically convert
Use Data Explorer and Dashboards to convert your existing Classic metric selector queries into DQL.
-
Go to
Data Explorer to create and run your query.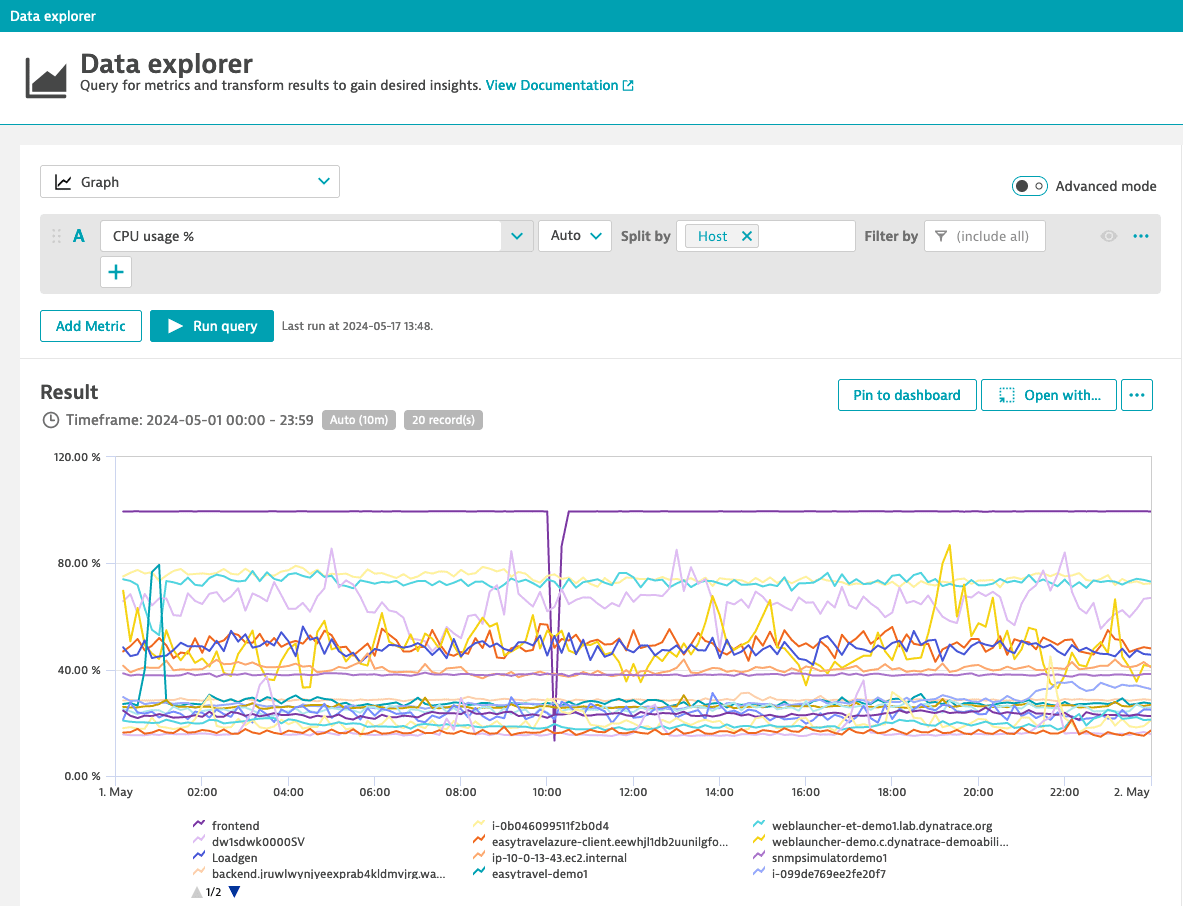 Data Explorer showing a Classic metric selector query in standard mode
 -
Select Open with… in the upper-right corner of the Result section.
-
Follow the displayed instructions to:
- Add the DQL query as a tile to a new or existing Dashboard.
- Open the DQL query in a new or existing Notebook.
-
View the query in
Dashboards or Notebooks and verify the output.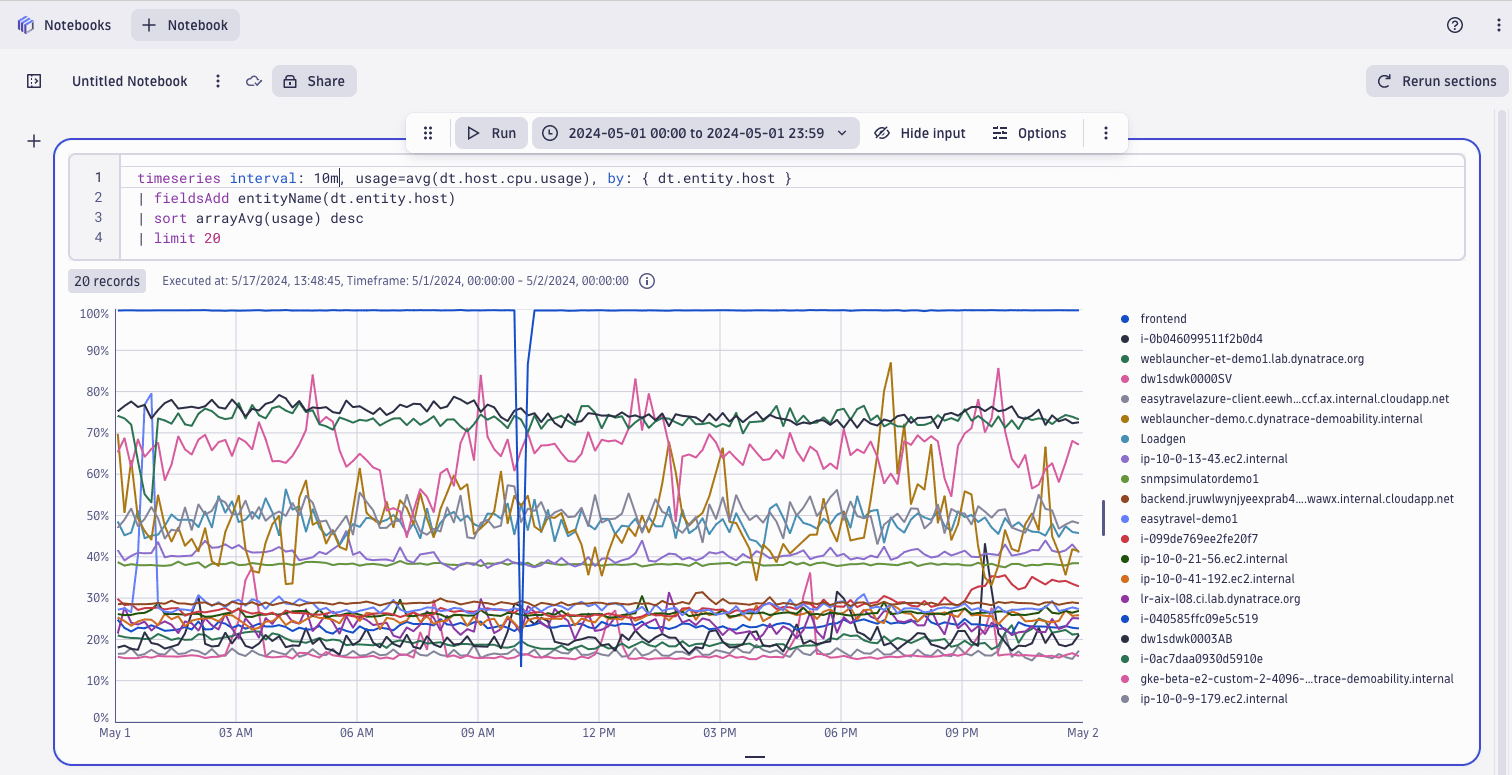 Notebook showing the automatically converted DQL query result
Here is a before-and-after of the Classic metric selector and the DQL query:
-
Classic metric selector
builtin:host.cpu.usage:splitBy("dt.entity.host"):sort(value(auto,descending)):limit(20) -
Equivalent DQL query
timeseries usage = avg(dt.host.cpu.usage), by: { dt.entity.host }| fieldsAdd entityName(dt.entity.host)| sort arrayAvg(usage) desc| limit 20
Manually convert
If your metric selector is not automatically convertible, you can manually convert it to DQL.
- Check that your metric can be converted. To do this, look through the conversion examples below. If you can't find your Classic metric selector there look through Built-in Metrics on Grail to find metrics with focused migration guides.
- Check that all Classic transformations in your metric selector are supported.
- Begin converting your metric selector. At the start, focus on the DQL timeseries command. Several Classic aggregations and transformations, including
filterandsplitBy, can be mapped in this initial command. - Remaining arithmetic and transformations that don't belong in the
timeseriescommand can be added with additional DQL commands as described below.
Verify your converted queries
Whether you've automatically or manually converted your Classic metrics, run your DQL queries in Notebooks or Dashboards and verify that the results align with your expected Classic metric data.
Conversion examples
The following examples show how to convert common Classic metric selector patterns to DQL. Each subsection covers a specific operation type with side-by-side comparisons of the Classic syntax and its DQL equivalent.
The sections below present before-and-after examples that you can use when converting a Classic metric selector to DQL.
Aggregations
Classic metric selectors can use the following aggregations: avg, sum, min, max, count, and percentile.
The DQL timeseries command (see DQL metric commands) uses the same aggregations on a one-to-one basis:
| Classic metric selector | DQL query |
|---|---|
|
|
The following sections provide examples of how to convert aggregations for specific use cases.
Time rollup
Occasionally you might need to use a time rollup that is different from your aggregation.
This example calculates the average, across all hosts, of the maximum CPU usage of each host. Your time rollup is max, while your aggregation is avg. In this scenario, use the rollup parameter of the timeseries command (see DQL metric commands).
| Classic metric selector | DQL query |
|---|---|
|
|
Value aggregation
The Classic value aggregation performs a sum for count metrics, and is therefore equivalent to the timeseries sum aggregation.
| Classic metric selector | DQL query |
|---|---|
|
|
Auto aggregation
The Classic metric selector includes a pseudo-aggregation called auto. Based on the metric's metadata, auto selects the default aggregation for that metric.
As DQL doesn't have an equivalent pseudo-aggregation, you need to specify the aggregation explicitly.
For example, the Classic metric builtin:host.cpu.usage defaults to the avg aggregation, so in DQL you would use the avg aggregation explicitly.
| Classic metric selector | DQL query |
|---|---|
|
|
To find your metric's default aggregation, look up the defaultAggregation property of your metric via the Classic metric browser or the Classic metric API.
Classic metric selectors don't require an explicit aggregation. If the metric selector doesn't include an aggregation, the auto transformation is used implicitly.
Count aggregation
The Classic metric selector count aggregation returns either cardinality or number of observations.
Each has an equivalent DQL query.
-
Cardinality. This can be converted to DQL with the
countfunction. For example, this counts the number of hosts.Classic metric selector DQL query builtin:host.cpu.usage:splitBy():counttimeseries num_hosts = count(dt.host.cpu.usage) -
Number of observations. This is returned in some scenarios, according to the metric's metadata, and can be converted to DQL by using
sumwithrollup. For example, this counts the number of processed records.Classic metric selector DQL query log.latency_average:splitBy():counttimeseries observations = sum(log.latency_average, rollup:total)
How do I know if my query counts cardinality or observations?
If you use the automatic converter, this performs all these checks for you. Otherwise, provide a simple Classic metric selector and analyze the DQL output to determine whether it returns cardinality or observations.
Group by
The Classic splitBy transformation is equivalent to the timeseries by parameter.
| Classic metric selector | DQL query |
|---|---|
|
|
The Classic merge transformation is a counterpart to the splitBy transformation.
In DQL, it can also be expressed equivalently with the timeseries by parameter.
Filter
The Classic filter transformation is equivalent to the timeseries filter parameter.
The following table shows Classic filter conditions and their DQL equivalents.
| Classic filter condition | DQL function |
|---|---|
prefix | |
suffix | |
contains | |
eq | |
ne | |
in | |
series | Constructed from comparisons to array functions |
existsKey | Not supported on Grail; ignored on conversion |
remainder | Not supported on Grail; ignored on conversion |
How do I convert series filter conditions?
The Classic series condition consists of an aggregation and a comparison operator, which can be reconstructed from array functions and comparison operators respectively.
In this example, avg is replaced by arrayAvg, and gt is replaced by the > (greater than) operator.
-
Classic metric selector
builtin:host.disk.usedPct:splitBy("host.name"):filter(series(avg,gt(20))) -
The equivalent expression in DQL
timeseries percent = avg(dt.host.disk.used.percent),by:{host.name}| filter arrayAvg(percent) > 20
Arithmetic
The following examples show the use of arithmetic in Classic metric selectors and in DQL.
-
Classic metric selectors mix arithmetic with queries.
-
DQL separates these steps.
- First you assign the inputs.
- Then you perform the calculation within a
fieldsAddcommand.
Additionally, DQL uses variable assignment and sequential commands to improve on the arithmetic in Classic metric queries. To learn more about arithmetic with DQL, see DQL operators.
-
Classic metric selector
(100 * builtin:kubernetes.resourcequota.limits_memory_used/ builtin:kubernetes.resourcequota.limits_memory):splitBy("k8s.resourcequota.name") -
The equivalent expression in DQL
timeserieslimits_memory_used=avg(dt.kubernetes.resourcequota.limits_memory_used),limits_memory=avg(dt.kubernetes.resourcequota.limits_memory),by:{k8s.resourcequota.name}| fieldsAdd// use square brackets [] to perform timeseries arithmeticlimits_memory_usage = 100 * limits_memory_used[] / limits_memory[]
The DQL approach is both easier to read and easier to write.
- Operations are shorter and clearer by using descriptive variables instead of long expressions.
- Variable assignment replaces repeated expressions—you need to write an expression only once.
- Complex expressions can be broken down into separate steps and further commented.
- Series operations are generic. The same functions and operators can be performed with
fetch logsor themakeTimeseriescommand, for example.
Transformations
This section shows how to convert Classic metric transformations to DQL.
Default transformation
The Classic default transformation is equivalent to the timeseries default parameter.
| Classic metric selector | DQL query |
|---|---|
|
|
Default always transformation
The Classic default(x, always) transformation is a special case of default, and is equivalent to the timeseries nonempty parameter.
| Classic metric selector | DQL query |
|---|---|
|
|
Delta transformation
The Classic delta transformation is equivalent to the arrayDelta function in DQL.
| Classic metric selector | DQL query |
|---|---|
|
|
Fold transformation
The Classic metric selector fold transformations can be converted to DQL with the equivalent array function.
| Classic metric selector | DQL query |
|---|---|
|
|
| Fold transformation | DQL array function |
|---|---|
| |
| |
| |
| |
| |
| |
| |
| |
| There are two ways to determine the equivalent DQL:
An empty |
fold with single value visualizations
The fold transformation has some implicit uses to be aware of in Data Explorer and Dashboards. The Single value visualization, shown below, displays both a line chart and a single value.
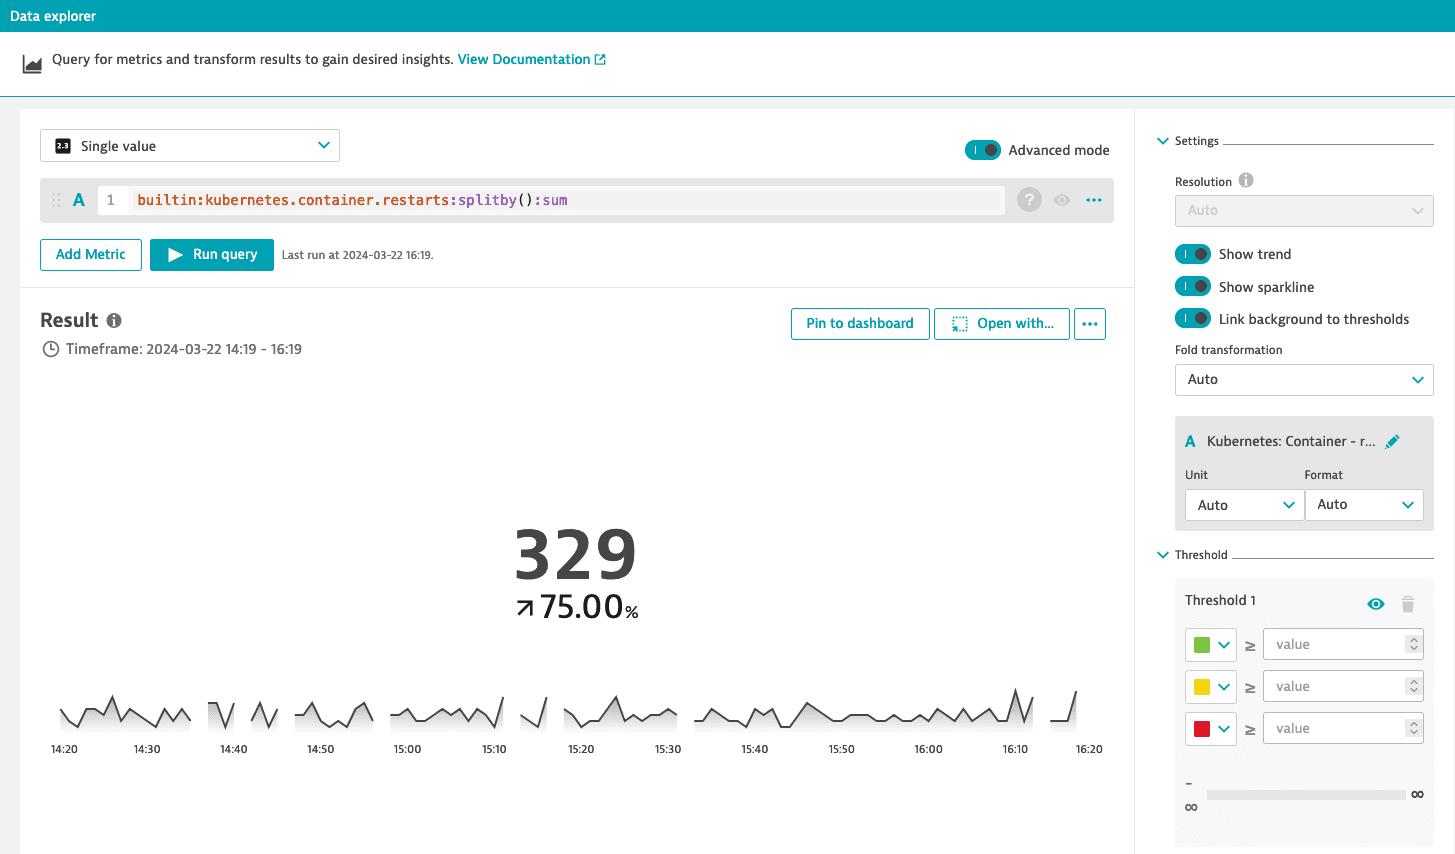
Use the scalar:true aggregation parameter to get a single value instead of a time series. To reproduce this visualization, consider the following Classic metric selector query and its DQL equivalent.
| Classic metric selector | DQL query |
|---|---|
|
|
Last transformation
The Classic last transformation is equivalent to the arrayLast function in DQL.
| Classic metric selector | DQL query |
|---|---|
|
|
Last real transformation
The Classic lastReal transformation has no equivalent in DQL. If you are automatically converting your Classic metric selectors, the conversion will use arrayLast, see Last transformation.
Limit transformation
The Classic limit transformation is equivalent to the limit command in DQL.
| Classic metric selector | DQL query |
|---|---|
|
|
Parents transformation
The Classic parents transformation is not supported in DQL, because in most cases it isn't needed: since data is already enriched in Grail, you can split by the parent dimension directly.
Partition transformation
The Classic partition transformation is unique in that it creates new series from existing ones. The equivalent DQL uses iterative expressions.
-
Classic metric selector query (formatted for clarity)
builtin:host.disk.avail:splitby("host", "disk"):avg:fold(avg)`:partition("disk_usage",value("underused",gt(450000000000)),value("optimal",otherwise)) -
The equivalent expression in DQL
timeseries avail=avg(dt.host.disk.avail), by: { host, disk }| fieldsAdd avail=arrayAvg(avail)| fieldsAdd disk_usage=if(avail>450000000000, "underused", else: "optimal")
How do I partition timeseries elements?
The example below shows how to partition timeseries elements.
-
Classic metric selector query (formatted for clarity)
builtin:host.disk.avail:auto:limit(3):partition("disk_usage",value("underused",gt(450000000000)),value("optimal",otherwise)) -
The equivalent expression in DQL
timeseries avail=avg(dt.host.disk.avail), by: { dt.entity.disk, dt.entity.host }| expand disk_usage=array("underused", "optimal")| fieldsAdd avail=if(disk_usage=="underused",if(avail[]>450000000000, avail[]),else:if(disk_usage=="optimal", if(NOT(avail[]>450000000000), avail[])))| filterOut isNull(arrayMin(avail))| limit 3| filterOut isNull(arrayMin(avail)) // arrayMin returns null if all elements are null
Rate transformation
The Classic rate transformation is equivalent to the timeseries rate parameter.
| Classic metric selector | DQL query |
|---|---|
|
|
Rollup transformation
The Classic rollup transformations can be converted to DQL with the equivalent array function.
| Classic metric selector | DQL query |
|---|---|
|
|
The moving window is time-agnostic and so the interval parameter has been fixed to 1m to ensure a five-minute moving average. While the Classic rollup transformation adjusts the query timeframe to include past data points, the DQL function does not adapt the query timeframe automatically, which means the first n data points are null (if n is the window size). To get the same results, modify the query timeframe on the timeseries command using the from: parameter.
DQL array functions are not a direct replacement for rollup when migrating Metric Events configurations.
| Rollup transformation | DQL array function |
|---|---|
| |
| |
| |
| |
| |
| DQL does not directly support the Classic
Only observations within the query timeframe are counted. Consequently, the first five minutes of the result do not represent a full five-minute rolling count. |
| DQL does not directly support the Classic
This result is not a moving average, but a sequence of five-minute time intervals. Consequently, a two-hour timeframe has only 24 data points, not 120. |
Smooth transformation
The Classic smooth transformation has no equivalent in DQL.
Sort transformation
The Classic sort transformation is equivalent to the sort command in DQL.
| Classic metric selector | DQL query |
|---|---|
|
|
Timeshift transformation
The Classic timeshift transformation is equivalent to the timeseries shift: parameter.
| Classic metric selector | DQL query |
|---|---|
|
|
Unit transformation
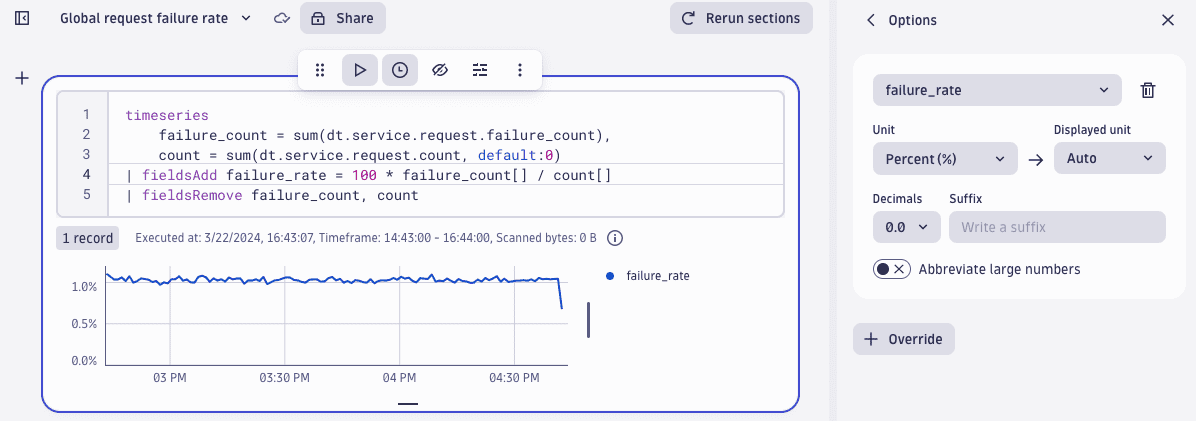
The Classic setUnit and toUnit transformations are not supported directly in DQL.
Instead, you can use the Units and formats section of any chart.
FAQ
How can I find the new metric key for my Classic metric on Grail?
A list of Classic metrics and their equivalents in Grail can be found in the Built-in Metrics on Grail. Bear in mind that not all Classic metrics have Grail equivalents or migration guides, and some metrics are not yet supported on Grail.
Why doesn't my Classic metric work in DQL?
You should use Grail metrics when querying DQL. A list of Classic metrics and their equivalents in Grail can be found in Built-in Metrics on Grail.
Some metrics are not supported on Grail and cannot be queried with DQL. For the full list, see Built-in Metrics on Grail.
Why can't I use the "Open with…" button in Data Explorer?
Not all Classic metric selectors have equivalent DQL. If you're not sure whether your Classic metric is supported on Grail, look it up on Built-in Metrics on Grail.
Why doesn't my new DQL query result match exactly after I converted my metric selector?
In the process of transitioning from Classic queries to Grail in Dynatrace, you might notice some differences in your query results. This difference is expected, as not all Classic metrics have direct equivalents in Grail. However, if you encounter differences where you expect the queries to match, review the following scenarios to understand why.
| Scenario | Guide |
|---|---|
The automatically converted DQL query returns no data on Grail. | Not all Classic metrics have equivalents in Grail, and some metrics are not yet supported on Grail. For a list of Classic metrics and their equivalents in Grail, see Built-in Metrics on Grail. |
The charts look similar, but the numbers are slightly different. | To reduce complexity, several metrics have been refactored and have no direct equivalents in Grail. The runtime metrics migration guide, service metrics migration guide, and Kubernetes metrics migration guide will help you migrate these queries to Grail. |
The | Grail uses a more accurate algorithm to calculate percentiles. Learn more in DQL metric commands. |
The | DQL uses the |
The chart looks similar, but the numbers are on a different scale. | Scale factor changes may indicate an issue in the metric calculation. In this case, please report the issue to the Dynatrace support team. |