Synthetic details for browser monitors
- Explanation
- 14-min read
Go to Synthetic Classic and select a browser monitor or clickpath to view the Synthetic details page, which provides an overview of the monitor's execution results with visualizations, problems, and monitor properties. Powered by the Dynatrace AI engine Davis, the Synthetic details page shows you at-a-glance information, which includes trend graphs, filters, and quick links to access monitor settings, problem details, or waterfall analysis for a failing event.
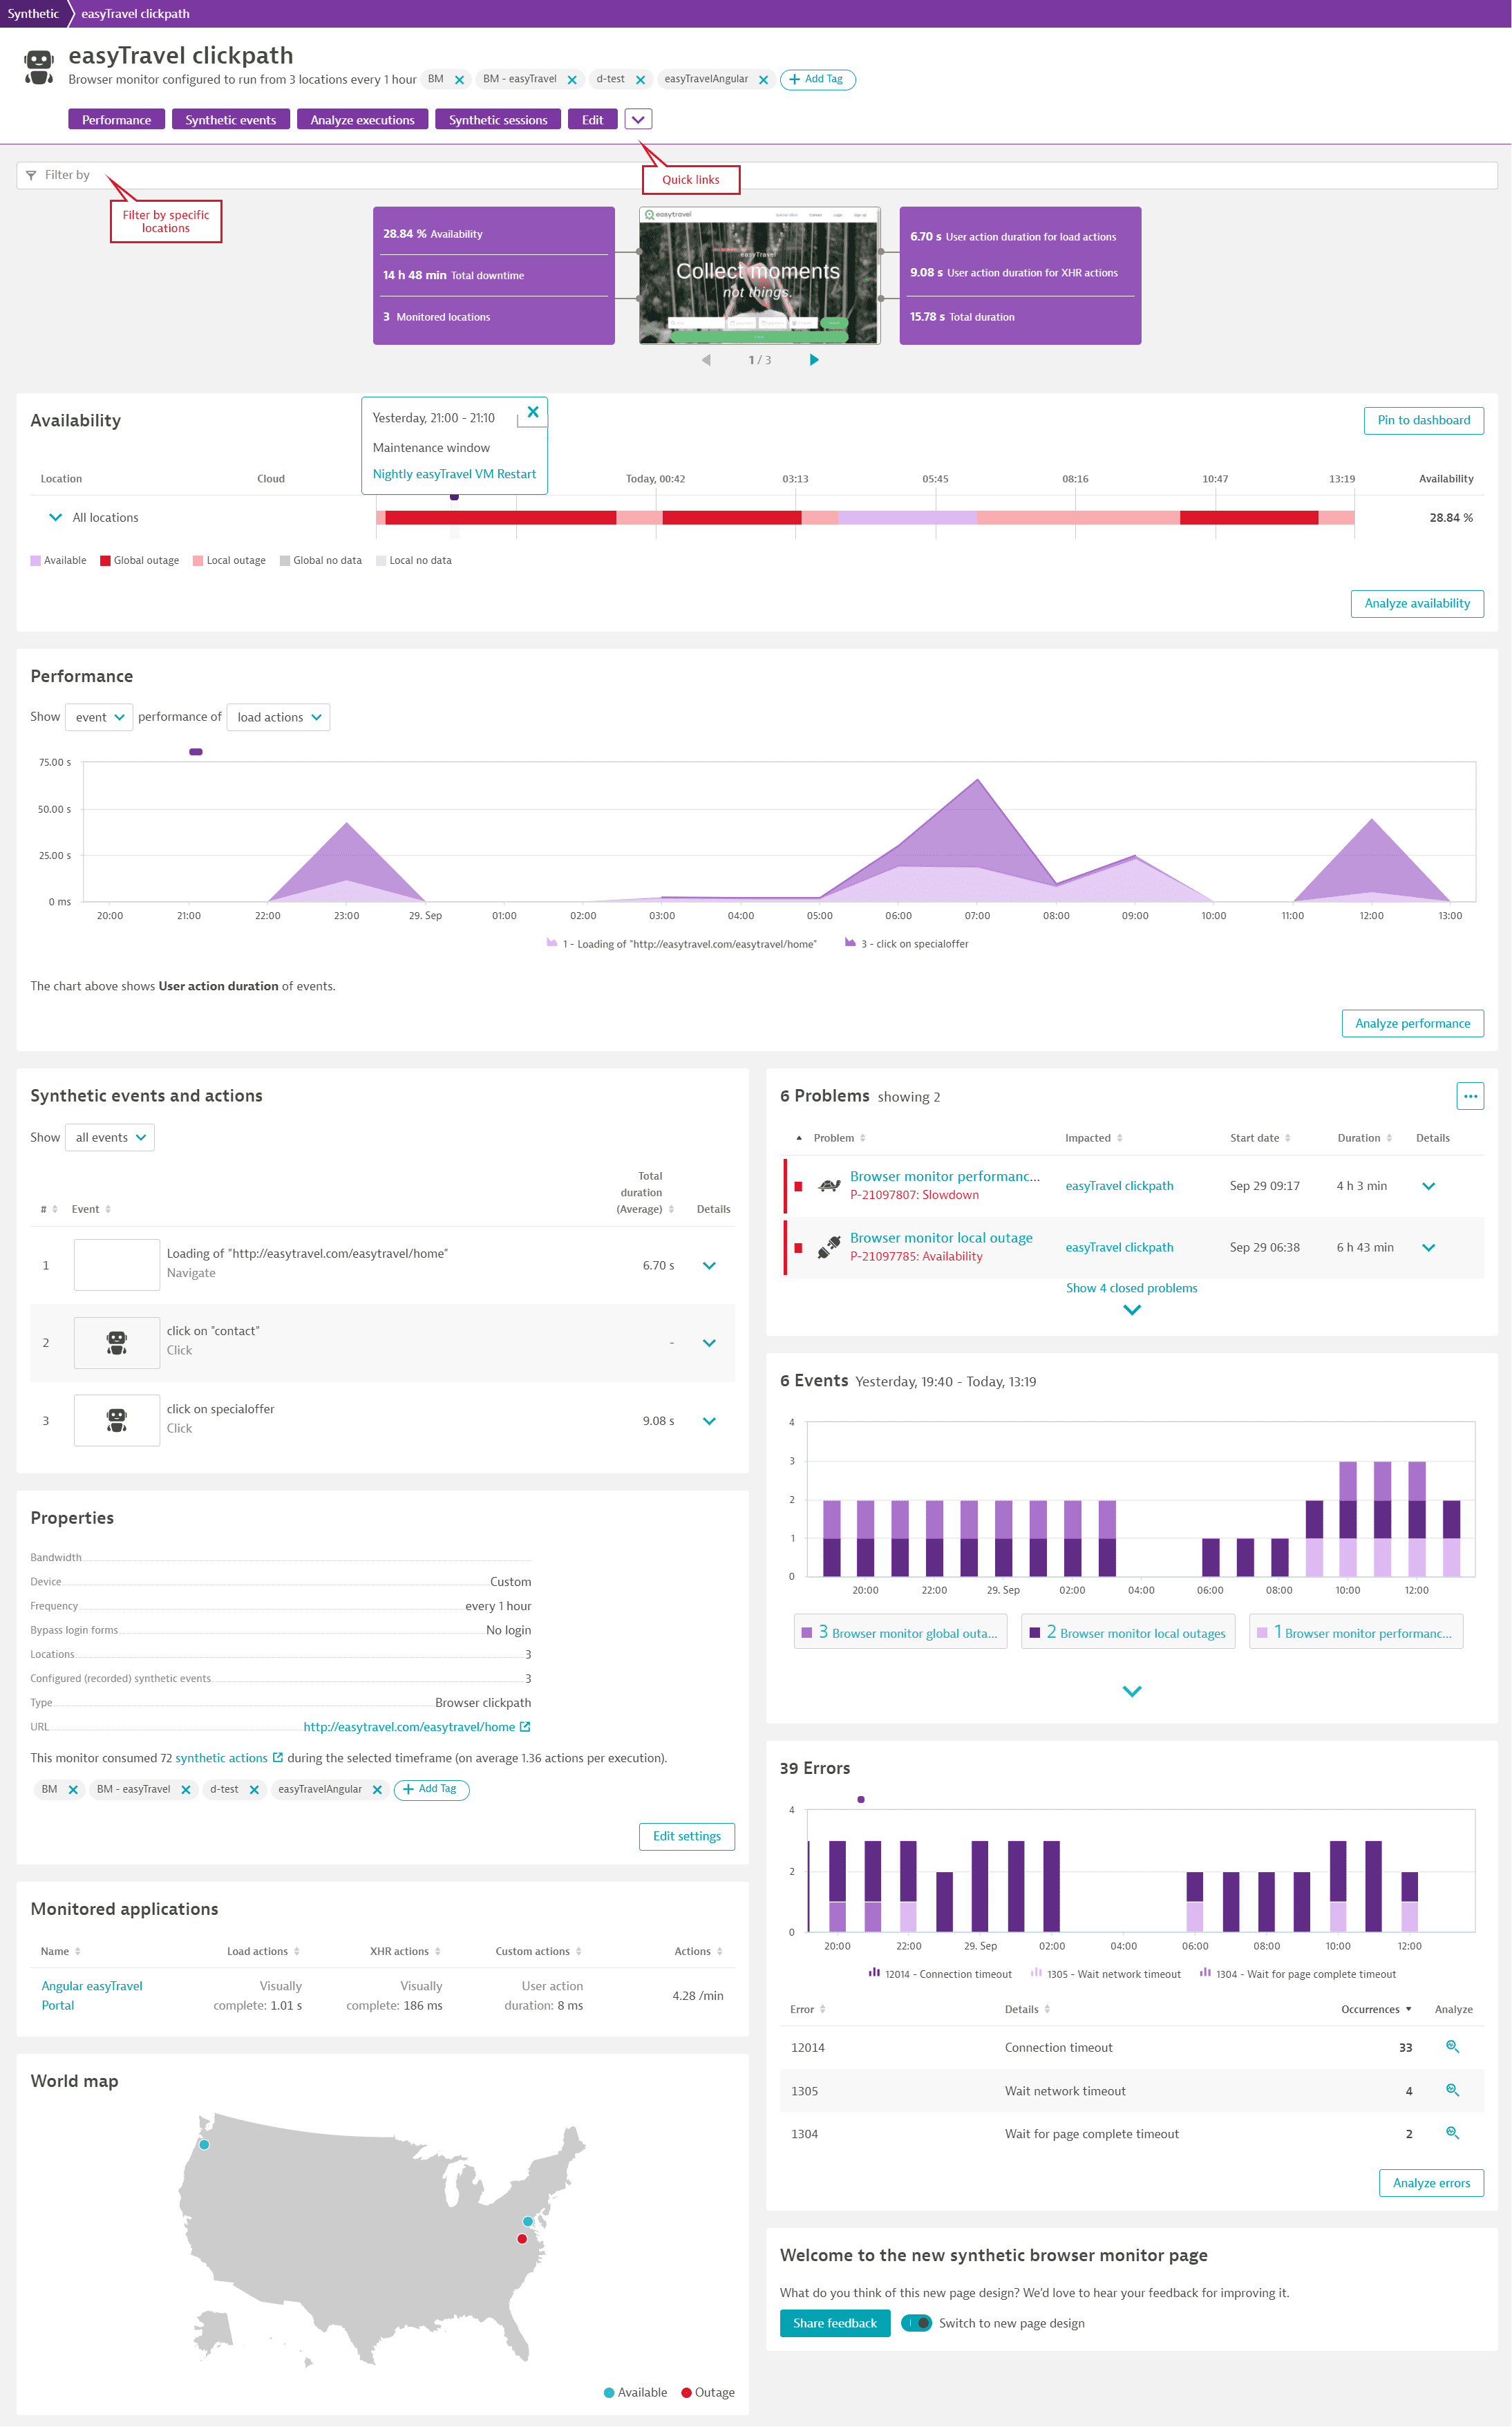
Learn about the new UI for browser monitor details
When you select a browser monitor in Synthetic Classic, you see a toggle that enables you to try out the new UI for browser monitor details. Turning on the toggle enables the new details page for all browser monitors in your environment.

For now, you can switch back and forth between the new and old versions of the details page so you can compare them. Please use the Share feedback button to tell us what you think about the new design. If you dismiss the panel at the top of the details page, the panel will move to the bottom of the page.

Metric visualizations
The top panel shows overall monitor availability or performance infographics for the selected timeframe. Select either infographic to go to the respective card. The Availability infographic shows availability percentage and any downtime for the selected timeframe. The performance infographic is customized to show your selected key performance metrics along with Total duration.
You can also scroll through reference screenshots for each of your monitor's script events.
Use the filter bar at the top of the page to filter all Synthetic details geographically—by Continent, Country, Region, monitoring Location, and Cloud provider.
Use the quick links in the upper-left corner to go directly to different cards in the details page or to access browser monitor settings (Edit, Disable, Delete). From here, you can also go to the Multidimensional analysis page to Analyze executions, view Synthetic sessions in the User sessions page for your associated application, or view an availability Report.
Tags applied to your browser monitor are shown below the monitor name. Select Add tag to apply additional tags. Note that tags can only be applied and deleted from the details page.
Purple markers above the availability or performance timelines indicate maintenance windows. Select a marker to view details of the window.
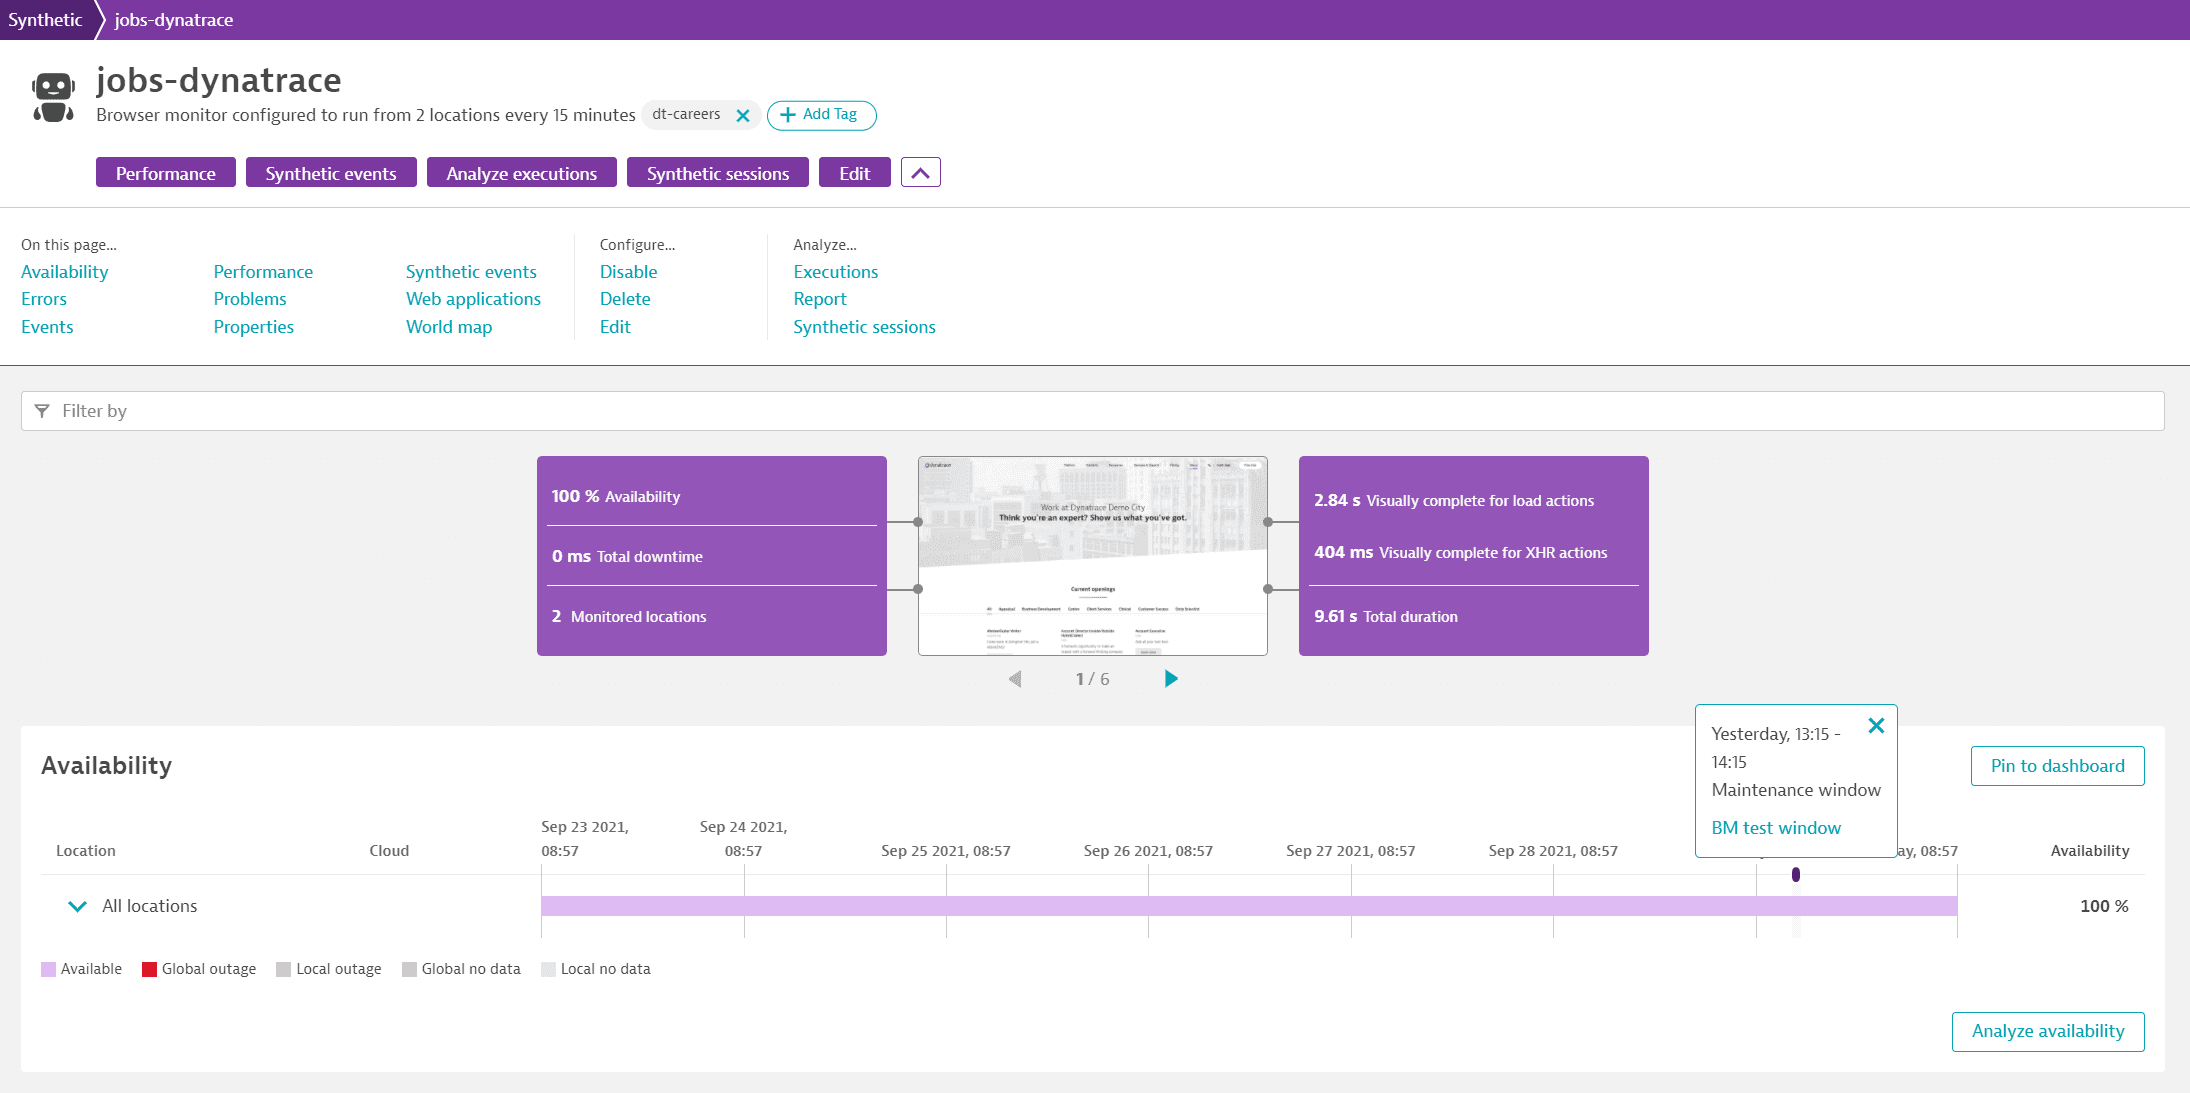
- Whether or not you see problems and receive alert notifications during maintenance windows depends on how you configure the maintenance windows.
- Maintenance windows may be excluded from availability calculations by applying a global setting.
Screenshots
Reference screenshots shown in the top panel of the Synthetic details page are taken if the monitor runs successfully when the monitor is created or edited, and thereafter, once every 24 hours from a random monitoring location (including private locations). Screenshots are taken at the end of each script event (even those without timings). You can scroll through screenshots here or select an image to view enlarged versions.
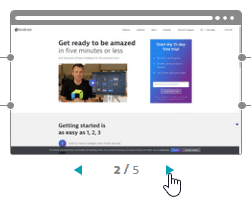
Note that reference screenshots are always the most current, even when viewing Synthetic details for a historical timeframe.
When a monitor fails, screenshots for every failing execution (SCoE) are available on the Multidimensional analysis page.
Screenshot storage
To view screenshots from private Synthetic locations, your Synthetic-enabled ActiveGate and the browser you access Dynatrace from must be able to access the Amazon S3 service.
- To view screenshots taken from private Synthetic locations, ensure that your firewall allows connections to
ruxit-synth-screencap.s3.amazonaws.com. - To store screenshots taken from private locations, ensure access to
ruxit-synth-screencap.s3-accelerate.amazonaws.com.- Note that screenshots are stored in a different folder for each monitoring environment, but the S3 Bucket is the same (
ruxit-synth-screencap). You can access the screenshots for each environment only via a direct link while logged in to the environment. - Data is encrypted by Amazon S3-managed key. This key is the same for all environments.
- Note that screenshots are stored in a different folder for each monitoring environment, but the S3 Bucket is the same (
Visit Can't see screenshots in browser monitor results in the Dynatrace Community for more information.
Availability
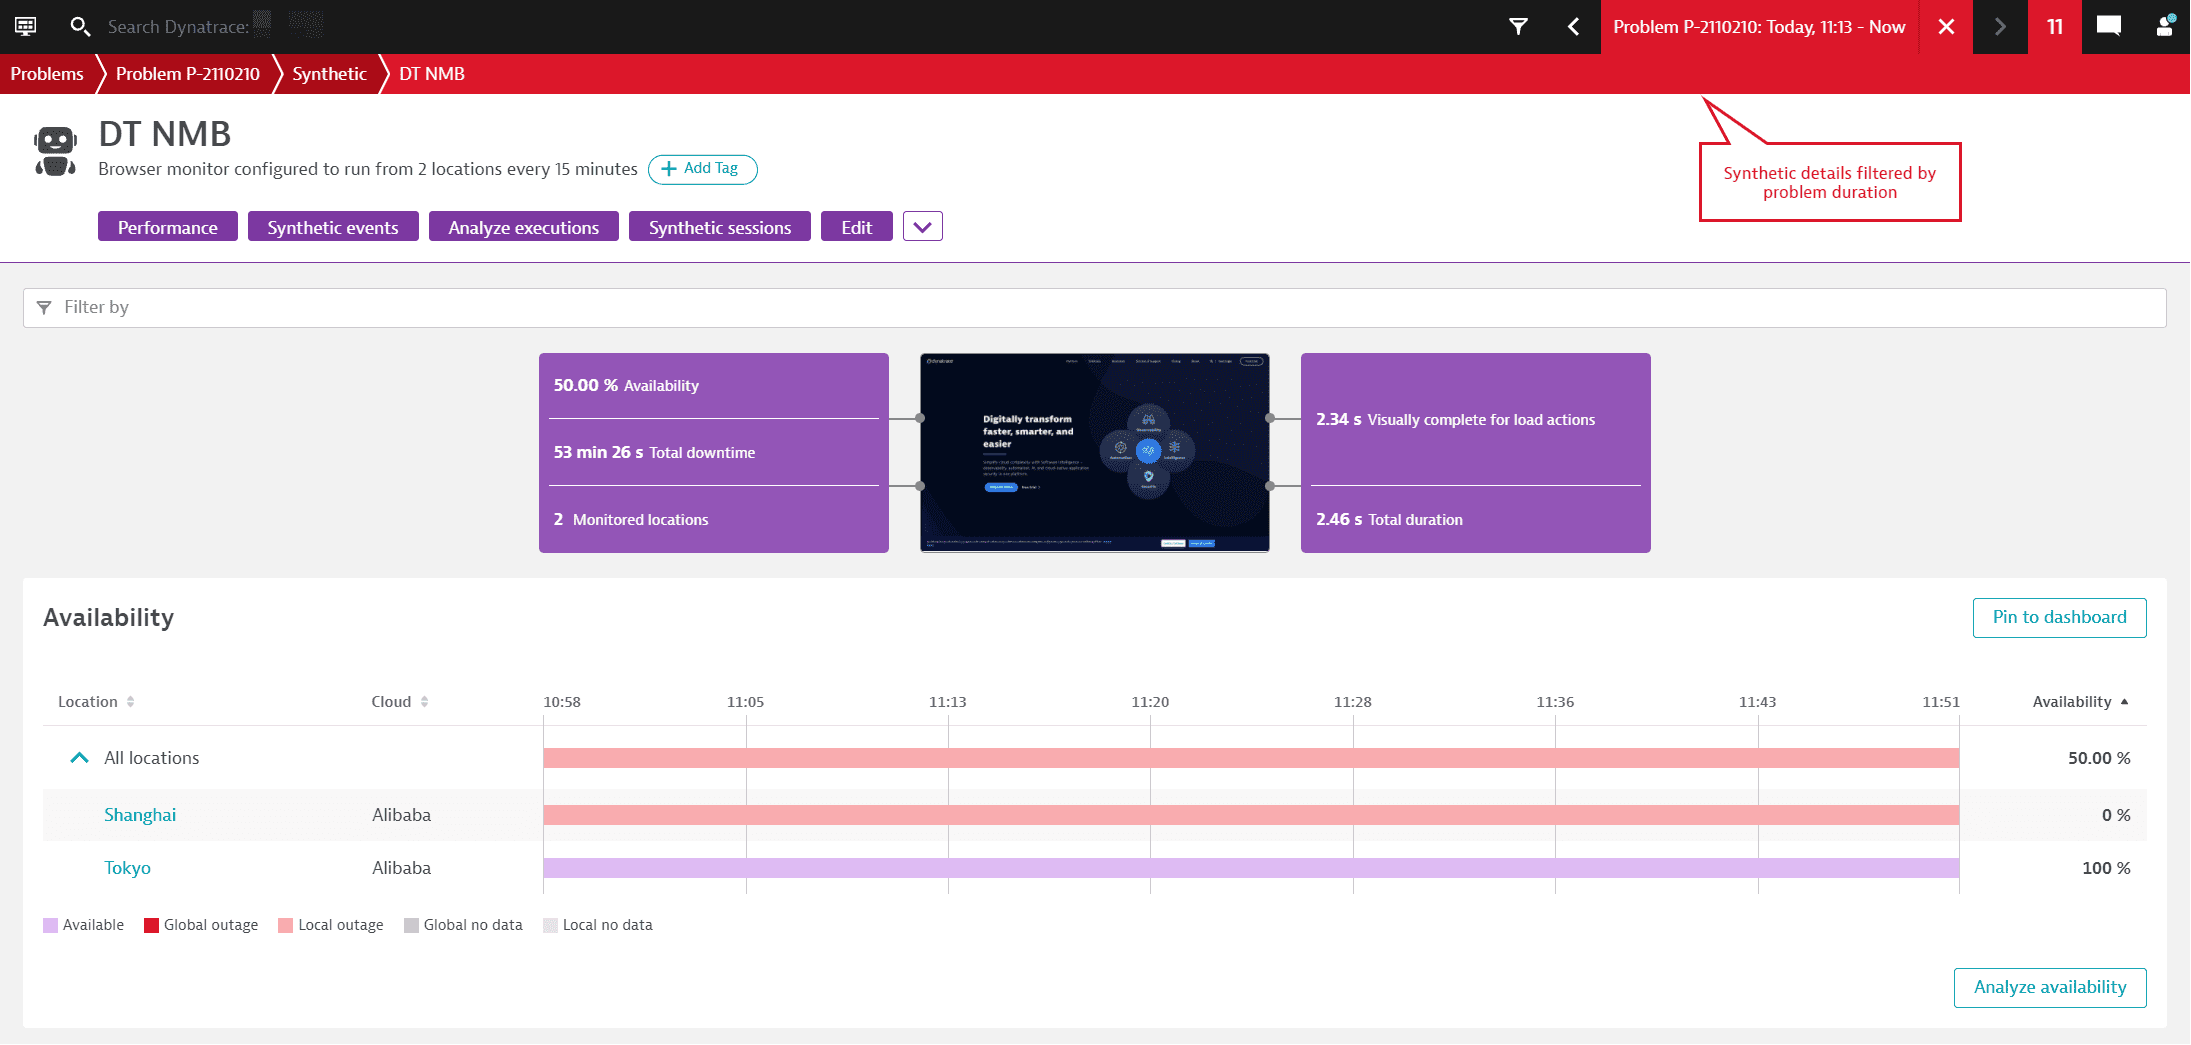
The Availability card shows overall availability across all monitor locations, with annotations for global/local outages and global/local missing data (as when the monitor is disabled).
Note that a monitor can be down at one or all locations even if no outage thresholds (global or local) have been set up. The outage duration is the sum of all downtimes in the selected timeframe, not counting overlapping downtimes. See Synthetic calculations for details on how availability and downtime are calculated.
The graph shows availability for each monitor location. You can sort locations by Location name, Cloud, or Availability.
Time periods with availability outages are blocked in red. Hover over the All locations graph to view information about the number of locations with outages or missing data for any given point in time.

Expand All locations to view availability graphs for each location. Select a block of monitor downtime (red) or availability (purple) in any location's timeline and then select Analyze to see Multidimensional analysis for availability filtered by that location. You can also select the location name; or select Analyze availability to see data points for all locations.
Select Pin to dashboard to pin a Browser monitor tile to a classic dashboard you own or a new classic dashboard.
Performance
The Performance card shows trend lines for Total duration for all actions in your monitor or for your selected key performance metric for load actions or XHR actions. You can view performance split by events or by monitoring locations.

Note that while Total duration is calculated as a summation, key performance metric values are averages (as for Visually complete), calculated separately for load actions and XHR actions.
Key performance metrics enable you to choose performance goals that best fit the variable needs of each application you monitor. For example, you might want to choose User action duration to optimize the performance of a traditional web application. For other applications where the speed of user interaction is more important than the UI, you might want to optimize the time it takes for JavaScript resources to load. The default is Visually complete for both load and XHR actions as it measures how long it takes for the visible portion of a user’s browser to be fully rendered.
As Dynatrace captures a list of key performance metrics out of the box, you can switch your selection in monitor settings and immediately have historical data available.
How to choose or switch a key performance metric
For each browser monitor or clickpath, you can choose a different key performance metric for load actions and XHR actions in edit mode after monitor creation.
Key performance metric values example
Key performance metric values are calculated as averages. Consider a login transaction consisting of three events resulting in one load action each:
- Initial page load (1 s Visually complete)
- Click on a login button (5 s Visually complete)
- Navigate to another page (3 s Visually complete)
The Visually complete timing for these load actions is 3 seconds while the Total duration could be 9 seconds.
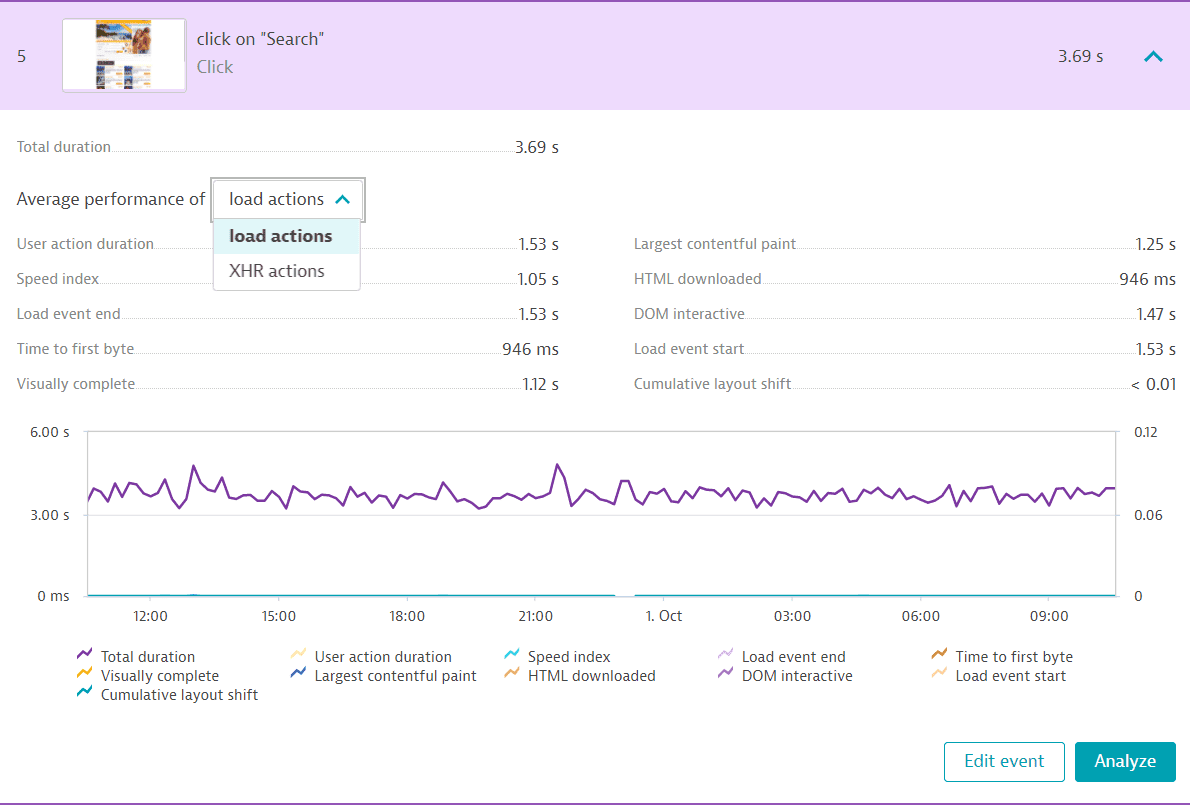
If you check the Synthetic events and actions card, you can see that performance is only calculated for events with timings. See Number of actions consumed by browser clickpaths for more information. So when viewing all actions, the Total duration graph excludes events with no network activity. When viewing load actions or XHR actions, you see key performance metric graphs for individual events that contain load actions and XHR actions, respectively. Note that an event can contain a combination of actions of different types, for example, two load actions and one XHR action.
Select an event or location in the legend to include or exclude it from the graph. Hover over the graph to see the performance (key performance metric or Total duration) of individual events or by location for a given point in time. Then click and select Analyze to see the corresponding analysis timeframe in the Multidimensional analysis page for performance, filtered by your selected action type. You can also select Analyze performance to see performance in the Multidimensional analysis page.
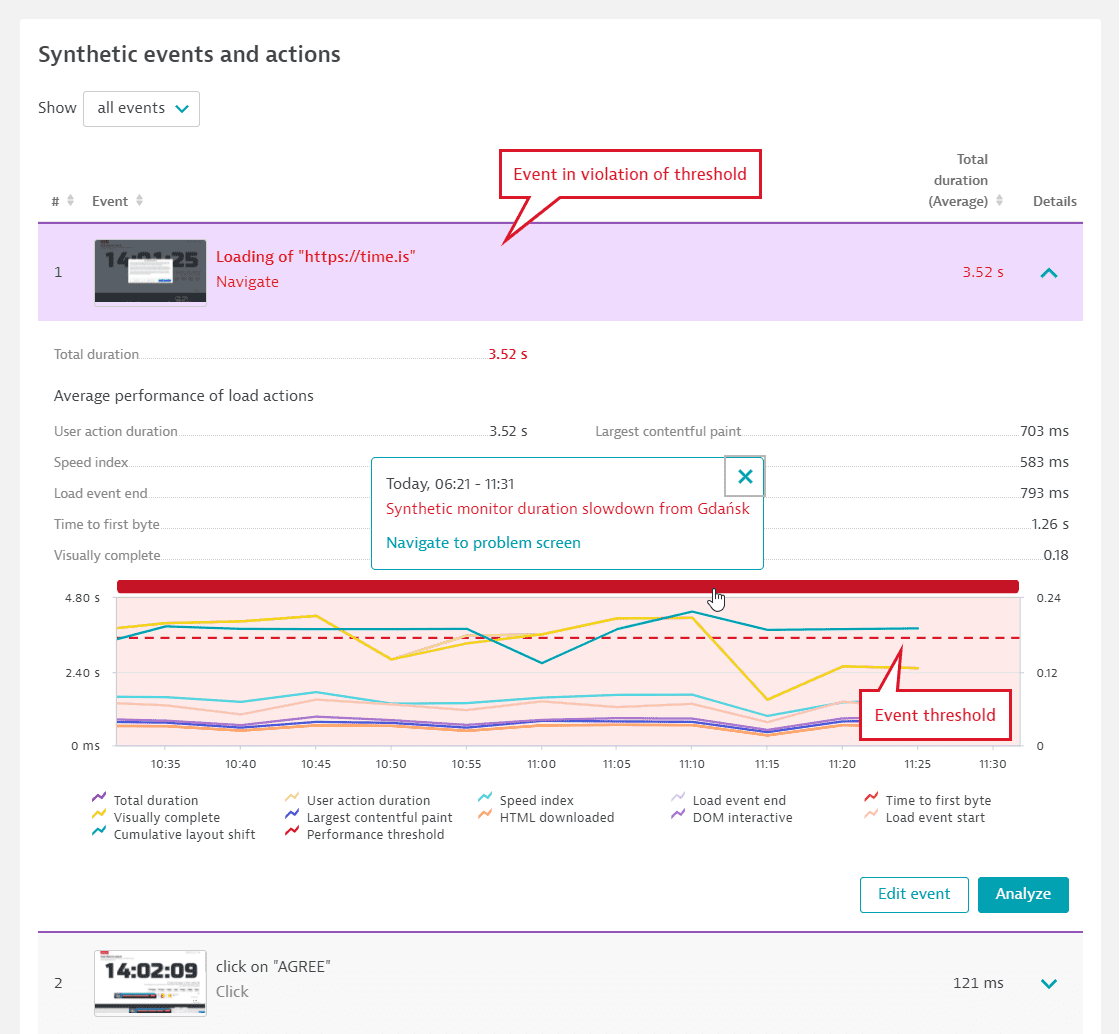
If there is a violation of the performance threshold for the Total duration of all events, a solid red bar appears above the all actions graph for the duration of the problem; the threshold appears as a dotted red line. Select the solid red bar to see the locations violating the threshold and a link to the problem overview page.

For a violation of an event-specific thresholds, the Synthetic events and actions card highlights the events in violation, their duration, and the thresholds involved.
Synthetic events and actions
The Synthetic events and actions card helps you distinguish between script events with and without timings. Select all events or select events with timings and the action type (load actions or XHR actions) to filter the card. When viewing all events, you see the average Total duration of the constituent actions. When viewing events by action type, you see your selected key performance metric.
Events are the recorded interactions that are simulated during the playback of a browser clickpath. Not all events necessarily trigger network requests, for example, clicking an input field or entering text into a form. These events are important from a functional perspective but don’t generate performance data. Events with timings, or events that trigger actions, are the basis of performance data.
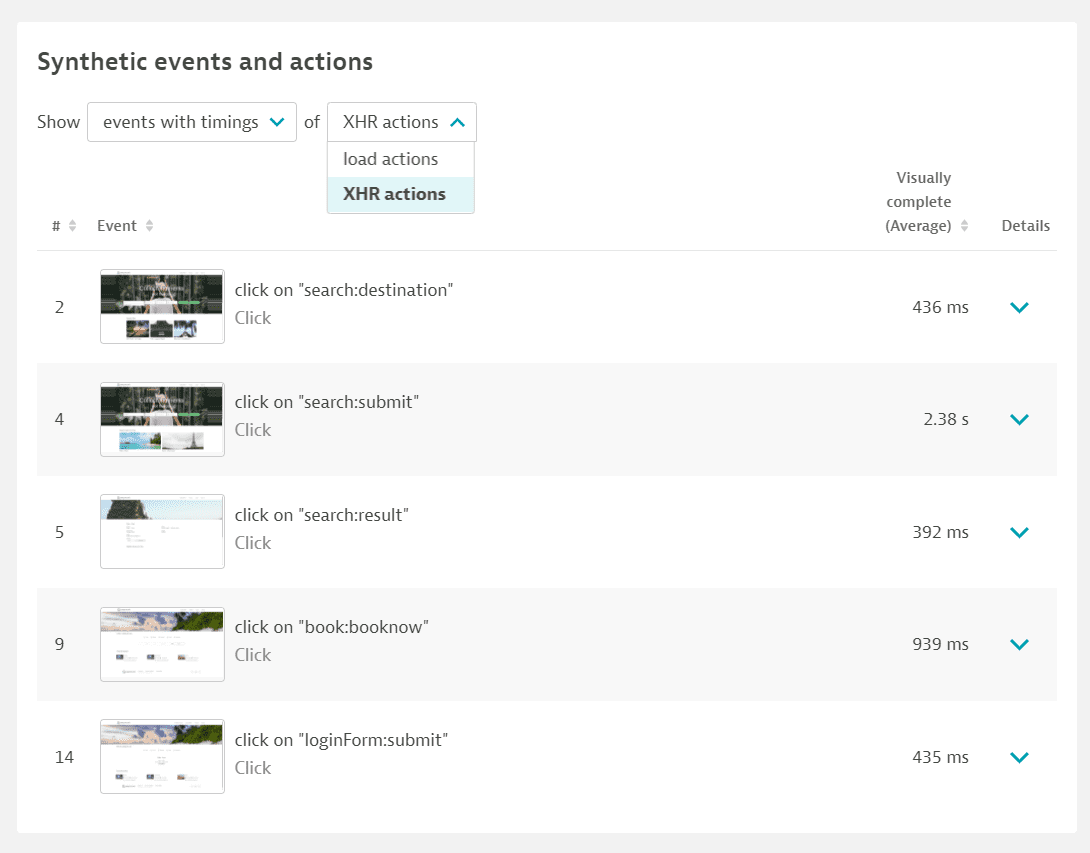
Expand an event with timings in the event list to compare all performance metrics for constituent actions in one graph. If the event has more than one type of action, you can opt to view metrics by action type. Select a metric in the legend to include or exclude it from the performance graph. Select Edit event to edit the script event in monitor settings. Select Analyze to view the Multidimensional analysis page for performance filtered by the event.
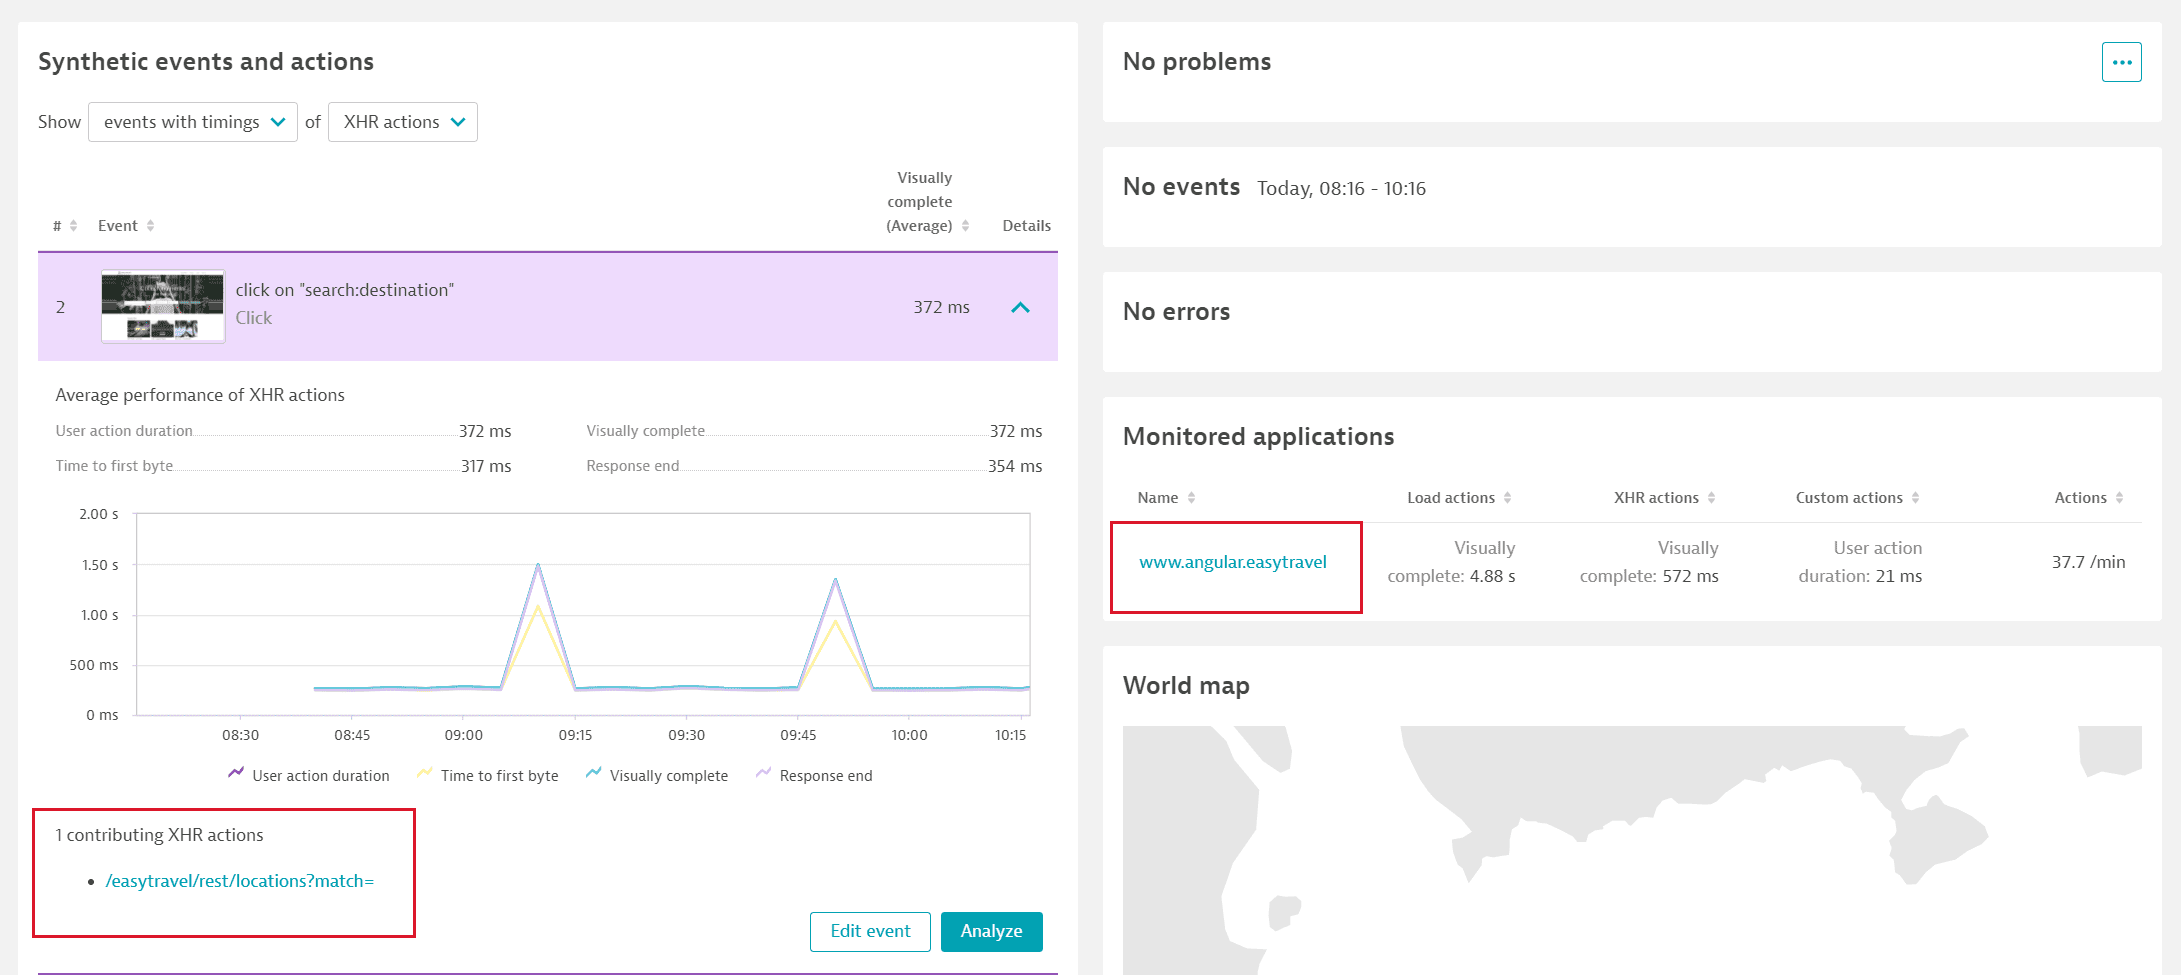
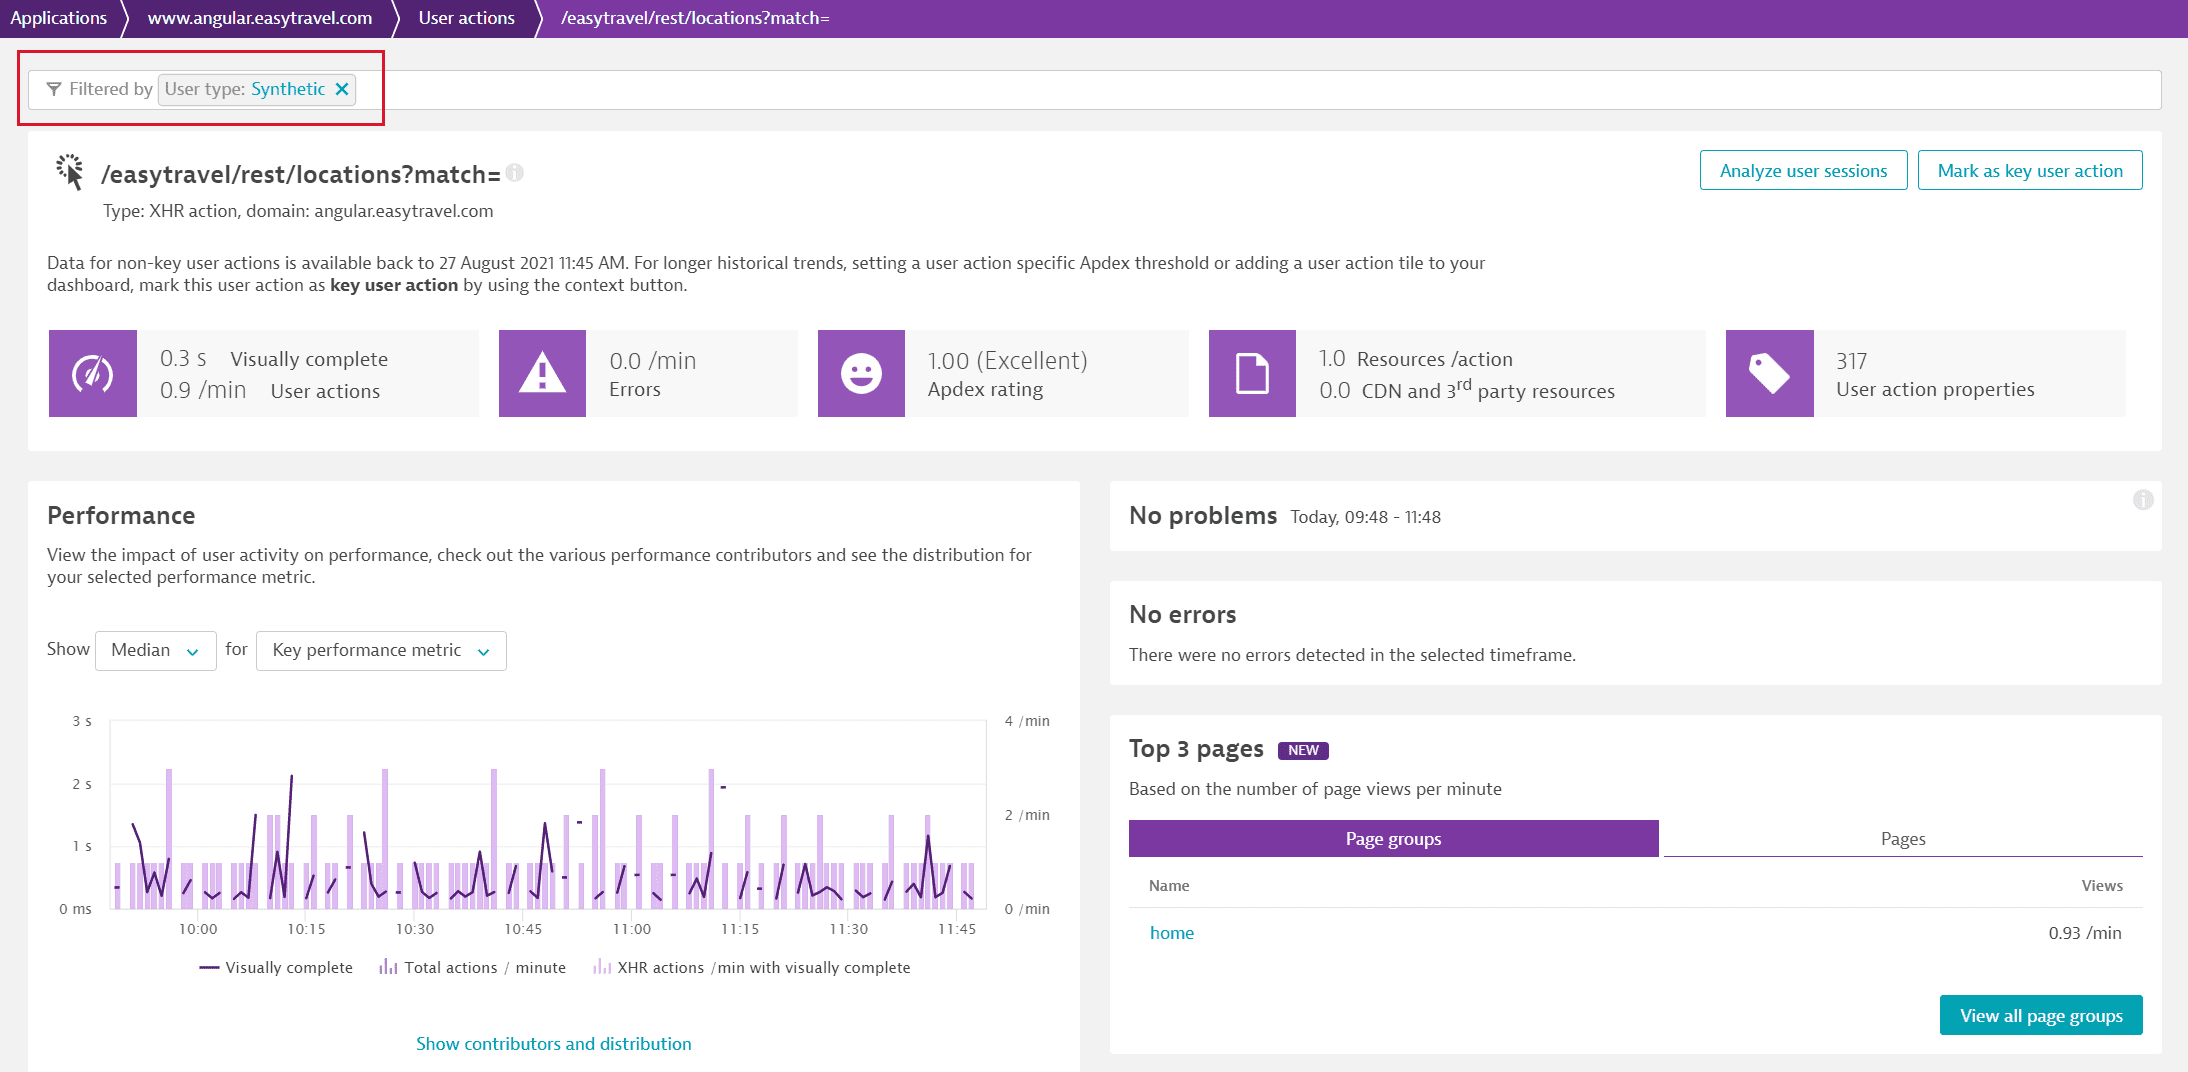
Dynatrace uses exactly the same technology to capture real user and synthetic data, so you can validate your synthetic monitoring results against real users easily. When a browser monitor has an associated application, Dynatrace automatically shows the real user actions for each Synthetic event with timings—select the contributing actions links. You are taken to the corresponding user action page, which you can filter for synthetic users.
Events are highlighted when they are in violation of their performance thresholds. Expand the event to see its timing and the violated threshold. A solid red bar appears above the stacked graph for the duration of the problem; the threshold appears as a dotted red line. Select the solid red bar to see the locations that violated the threshold and a link to the problem overview page; the corresponding problem is also shown on the Problems card.
Problems
The Problems card shows performance (threshold violation) and availability (local or global outage) problems when you enable the respective thresholds in monitor settings. Expand the card to see active as well as resolved problems for the selected timeframe.
There are three main problem types for browser monitors:
- Global outage (availability)
- Local outage (availability)
- Performance threshold violation (performance)
Any custom alerts based on user-defined thresholds are also displayed here.
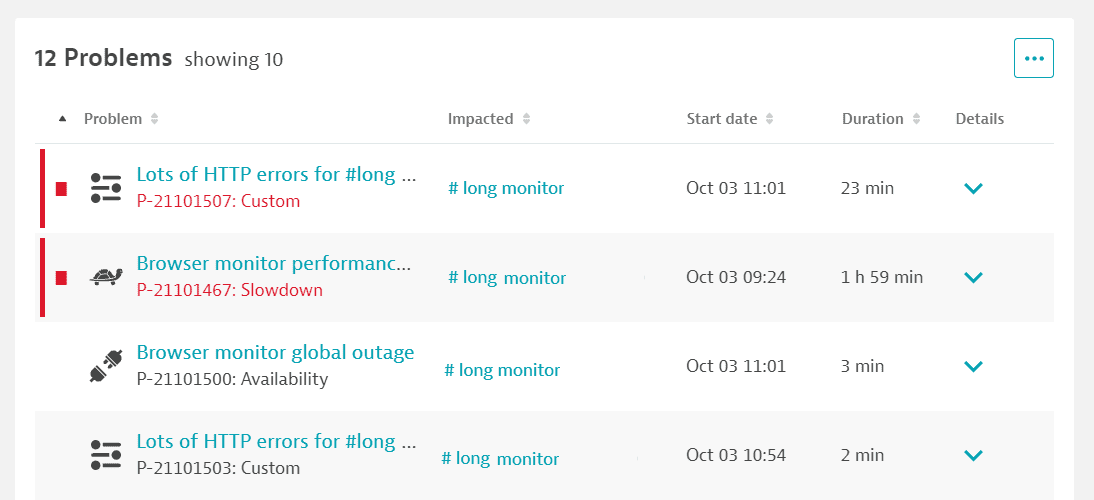
See Synthetic calculations for how availability and performance are calculated and how problems are generated and dismissed.
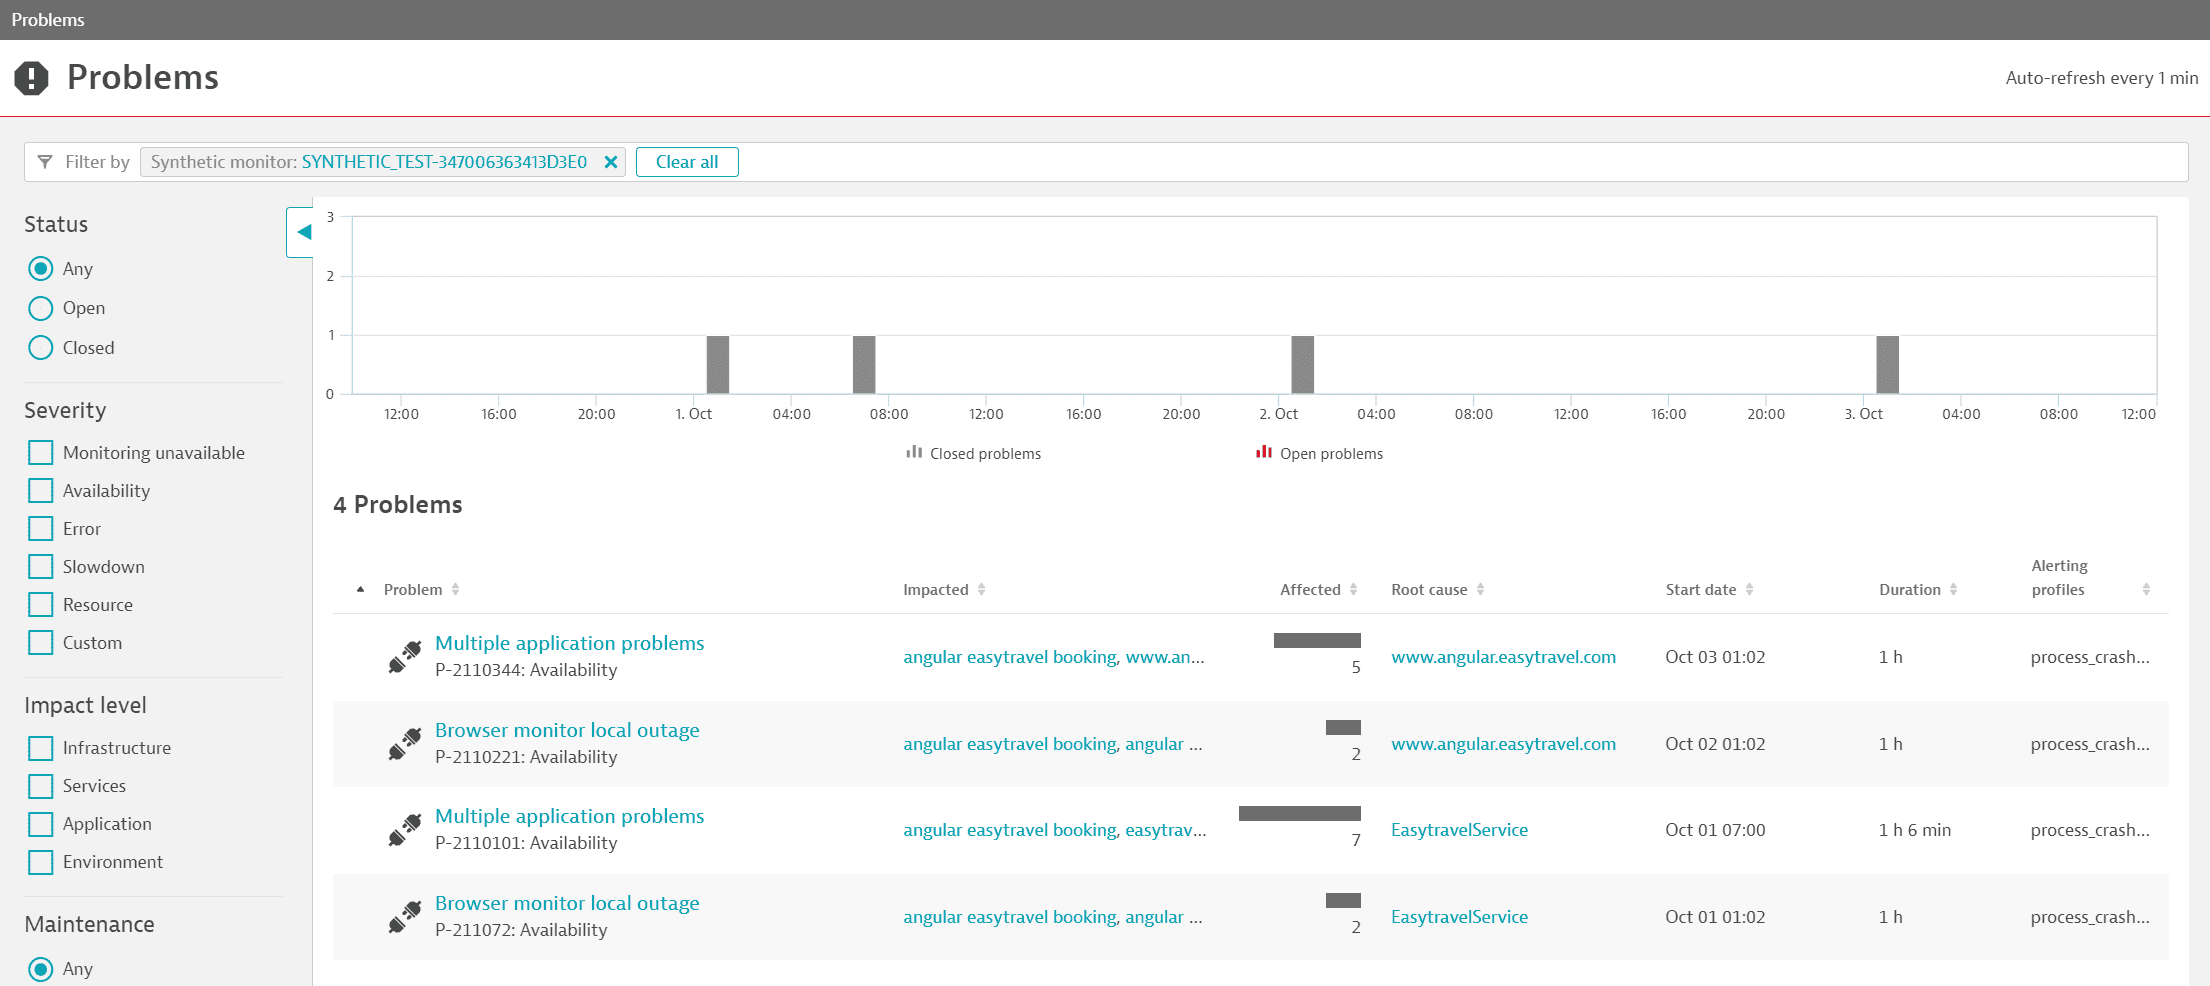
Select the More (…) button on the Problems card to view the same list of problems in the Problems page. Here you can view the frequency of open and closed problems per time slot for your selected timeframe.
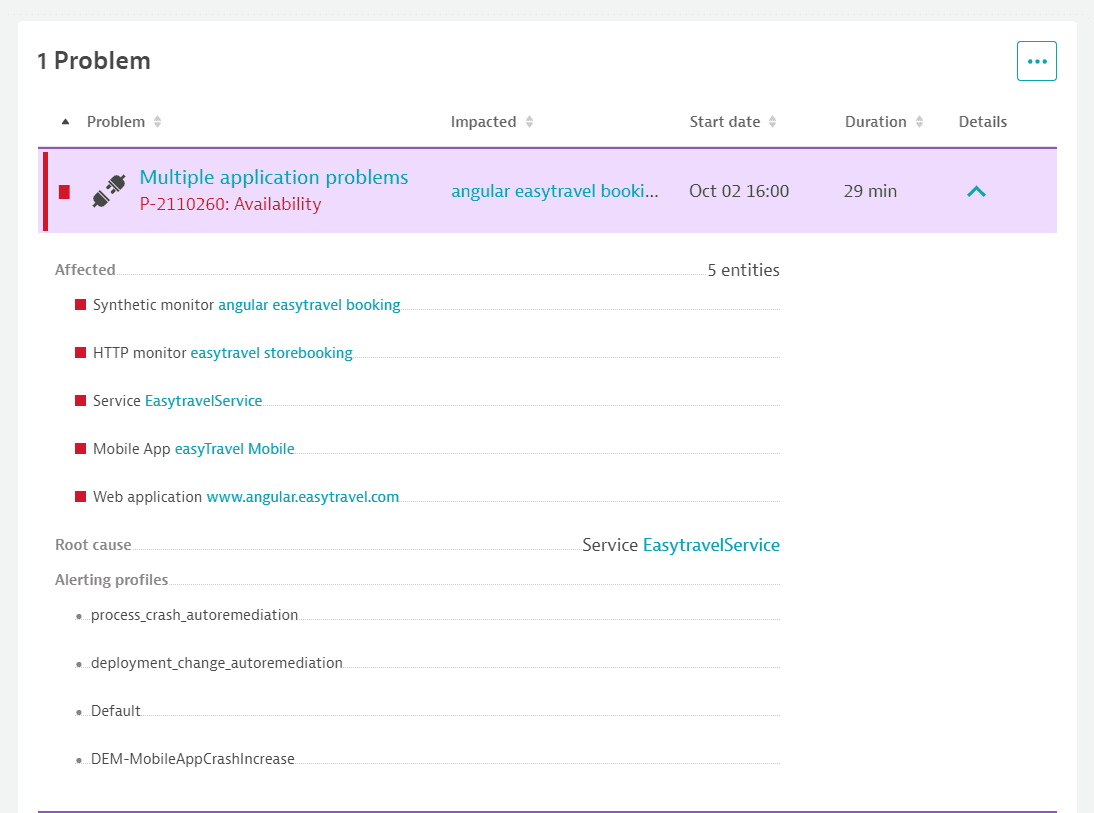
Expand problem Details to view a problem's Root cause and Alerting profiles, which are used to determine if notifications should be sent out. All Affected entities that are associated with the root cause (such as a monitored service or application) are listed.
Select a problem name (for example, Multiple applicaton problems) in the Problems card to view the problem overview page. Note that performance problems may combine threshold violations at the monitor as well as the event levels. Select the Impacted entity name (that is, the impacted synthetic monitor) to filter the details page by the problem duration.
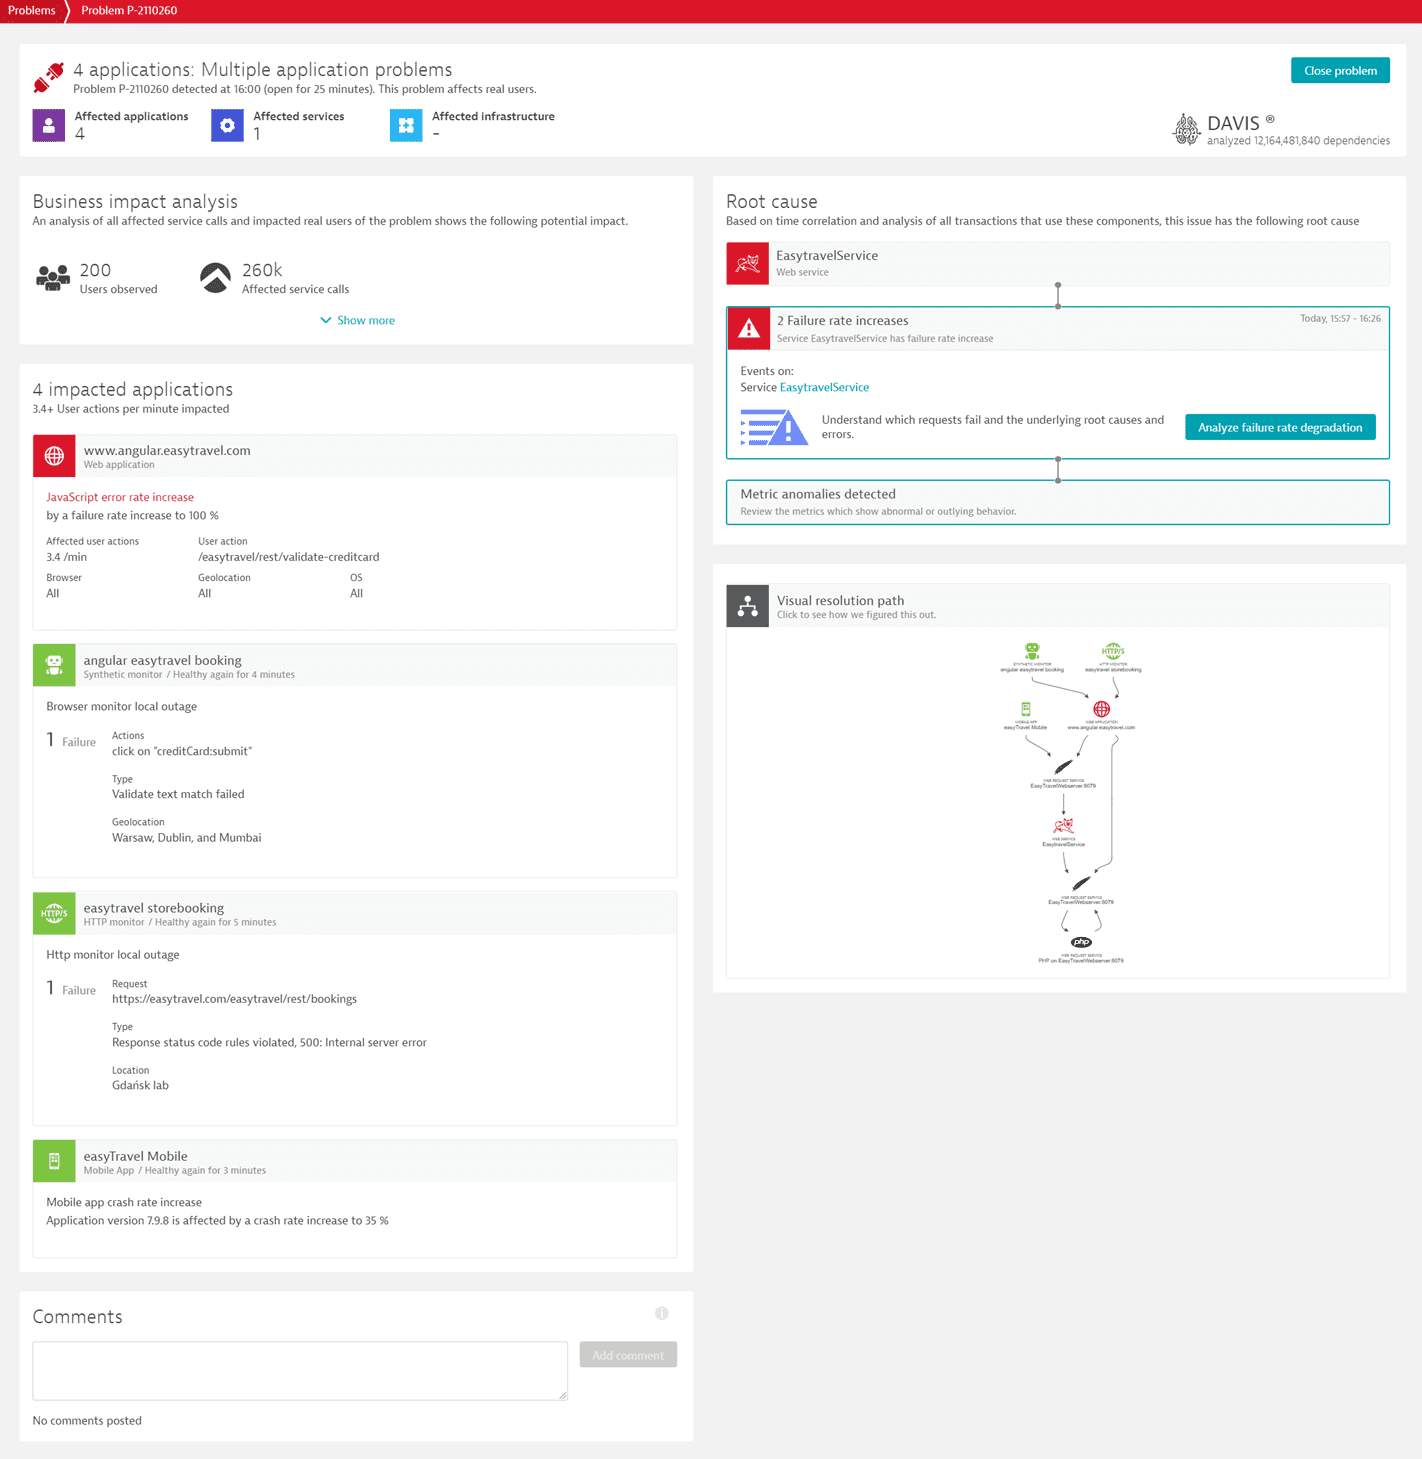
Problems, along with their constituent events and any availability errors give you a full picture of the number and scope of your monitor's issues.
Events
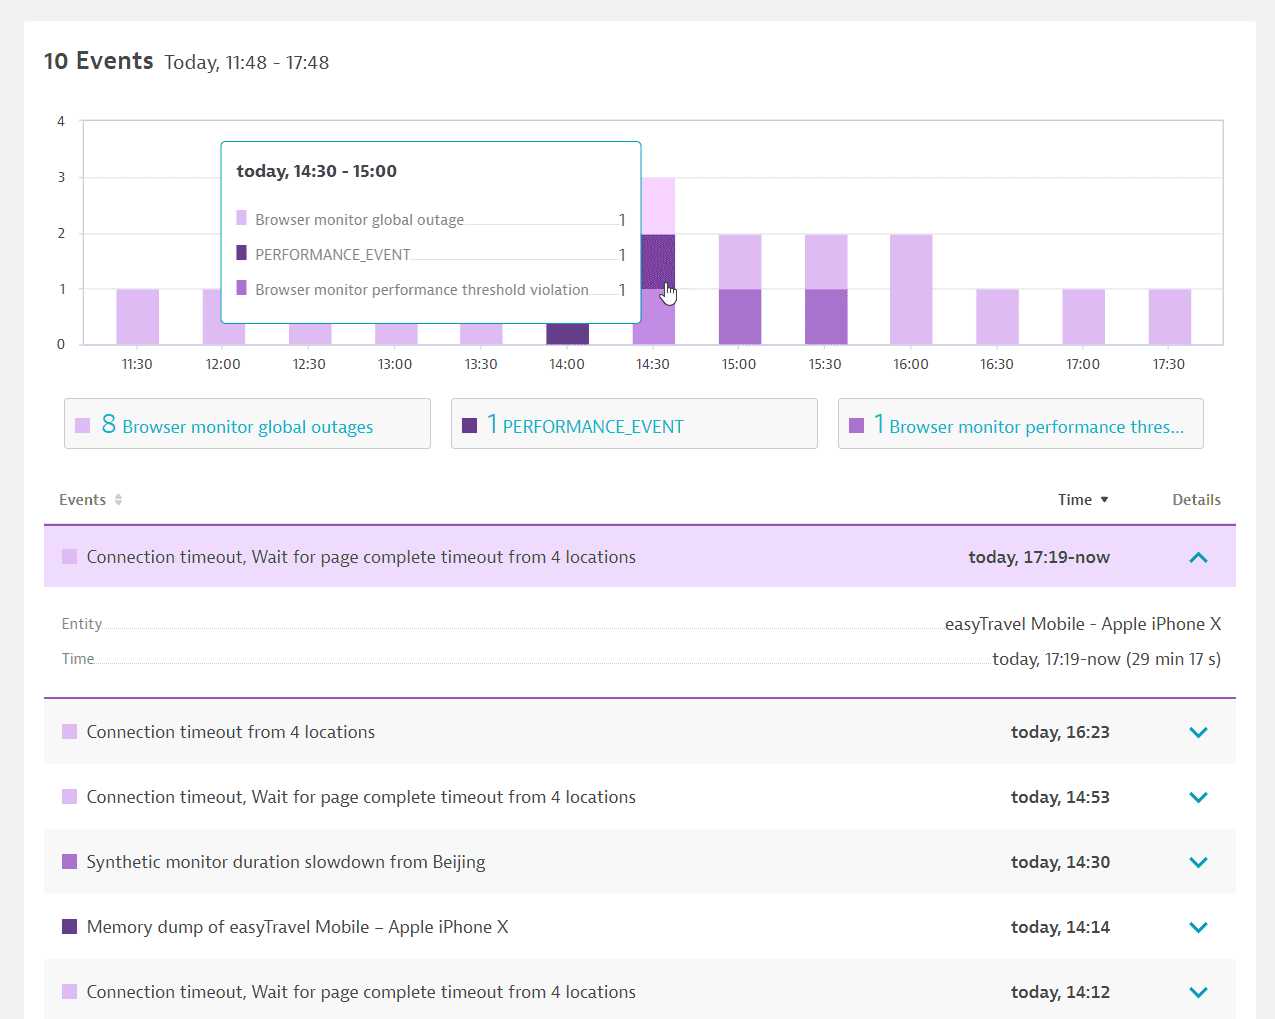
The Events card shows all events that can lead to problems. Custom events you ingest into Dynatrace also show up in this card. Events for active as well as resolved problems show up in the list and timeline.
Hover over a time slot in the event timeline to see the type and number of events generated in that interval. Select the time slot to display events within it.
Select an event type, for example, Browser monitor performance threshold violation, to see the list of events. There is always one slowdown event created per location where your monitor violates event-level or monitor-level performance thresholds. Select an individual event to see details.
Errors
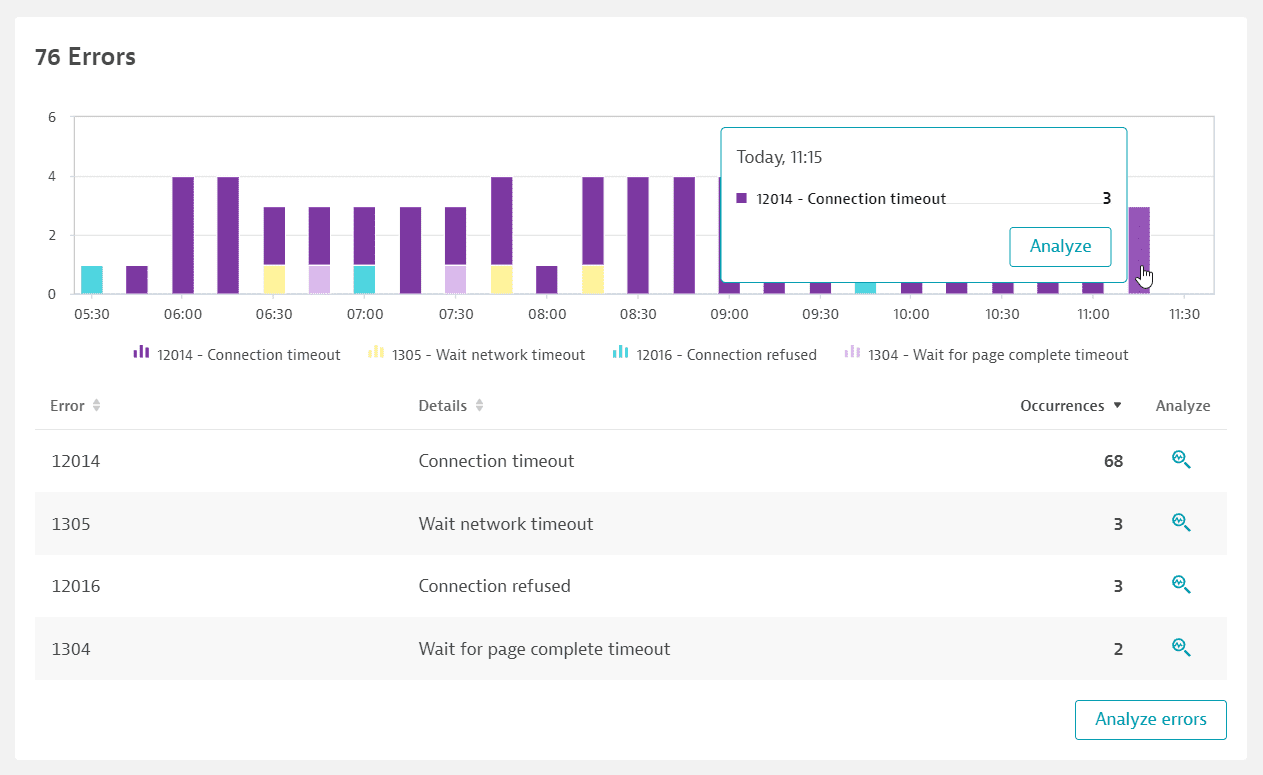
The Errors card displays the timeline of all failed executions of the monitor with the corresponding error codes, providing an easy way to quickly find the main reason for monitor failures.
A monitor failure counts towards availability outages (global or local threshold violations). You might see errors with no problems if you haven't enabled availability thresholds or if the errors don't cause a violation of your availability thresholds. A performance threshold violation does not necessarily result in an error unless the monitor also fails.
Select Analyze errors to view executions with these errors in the Multidimensional analysis page. Select Analyze next to an individual error to view Multidimensional analysis filtered by that error.
Hover over any time slot in the error timeline to see the count of errors by type during that interval. Select Analyze in the tooltip to view the Multidimensional analysis page showing that time slot.
Properties
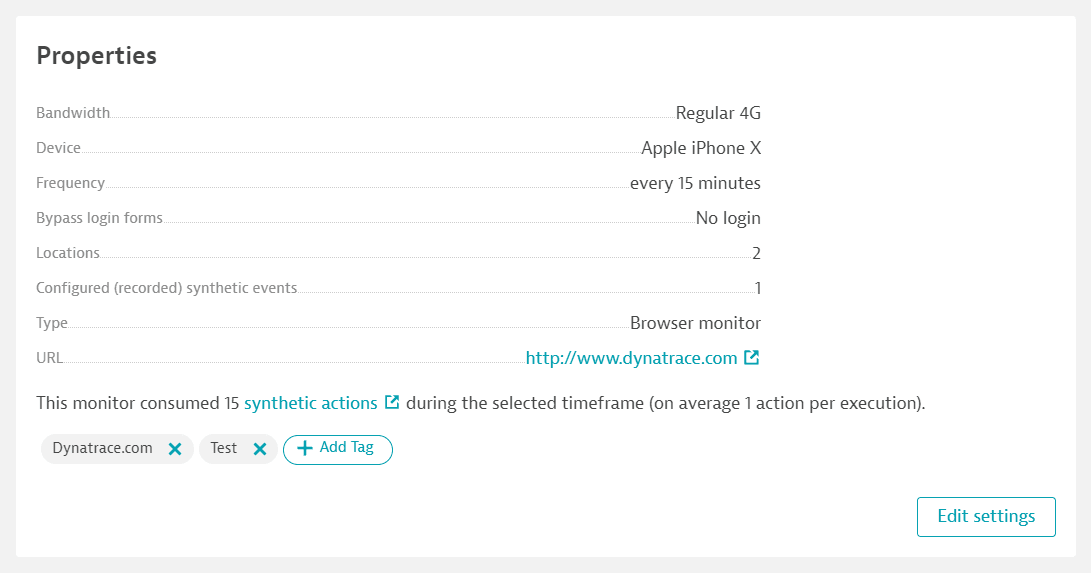
The Properties card summarizes key properties of your monitor and displays the number of events and consumption for the selected timeframe. For single-URL browser monitors, the number of events is always 1.
World map
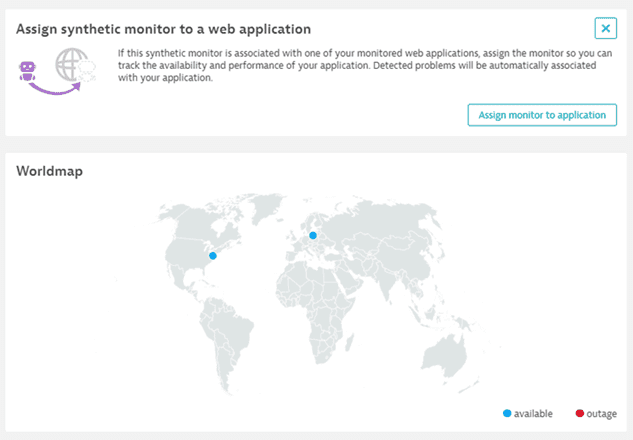
The world map shows if your monitoring locations are online or have an outage, helping you distinguish between global and local outages. Select a location on the map to see availability at that location for the timeframe and the status of the last execution (for example, Outage). Next, select Analyze executions to see the Multidimensional analysis page for availability filtered by that location.
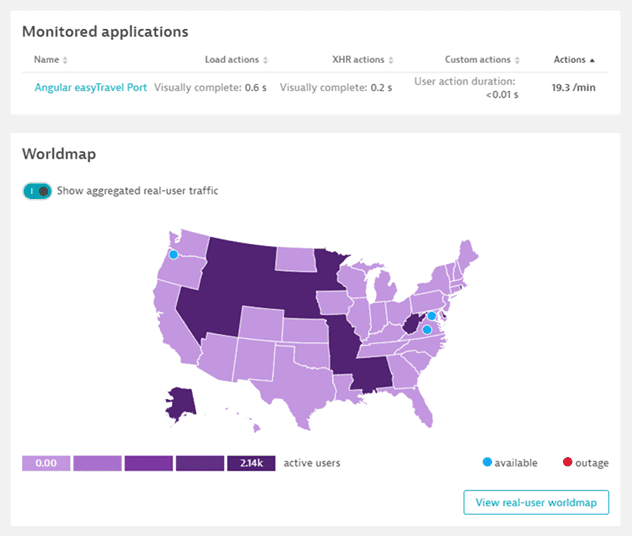
Assign monitor to application (see the first image below) takes you to monitor settings where you can associate the monitor with one of your monitored web applications. If Real User Monitoring (RUM) is enabled for the applications your synthetic monitor runs against, Dynatrace automatically links the RUM applications to the monitor, and the Monitored applications card is displayed (see the second image below). You can see the key metrics of the application and can jump directly to RUM data from here.
If a RUM application is linked to the monitor, you’ll see a toggle to augment the world map with RUM data. When there's an outage at a synthetic location, you can immediately compare the RUM traffic. The RUM data is also a good indicator of which other locations you should run your synthetic monitor from.
 Synthetic Classic