Service flow metrics
- Latest Dynatrace
- 4-min read
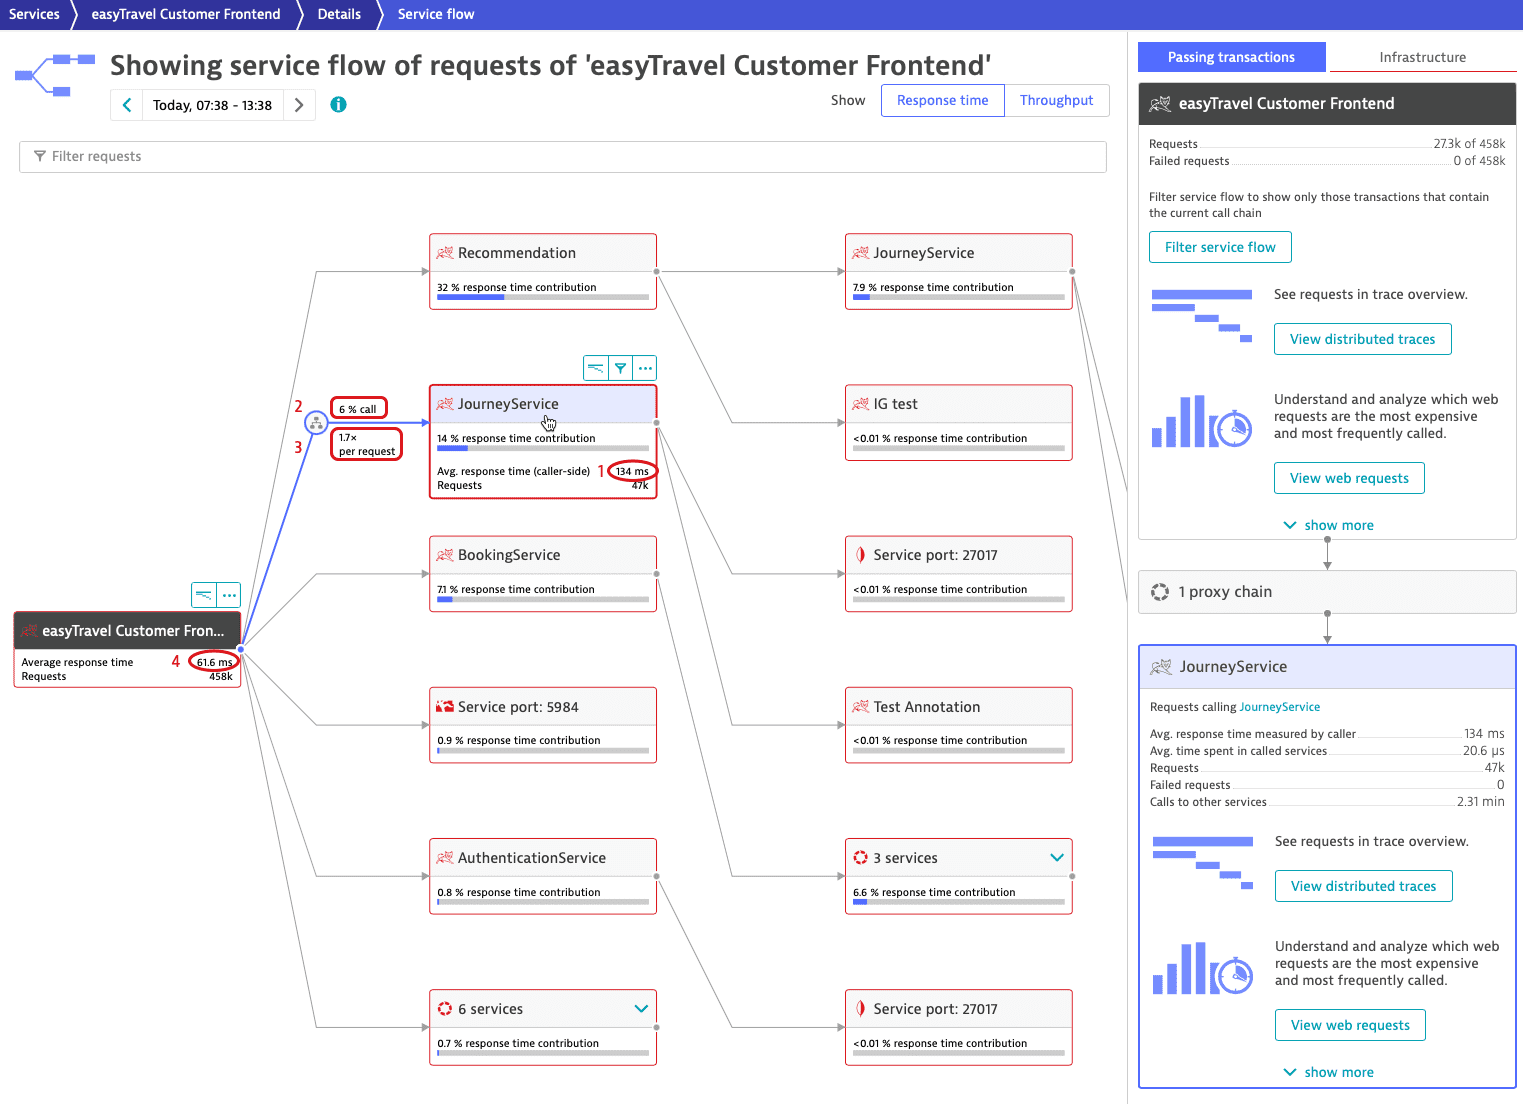
When you select a service within a service flow, the path to the service—beginning with the service that triggered the flow—is highlighted in blue (see image below). Additionally, the arrows constituting the path are enriched with metrics.

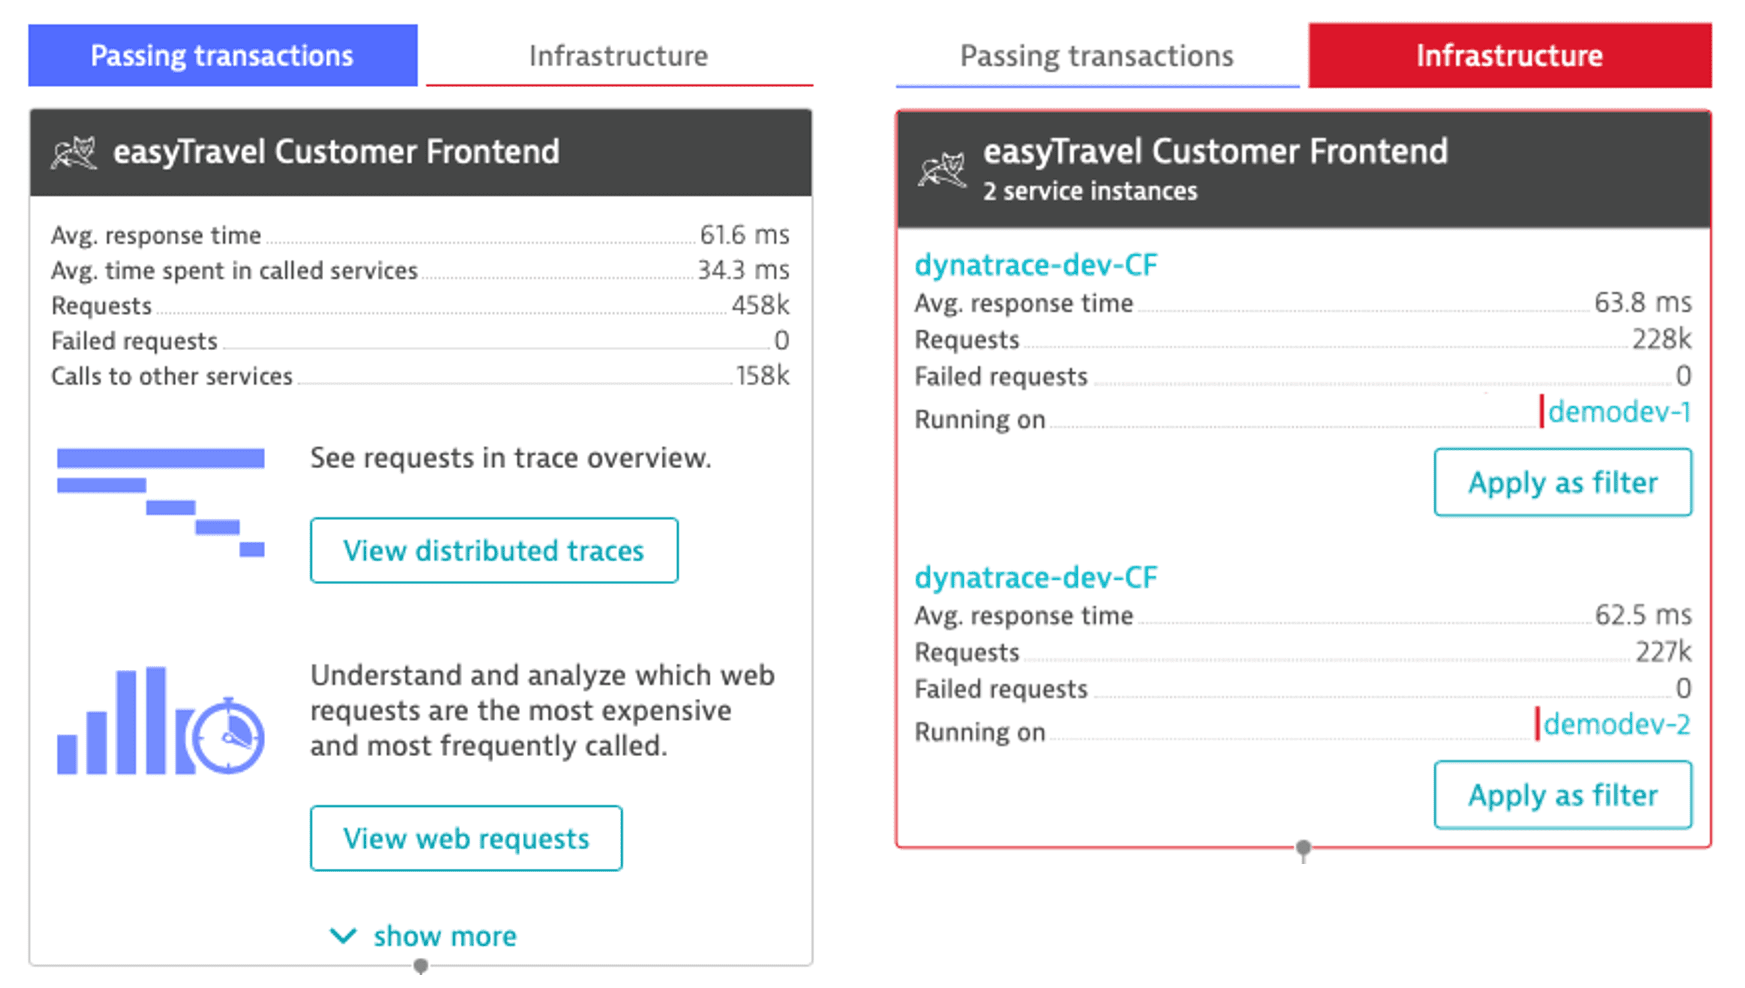
Apart from response time contribution, you can also view the Average response time and the number of Requests initiated by each service included in the service flow. Just select a service to expand it. Once selected, you can view further details like Avg. time spent in called services and the number of Failed requests (see image above, bottom right).
Each service also shows the Response time contribution, which is calculated using the following formula:

The displayed value for the response time contribution may differ from the actual mathematical result as the calculations are based on underlying data and then rounded off afterwards.
In the service flow example above these are marked as follows:
-
1—Average response time service
-
2—Call percentage
The percentage of requests calling the target service among all requests initiated by the service.
-
3—Call per request
The average number of calls to the target service that were included in each request.
-
4—Average response time overall
Let's assume that your service flow indicates these request values for your service:
- Average response time =
134ms - Call percentage =
6% - Calls per request =
1.7
so:
- Response time contribution = (Average response time) × (Call percentage) × (Calls per request)
- Response time contribution =
134×0.06×1.7
In this case, the response time contribution = 14%
If you select Filter service flow on the service, the view will filter down to show only the requests that call that service. The call percentage will then rise to 100%. This set of requests is a subset of what you examine and, because it contributes to every request in that new view, the contribution will be higher.
Request details in the Service flow side pane
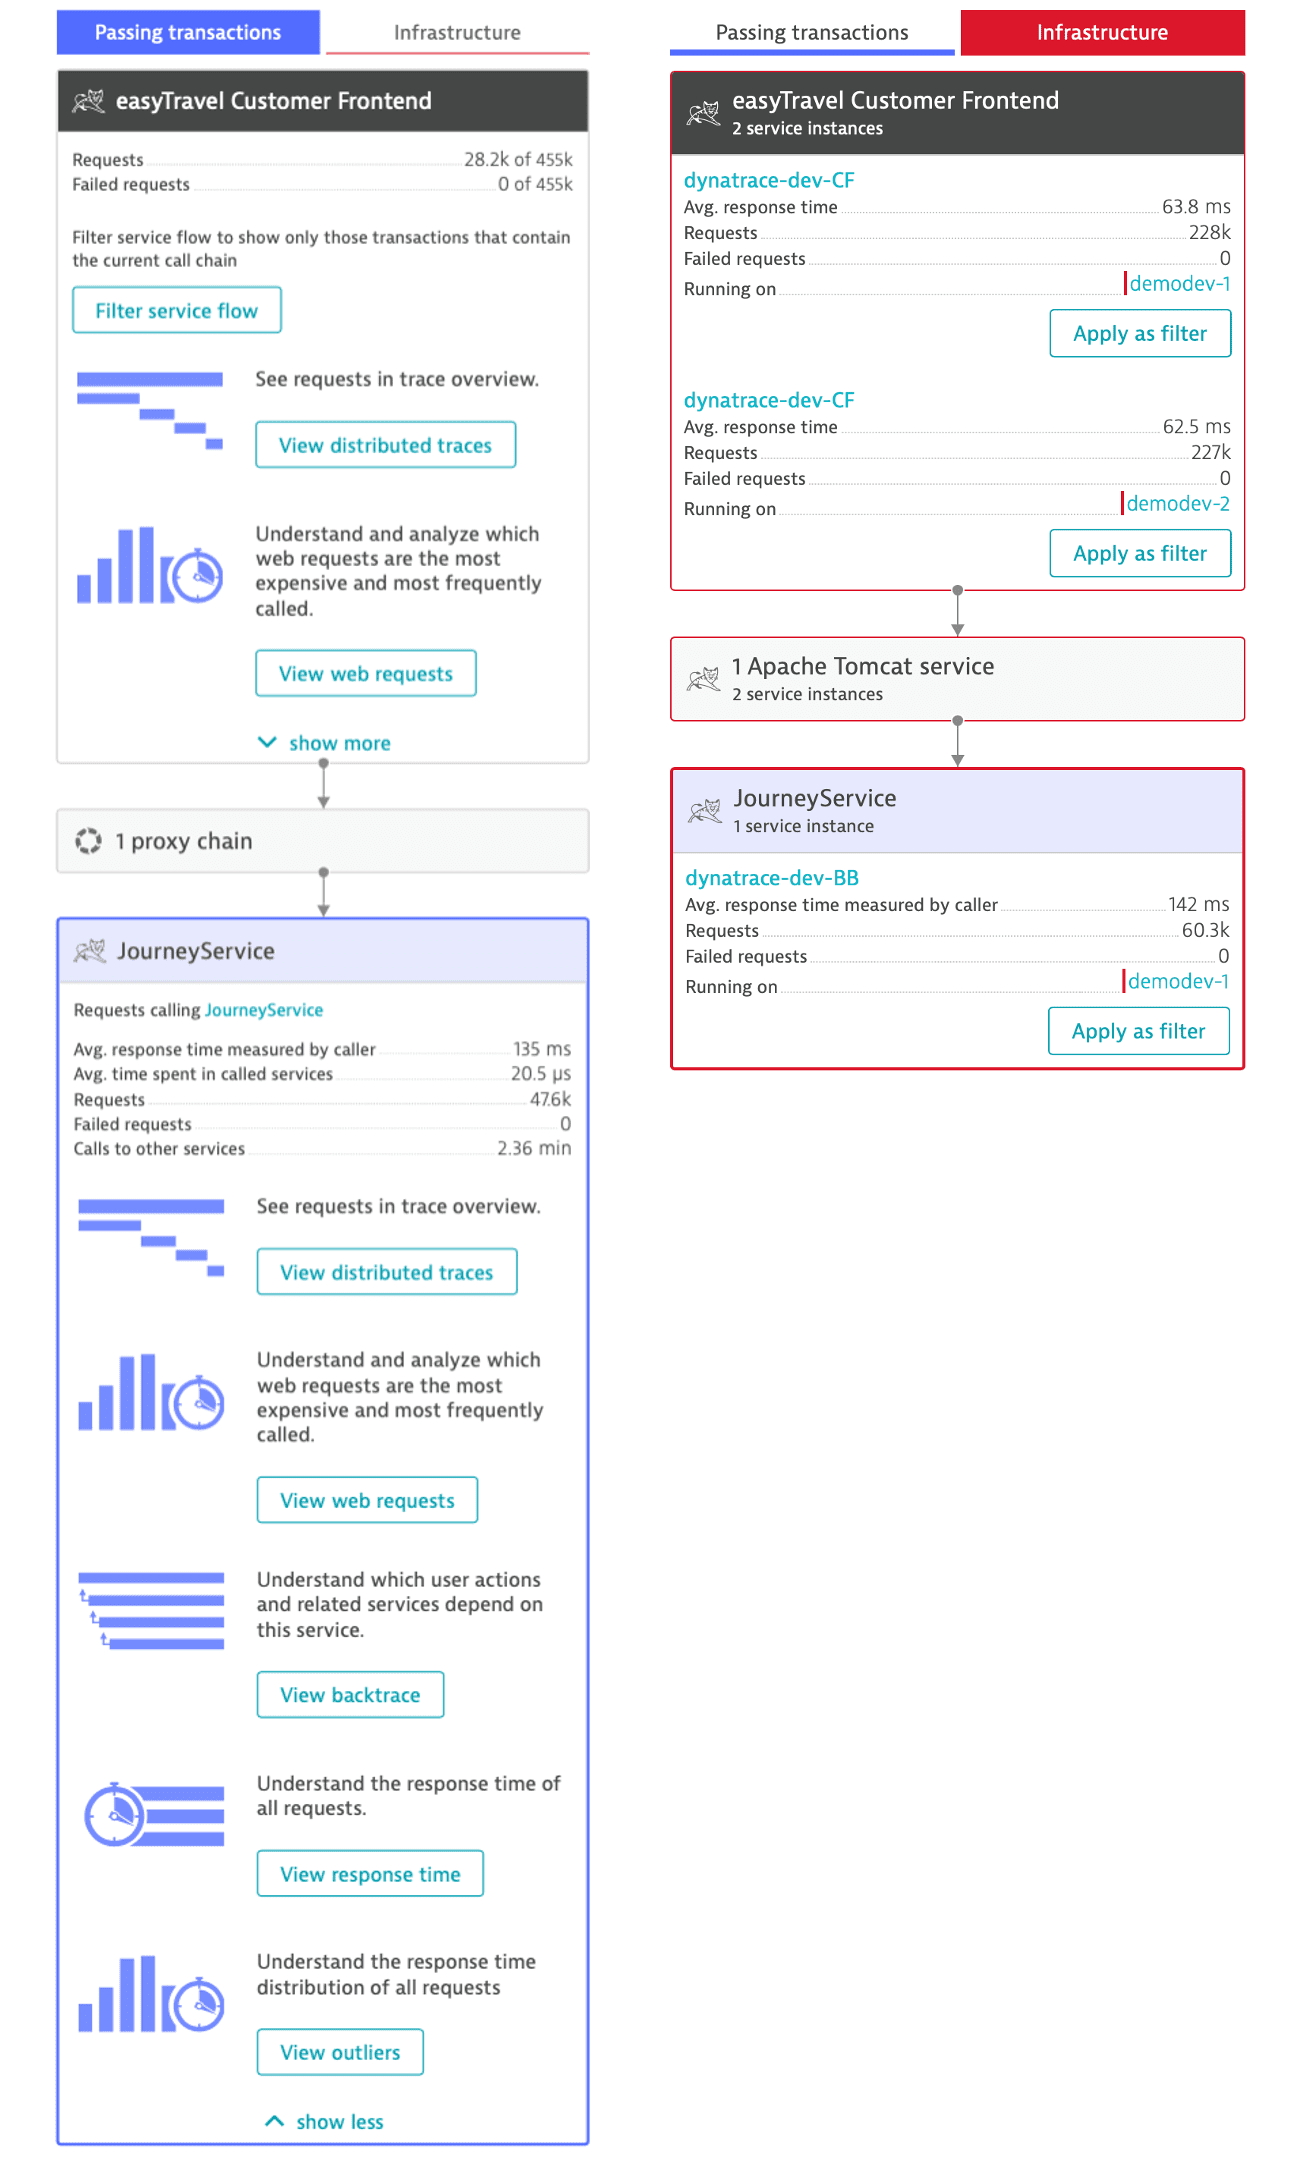
The right side of the Service flow page hosts a pane dedicated to the details of the service requests that triggered the service flow (easyTravel Customer Frontend in the image below), which includes:
- The Passing transactions tab.
This tab shows the throughput of the service and its performance—response time, number of requests, and more. Select Show more to view additional analysis options. The analysis includes all the requests originating from the service. - The Infrastructure tab.
This tab shows thateasyTravel Customer Frontendruns on two hosts and how the throughput is distributed between them. Select Apply as filter to filter the service flow—only calls originating from the selected host are shown.

When you select a service within the service flow, a bottom tile hosts the details of the selected service (at the image below it's easyTravel-Business).
-
The top tile then shows details in the context of the selected service.
The number of calls that originate fromeasyTravel Customer Frontendand subsequently calleasyTravel-Businessis 8,490 out of 127,000. Select Filter service flow to show only calls originating fromeasyTravel Customer Frontendand subsequently hittingeasyTravel-Business. Additional analysis options also focus on these calls. -
In between tiles, you can see the list of all intermediate services and/or proxies between
easyTravel Customer FrontendandeasyTravel-Business. You can expand each section and view its details, by selecting it. -
The new tile at the bottom shows details of calls to
easyTravel-Businessthat originated fromeasyTravel Customer Frontend. Additional analysis options also focus on these calls.

Service-specific analysis options
Depending on the type of service, the bottom tile of the side pane adapts to offer you quick access to specific analysis options.
-
Remote environments
For requests to connected environments, you can go to the Remote environments page in the respective remote environment by selecting Open environment. -
Databases
For requests from databases, select View database statements to leverage the top database statements analysis.
Additional analysis options
- Distributed traces
Analyze the detailed method-level chain of calls. - Analyze backtrace
Explore the sequence of service calls that led up to the specific service request. - View response time
View how the response time is distributed along different functions of the service (for example, database usage, code execution, etc.) - Analyze outliers
View the response time distribution of requests to the service within a specific timeframe.
You can specify additional filtering options to narrow down the scope of the analysis. See Service flow filtering to learn how. All these filters will also be applied to further analysis.