Analyze queues
- How-to guide
- 5-min read
Use Dynatrace to gain full visibility into producer and consumer services that are connected to queues and topics, and to simplify troubleshooting efforts in asynchronous communication flows.
To analyze queues and topics
-
Go to Message Queues.
The Queues and topics table provides an overview of all queues and topics detected as part of distributed traces, including their technology and the corresponding numbers of incoming and outgoing messages.
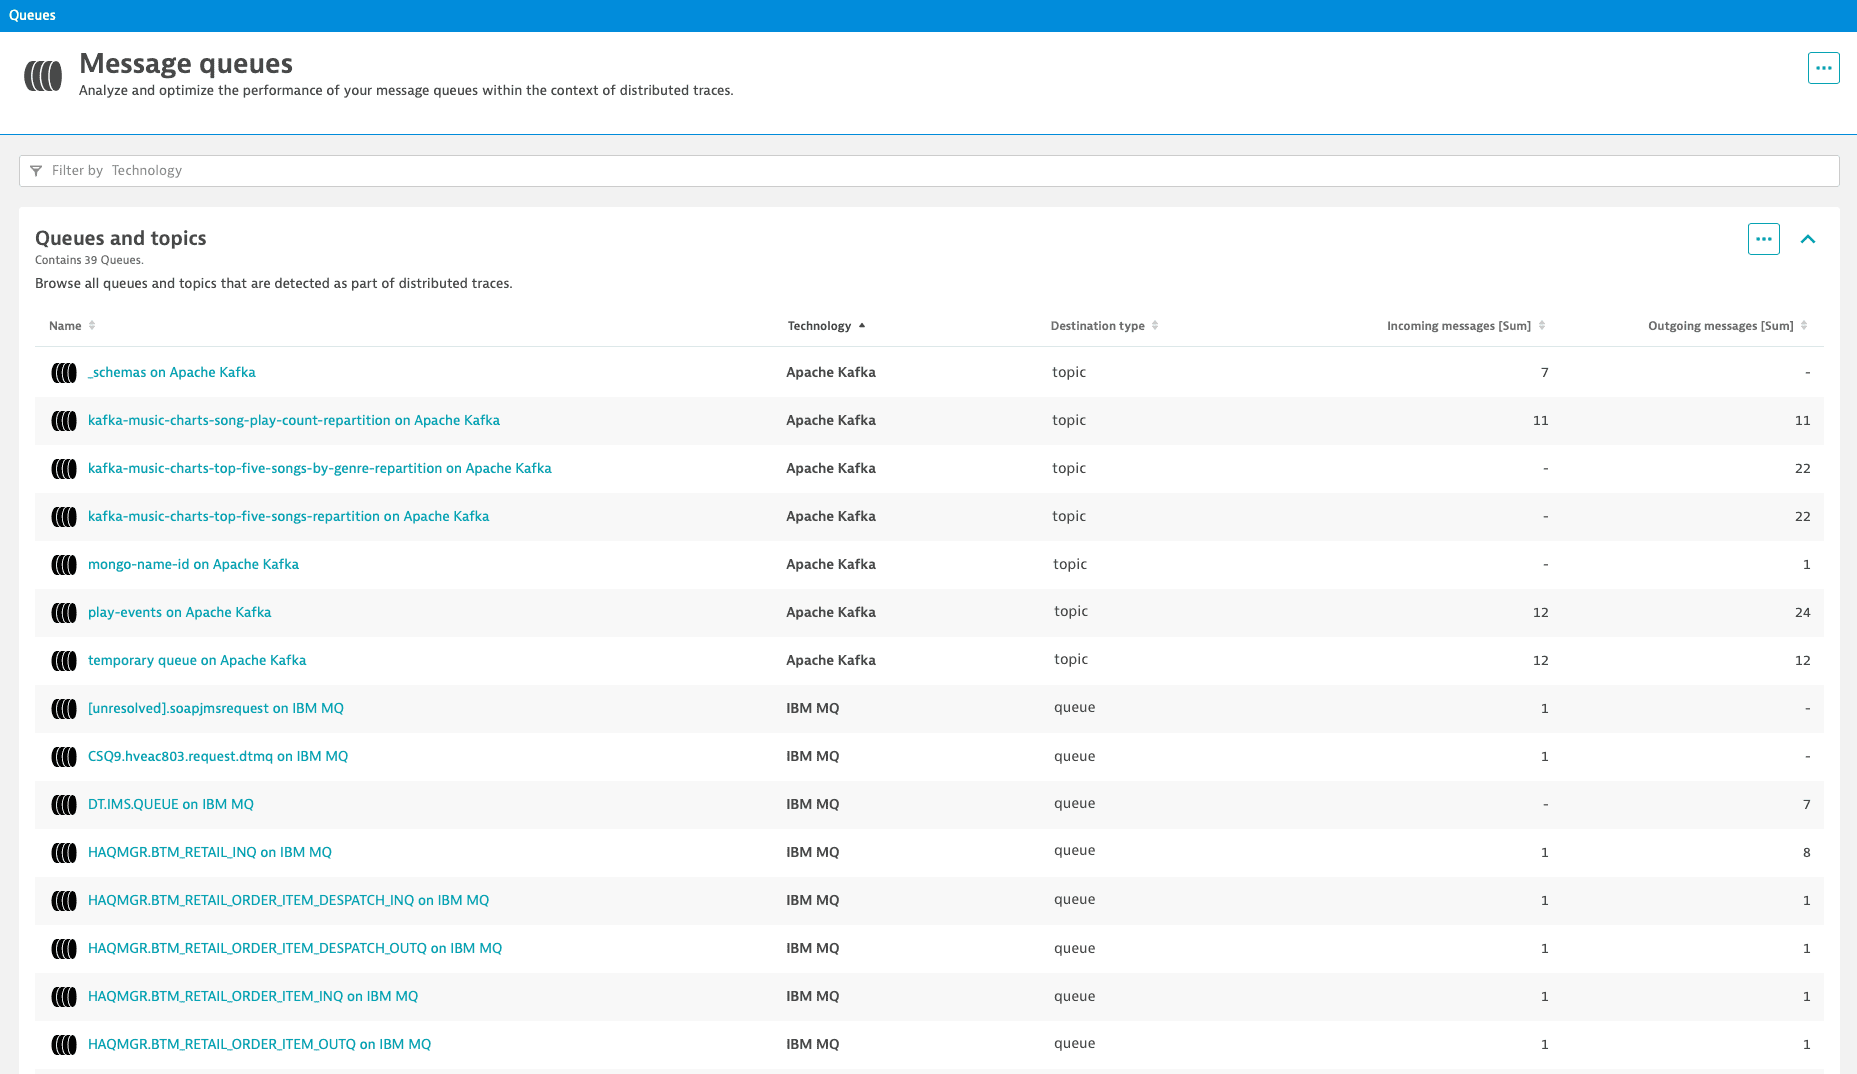
By monitoring the incoming and outgoing messages, you can identify unbalanced message processing. Causes of unbalanced message processing include:
- Producer services sending more messages to the queue than consumer services can process.
- Some consumer services exhibiting availability issues or response-time degradation.
To prevent severe problems caused by an unbalanced message processing (for example, a queue overflow), you can scale queues quickly or maintain failover processes.
Message countsThe number of incoming and outgoing messages per queue or topic is calculated based on the data provided by monitored producer and consumer services. If a producer or consumer service isn't monitored, the number of messages per queue or per topic reported in Dynatrace might be lower than the actual number of processed messages.
-
Select the Name of a queue or topic from the table to access its analytics view with additional details related to anomalies.
In each analytics view, you'll find information about anomalies detected by Davis® AI. It also displays the message throughput per queue or topic, along with the connected producer and consumer services. Events highlight any availability changes of your message queue, while logs can reveal internal problems.
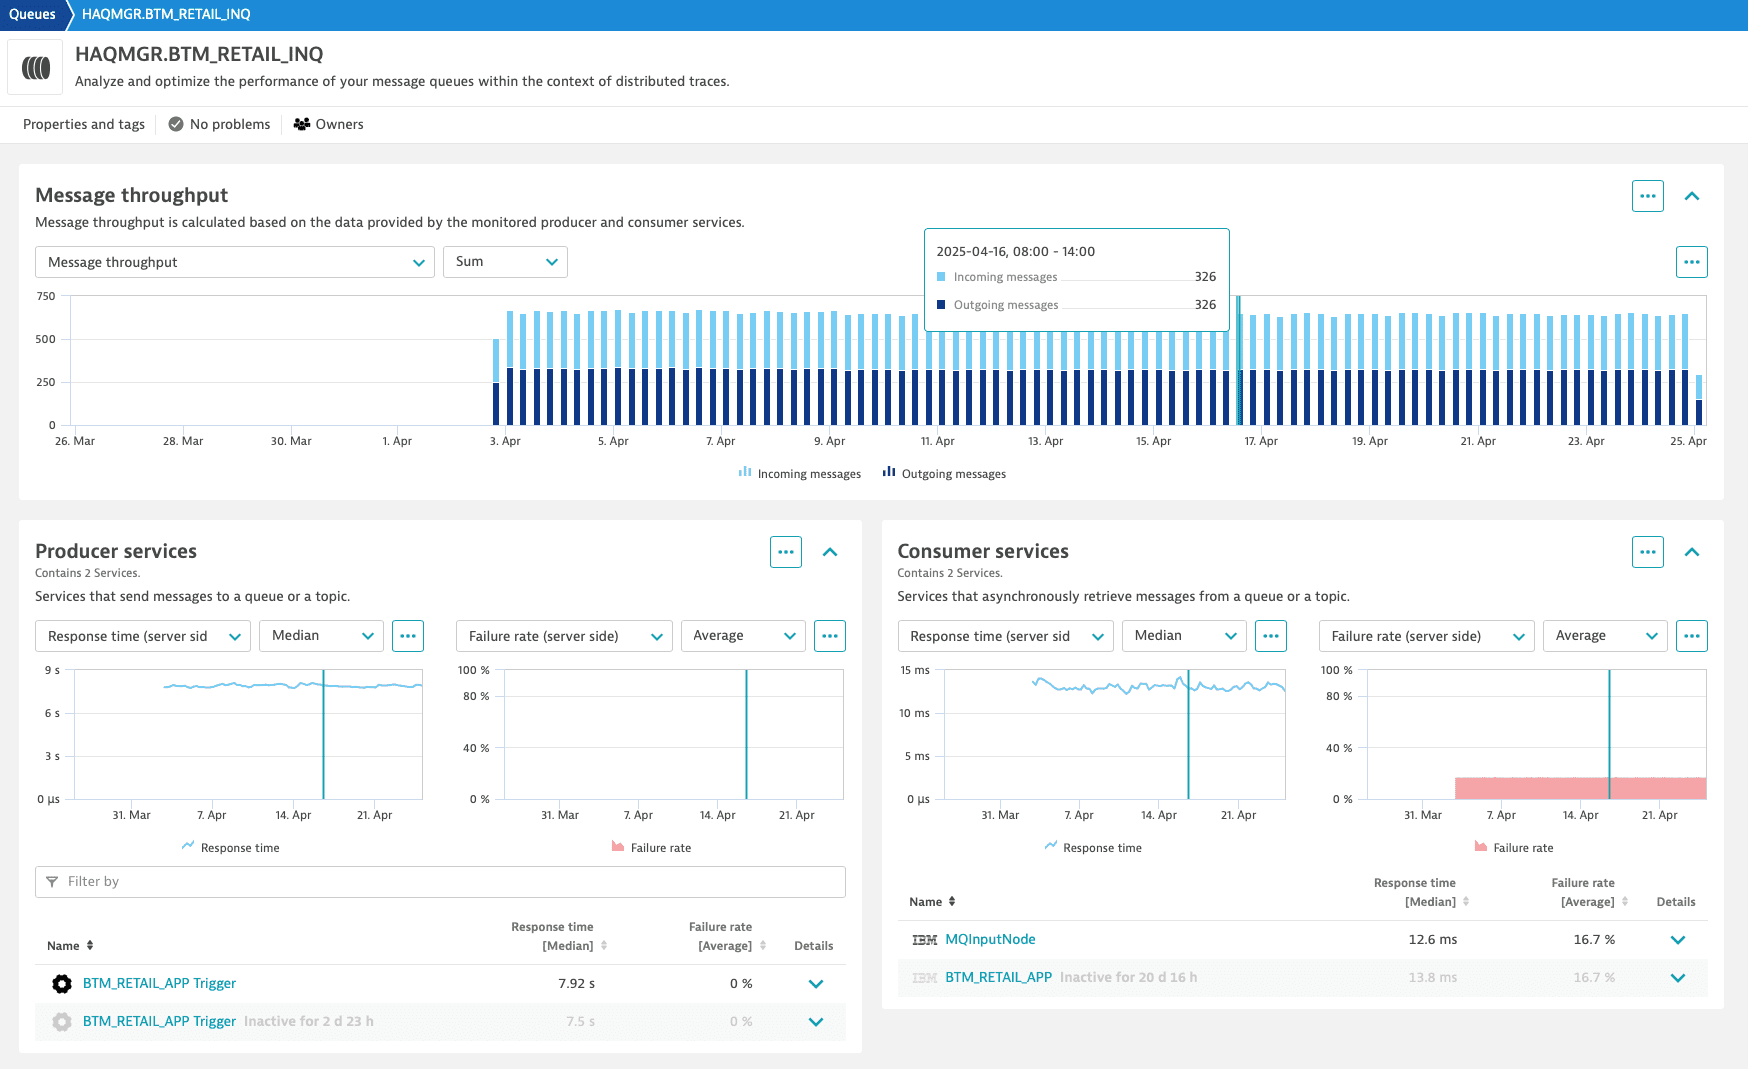
Different service metrics—such as response time, failure rate, throughput, and CPU consumption—allow you to draw detailed conclusions about the root cause of asynchronous service-to-service communication anomalies. You can switch quickly between the available metrics, apply different aggregation functions, or define metric-specific alerts.
To define an alert for a metric, select Set alert from the More (…) menu in the upper-right corner of the chart.
To view details at the service and code levels, select a specific service from the producer or consumer list.
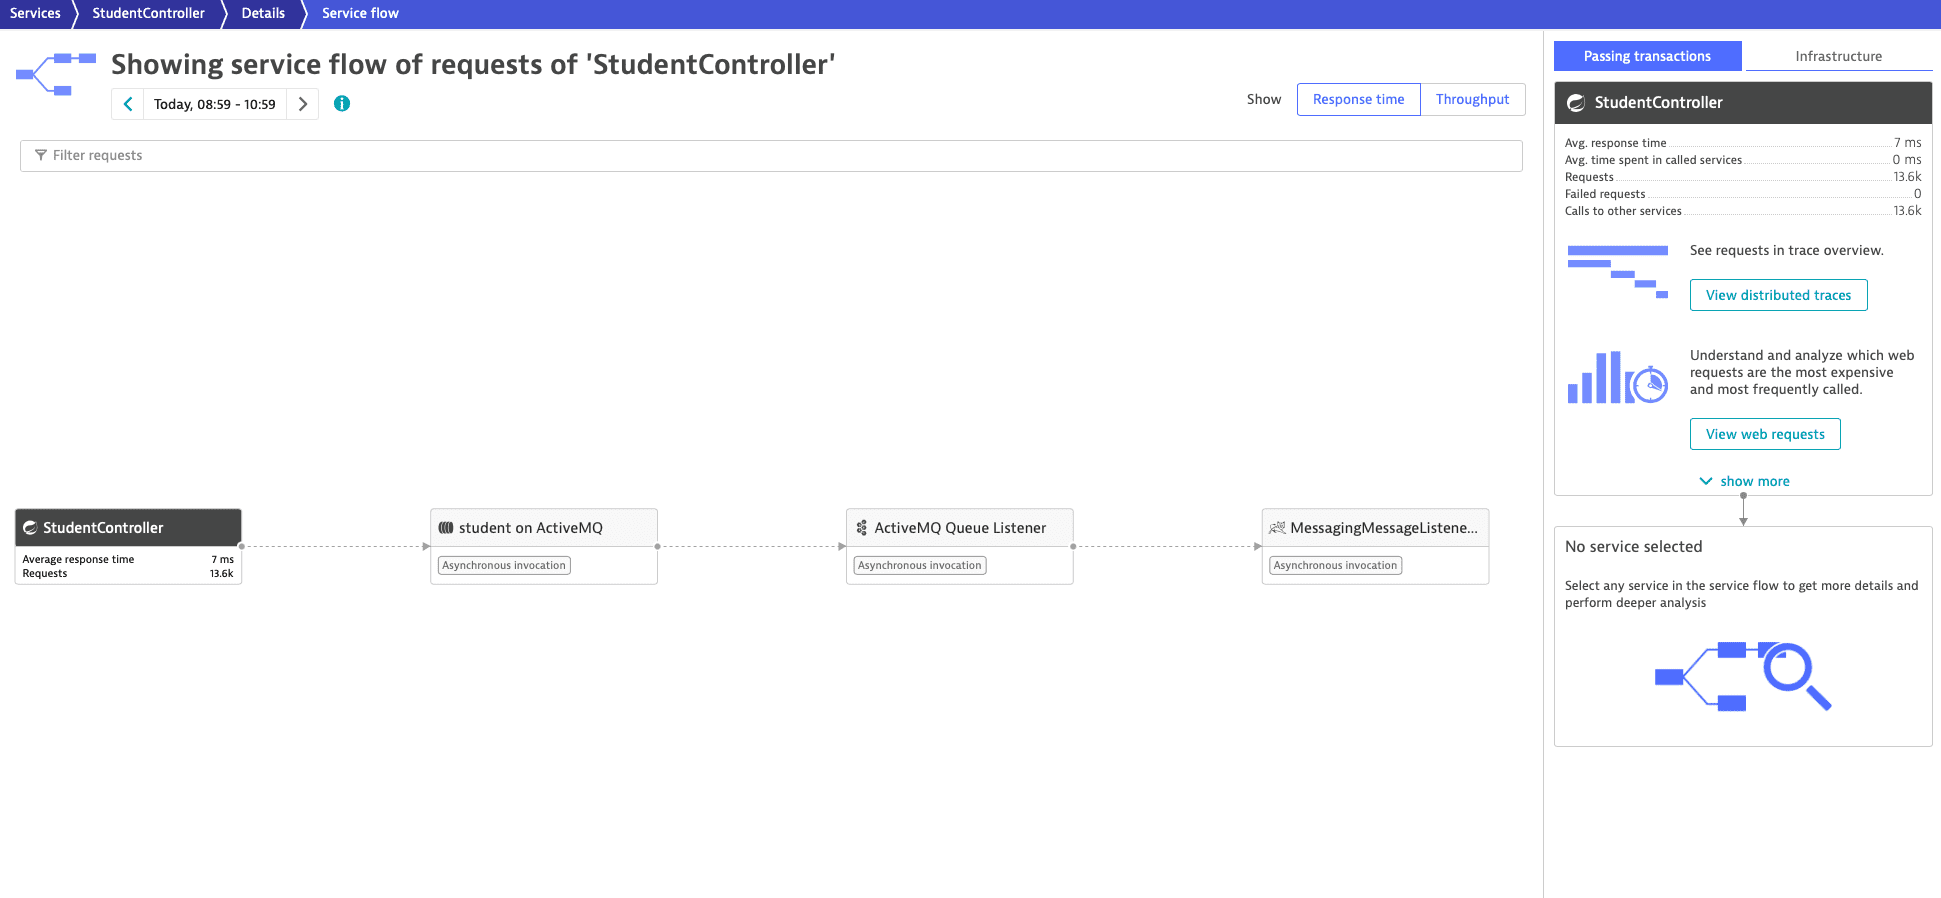
Example: Service flow
This example shows a service flow with a producer service, queue entity, listener service, and consumer service.
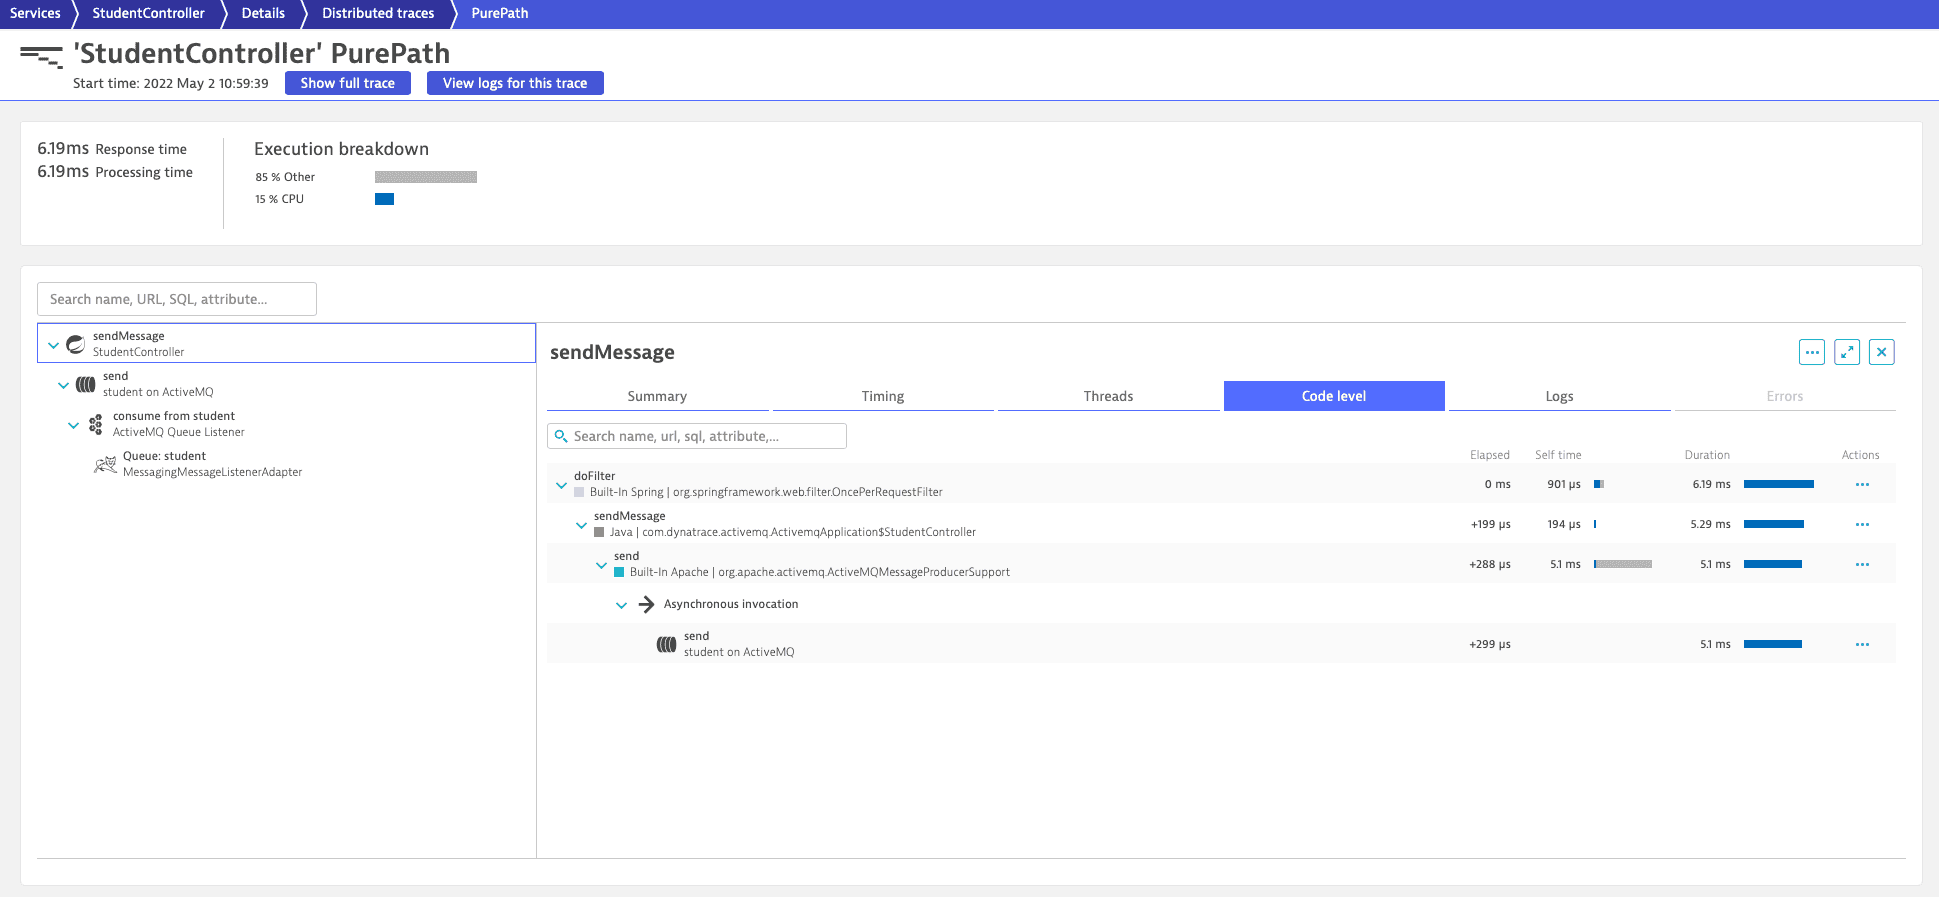
Example: Distributed trace
In this example, you see a distributed trace with a producer service, queue entity, listener service, and consumer service.
Davis® AI for queues
Dynatrace version 1.243+ Davis® AI considers queues and topics during its fault domain isolation, and applies its anomaly detection to producer and consumer services.
Automatic fault domain isolation
While monitoring individual queues or topics with custom alerts works for specific use cases, enterprise environments with hundreds or thousands of different queues and topics must rely on automatic fault domain isolation to quickly determine the root-cause of a problem.
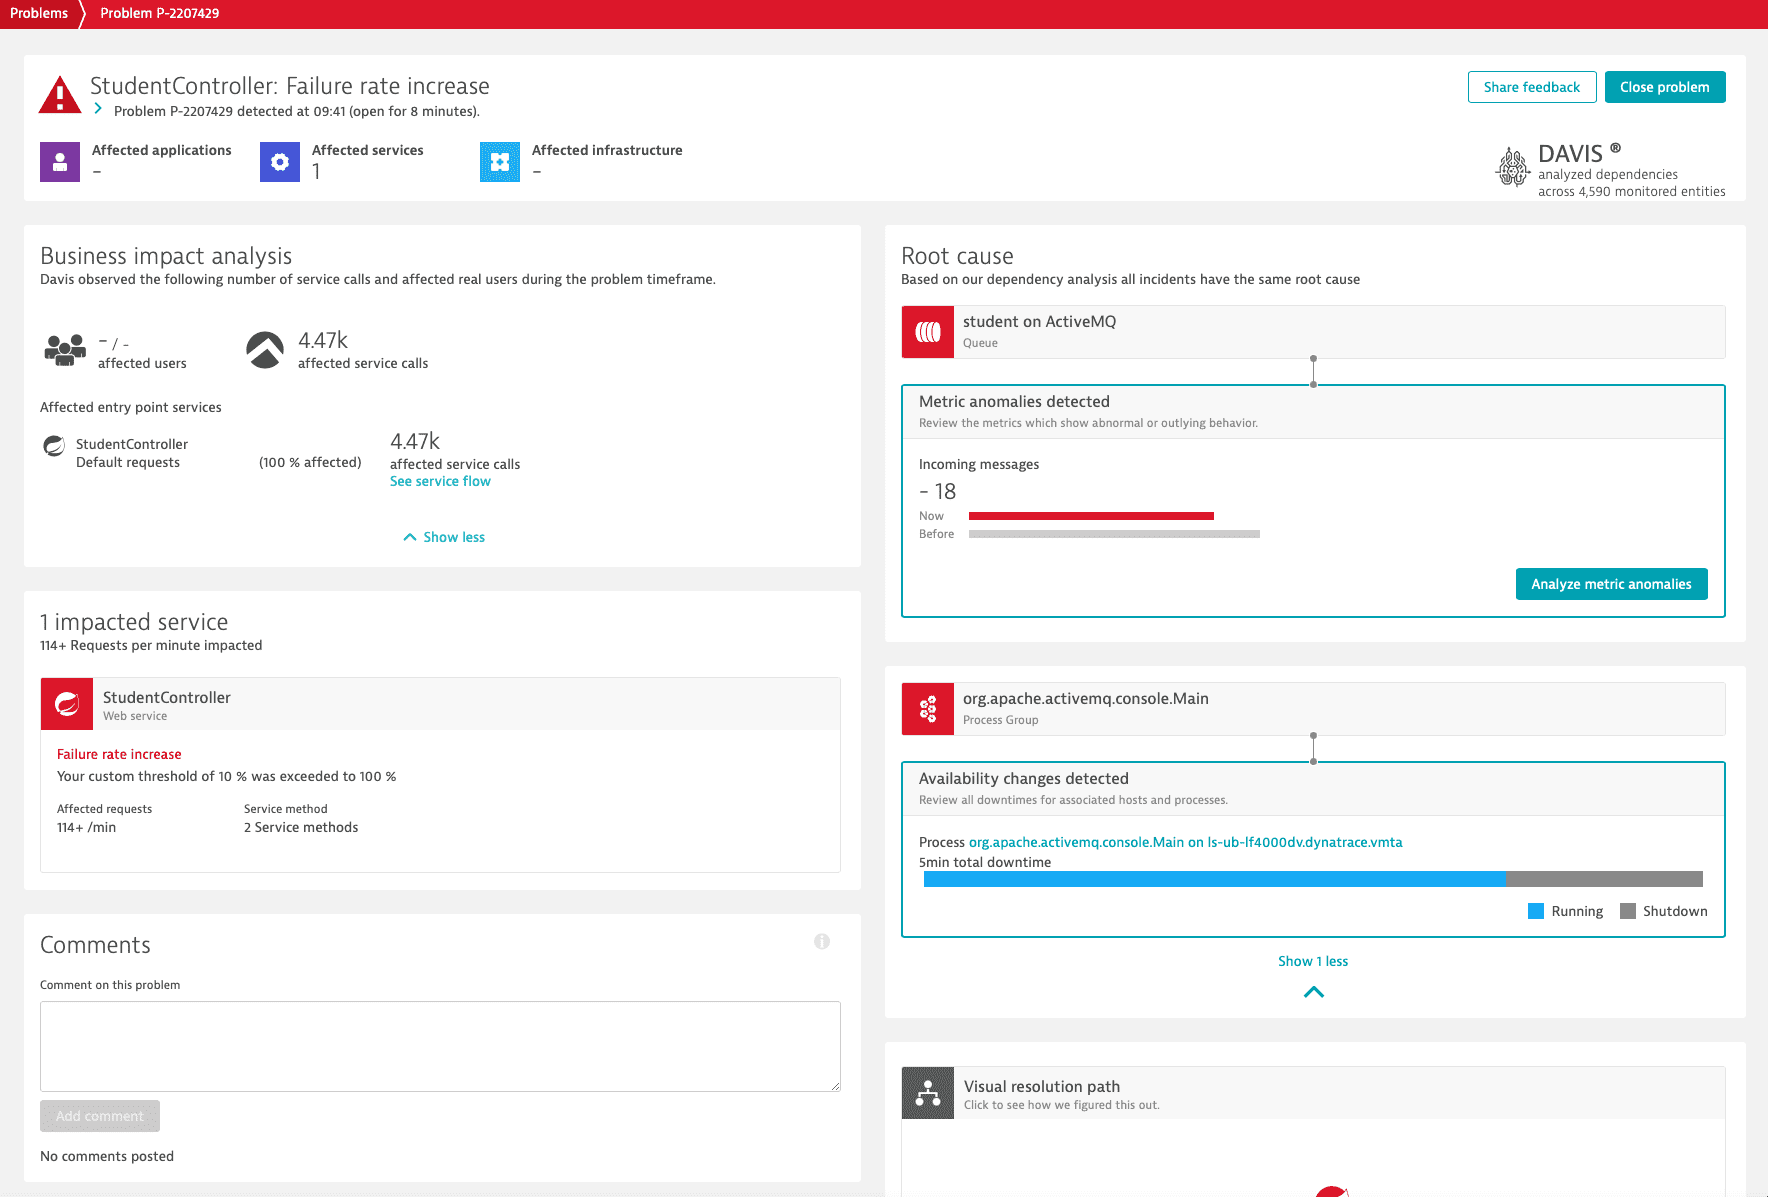
Davis® AI baselines all incoming and outgoing messages and checks all queue-related events of the underlying infrastructure. In case of detected problems, the respective queues or topics are immediately flagged, and a problem card is opened.
Automatic anomaly detection
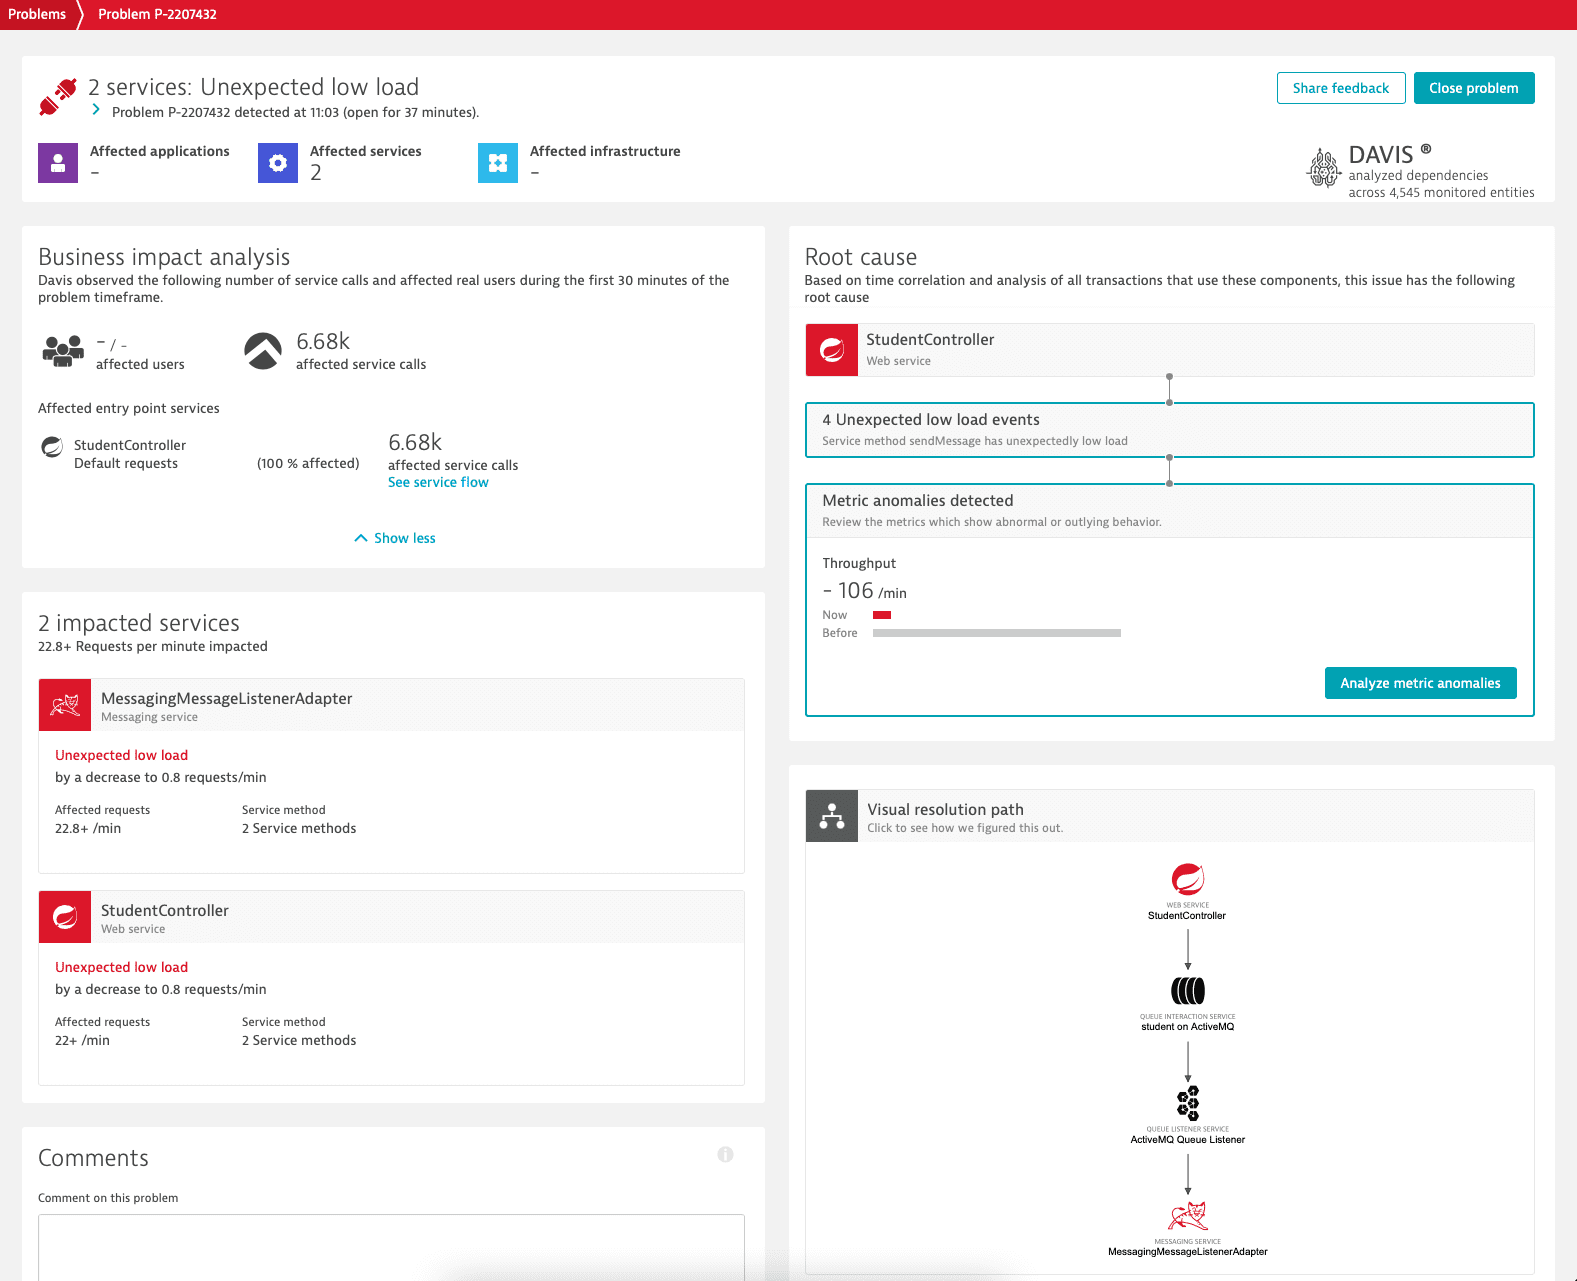
Decoupled service-to-service communications are challenging to troubleshoot due to their asynchronous behavior, especially during load drops or load spikes. Example causes for unexpected load scenarios include:
- When the producer service can't send messages to a queue, resulting in an Unexpected low load on the consumer service.
- When the producer service sends more messages to a queue, resulting in an Unexpected high load on the consumer service.
Davis® AI anomaly detection can automatically detect unexpected load scenarios of asynchronous services.
To automatically detect load drops or load spikes
- Go to Settings > Anomaly detection > Services.
- Find Service load drops and/or Service load spikes, turn on the dedicated switch and specify the observed load threshold.
 Message Queues