Queue concepts
- Dynatrace Classic
- Explanation
- 4-min read
Message queues provide lightweight storage for messages. They're typically implemented with a client-server architecture. In such an architecture, applications connect to queues or topics via messaging clients, while the queues and topics themselves are operated by the messaging server (for example, by a queue manager or a broker).
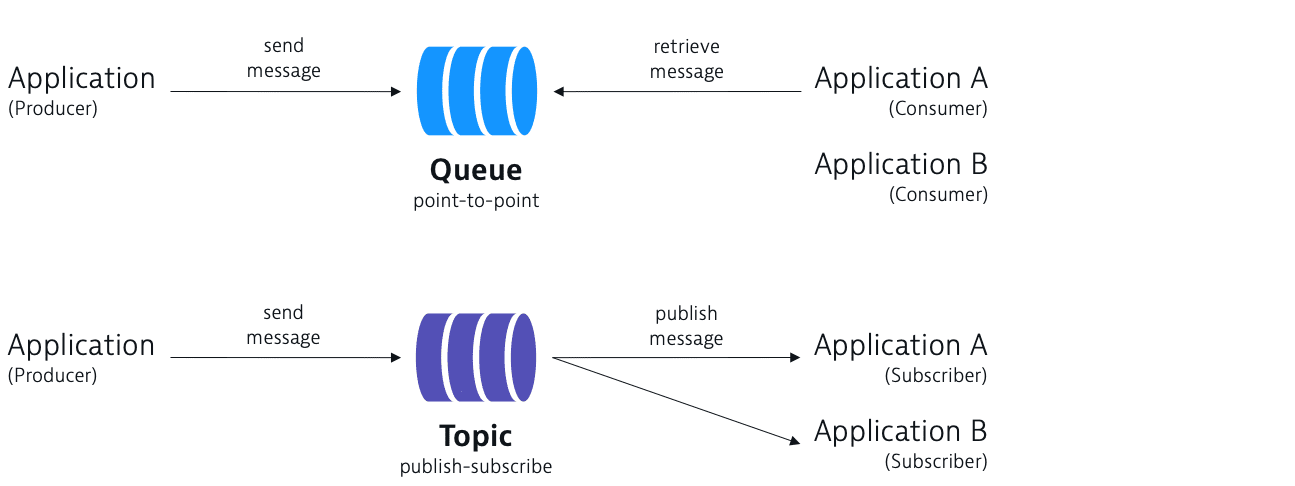
Message queues take the form of either a queue or a topic. They offer endpoints that allow applications to send messages to them and endpoints that allow applications to retrieve messages from them asynchronously or to subscribe to topics.
- Queue: A single message is retrieved by exactly one consumer even when more consumers are connected to the queue (point-to-point model).
- Topics: A single message is published to all subscribers of the topic (publish-subscribe model).

Prerequisites
OneAgent must run in Full-Stack Monitoring mode to detect queues and topics as part of distributed traces. Only in Full-Stack Monitoring mode does Dynatrace create a continuous service flow across connected producer and consumer services.
Queue entity types: queues and topics
OneAgent automatically detects queues and topics when monitored applications interact with them by instrumenting compatible messaging clients. When queues and topics aren't used by applications, OneAgent can't access them even if they're available on the messaging server. To check the compatible clients, see Technology support.
Dynatrace creates Queue entities for all detected queues and topics that are part of distributed traces. These entities are shown in the Queues and topics table on the Queues page.
| Entity | Type | Naming schema |
|---|---|---|
Queue | Queue |
|
Queue | Topic |
|
Queue | IBM MQ queue |
|
Queue | IBM MQ topic |
|
Dynatrace extensions can detect queues and topics that are available on the messaging server, but they don't result in Queue entities in Dynatrace. Hence, they aren't visible in the Queues and topics table. Dynatrace extensions can only add technology-specific metrics to entities created by OneAgent.
Messaging services
Producer and consumer services
- A producer service represents an application that sends messages to a queue or a topic via a messaging client.
- A consumer service represents
- In a JMS-based application (Java message service), there can be also a synchronous consumer service. In this scenario, a client can request the next message from a
MessageConsumersynchronously by using one of its receive methods (for example, the client can poll or wait for the next message).
To provide you with a continuous view of service flows, Dynatrace uses the following identifiers to trace messages across queues and topics
| Identifier | Type |
|---|---|
| HTTP request header |
| Custom HTTP header |
| Custom message property |
Unique key (generated based on message properties) | - |
Listener services
A listener service, or queue listener service, represents your queue listener or topic listener. It counts how many messages have been dequeued, but it doesn't give you insight into the message processing itself.
Dynatrace automatically detects an event-based message queue handler based on its class name and creates a queue listener service for it. A listener service is always followed by a consumer service, which gives you insight into the message processing details.
If you're just monitoring a queue or topic, and not looking into the message processing, the listener service can exist on its own.
Because of their properties,
-
Listener services aren't visible on the analytics pages available from the Queues page, but you can find details in the Service analysis, Service flow, and Distributed traces pages.
-
Listener service requests can't be renamed or pinned to a dashboard.
Note that a listener service is always followed by a messaging service on which you can perform such actions. For example, you can rename the messaging service requests via (global) request naming rules using the message queue name as a placeholder, and then pin the request to a dashboard.
Examples
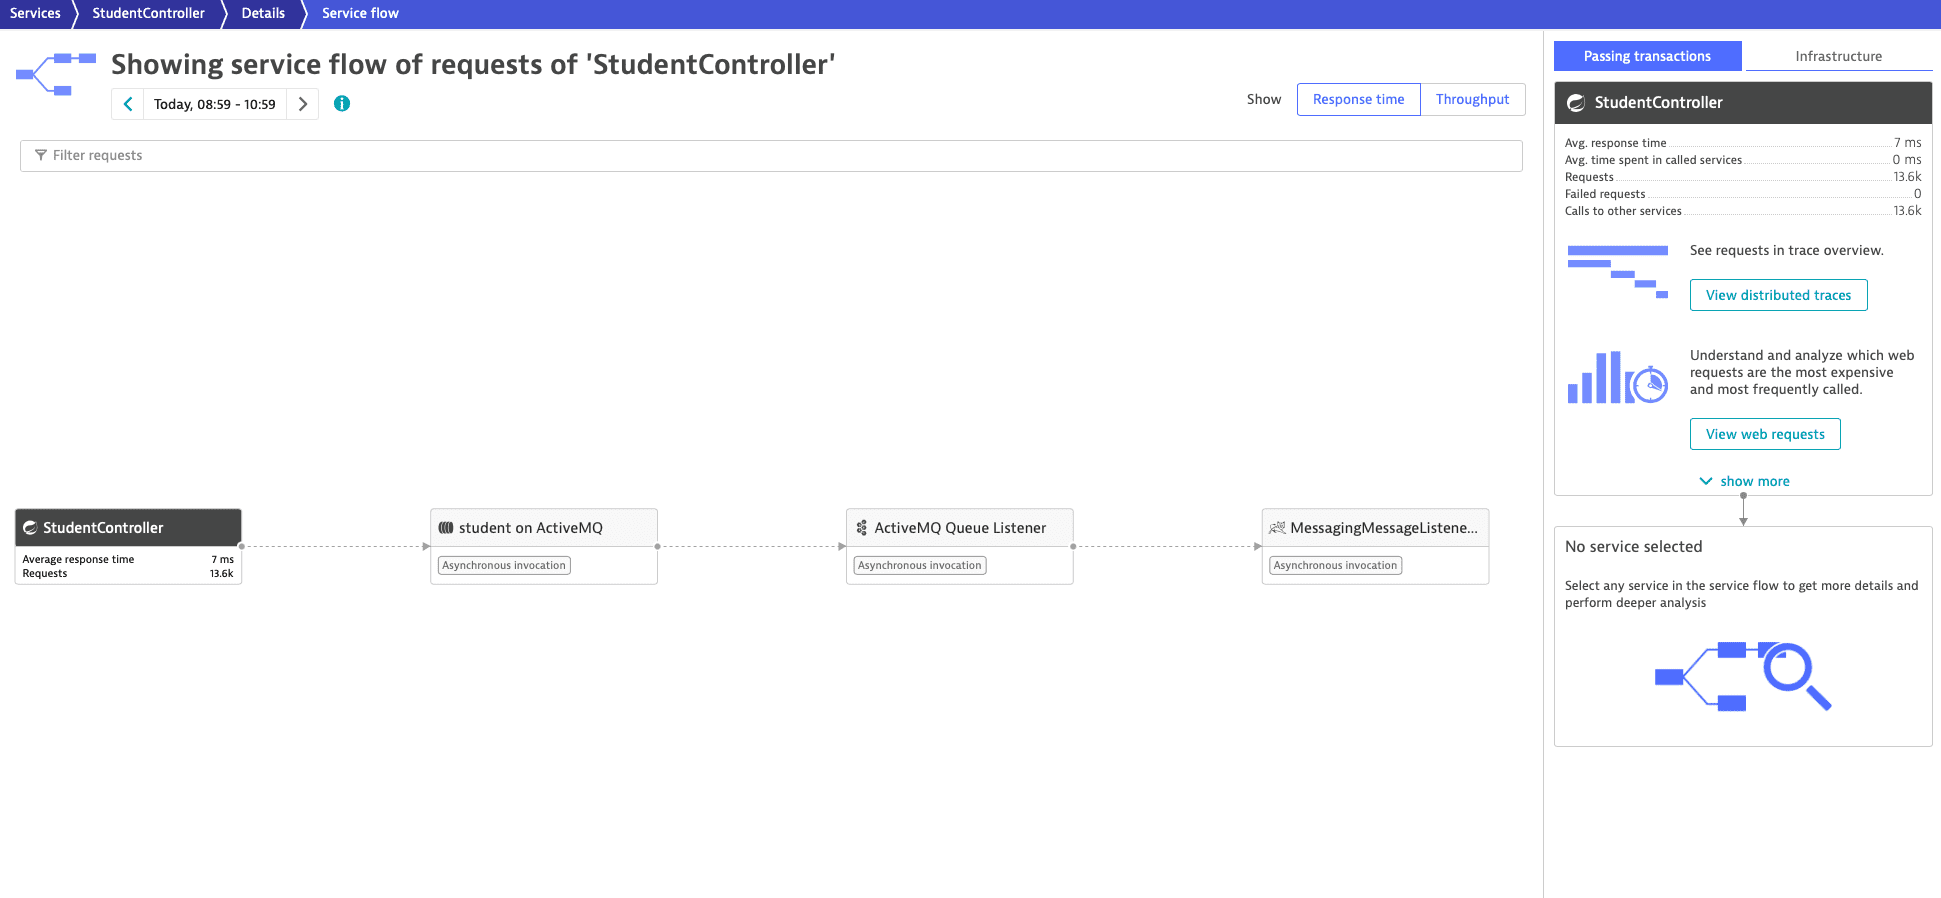
The following is a service flow example with a producer service, queue entity, listener service, and consumer service.

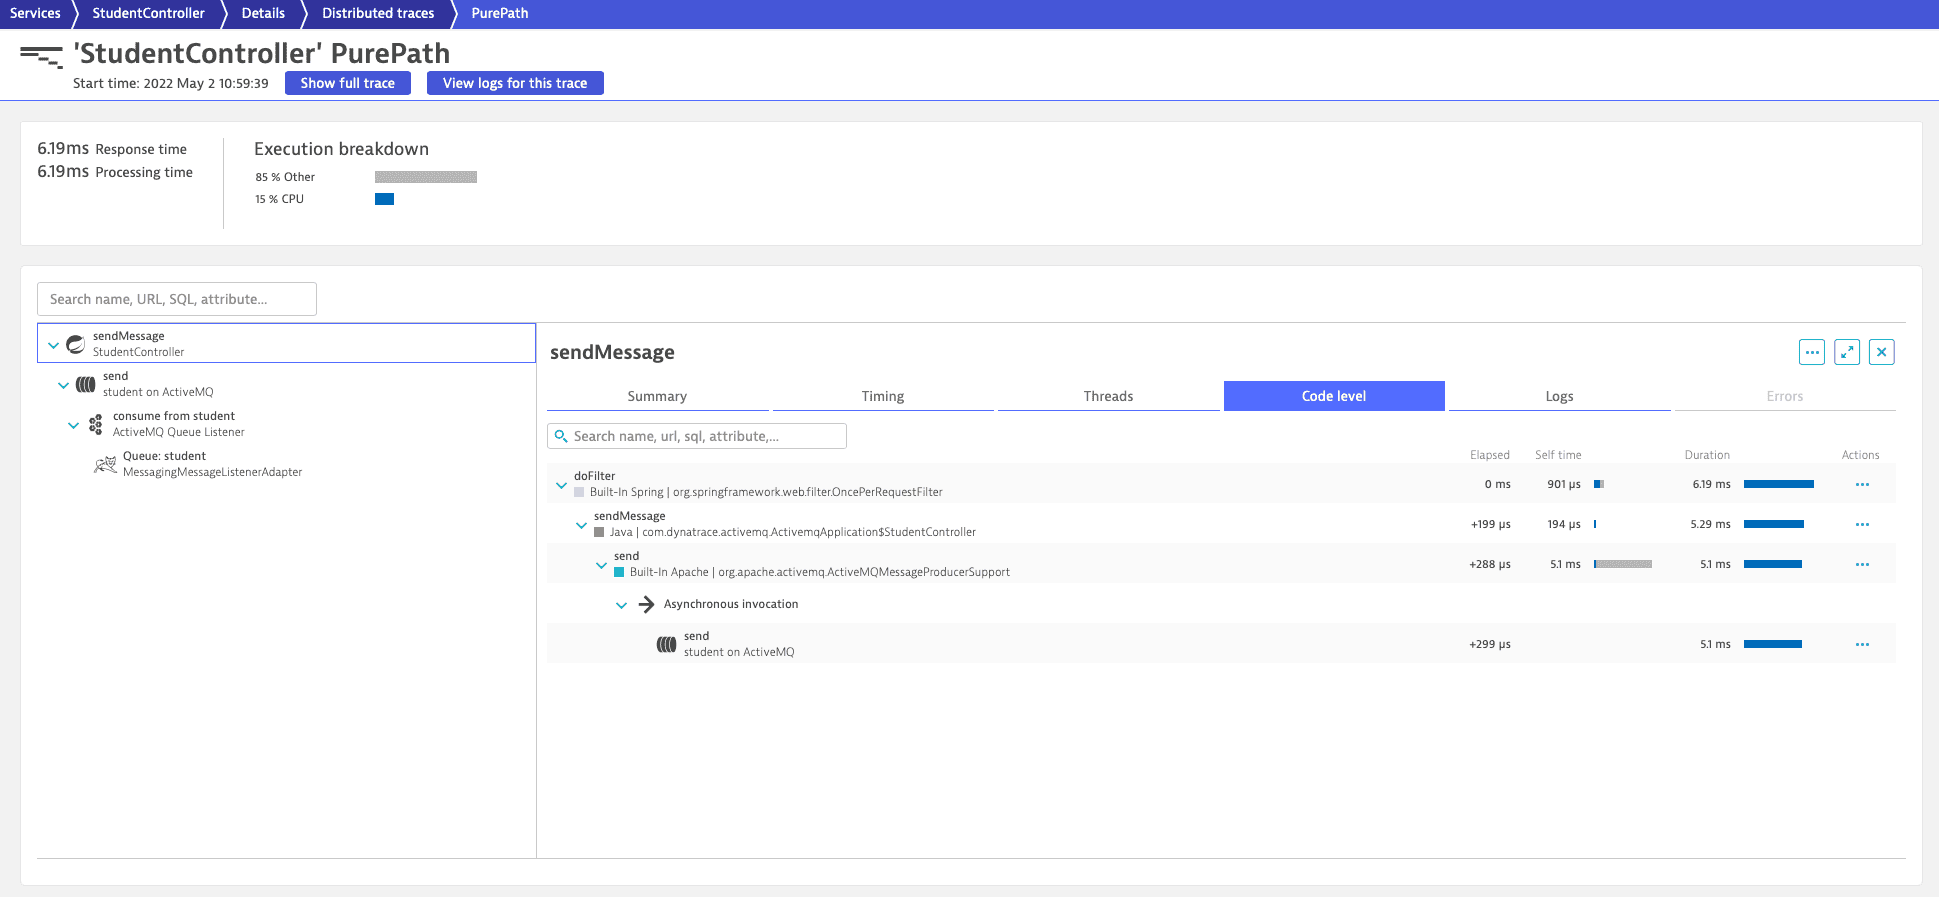
The following is a distributed trace example with a producer service, queue entity, listener service, and consumer service.

Related topics
 Message Queues