Continuous thread analysis
- How-to guide
- 5-min read
- Published Aug 30, 2019
Multiple-thread architectures can easily scale, as the distribution of work allows CPUs to remain active and continue running code. However, when systems need to coordinate work across multiple threads, locks increase and reductions in code run might occur.
In Dynatrace, such behavior is automatically and continuously detected by OneAgent. With continuous thread analysis, data is continuously available, with historical context, and doesn’t need to be triggered if a problem occurs. You can receive alerts on trends, analyze thread dumps, and directly start improving code, when and where it's needed, to prevent bottlenecks.
Before you begin
To start using continuous thread analysis
-
Go to Settings > Preferences > OneAgent features.
-
Find and turn on the following OneAgent features for the technology you want to monitor:
Technology to monitor
OneAgent features to turn on
Java
Continuous thread analysis
Node.js
- Node.js worker threads monitoring
- Node.js code module preloading
Due to a known issue with Java 11, continuous thread analysis of JVM threads is only available for Java 8 and Java 17+ (based on the supported versions). Application and agent threads remain unaffected.
Thread analysis
To start analyzing thread dumps
-
Go to Profiling & Optimization (previous Dynatrace) or
 Profiling & Optimization > Continuous CPU profiling.
 -
For the process group that you want to analyze, select More (…) > Threads.
-
On the Thread analysis page, you can:
- Analyze the thread breakdown by thread states or by estimated CPU time.
- Include or exclude data on waiting threads at any time, by selecting the related checkbox.
- Filter the data
- By request type.
Select Filter requests > Type and choose an option. - By request thread-group name.
Select the thread-group name. The segmentation of thread groups takes into account the fact that they typically run different functionalities, and gives you quick means to identify CPU consumers.
- By request type.
- Analyze the method hotspots of a thread group.
In the thread group Actions column, select More (…) > Method hotspots.
Use cases
Threads are a source of scalability, as they enable your applications to carry out multiple tasks at once. In certain situations, this can become a source of performance bottlenecks. For example:
- High-load systems might experience thread-locking issues, which prevent the application from scaling.
- If the number of active threads is too high, CPU resources can be wasted due to over-utilization or to operating systems being forced to schedule thousands of threads on a limited set of cores.
Example: Locks prevent application scalability
Identify scalability issues
In this example, the process group idea*.exe shows a spike in CPU consumption. We investigate the problem in its Thread analysis page, starting by filtering the thread group list by the Locking thread state.
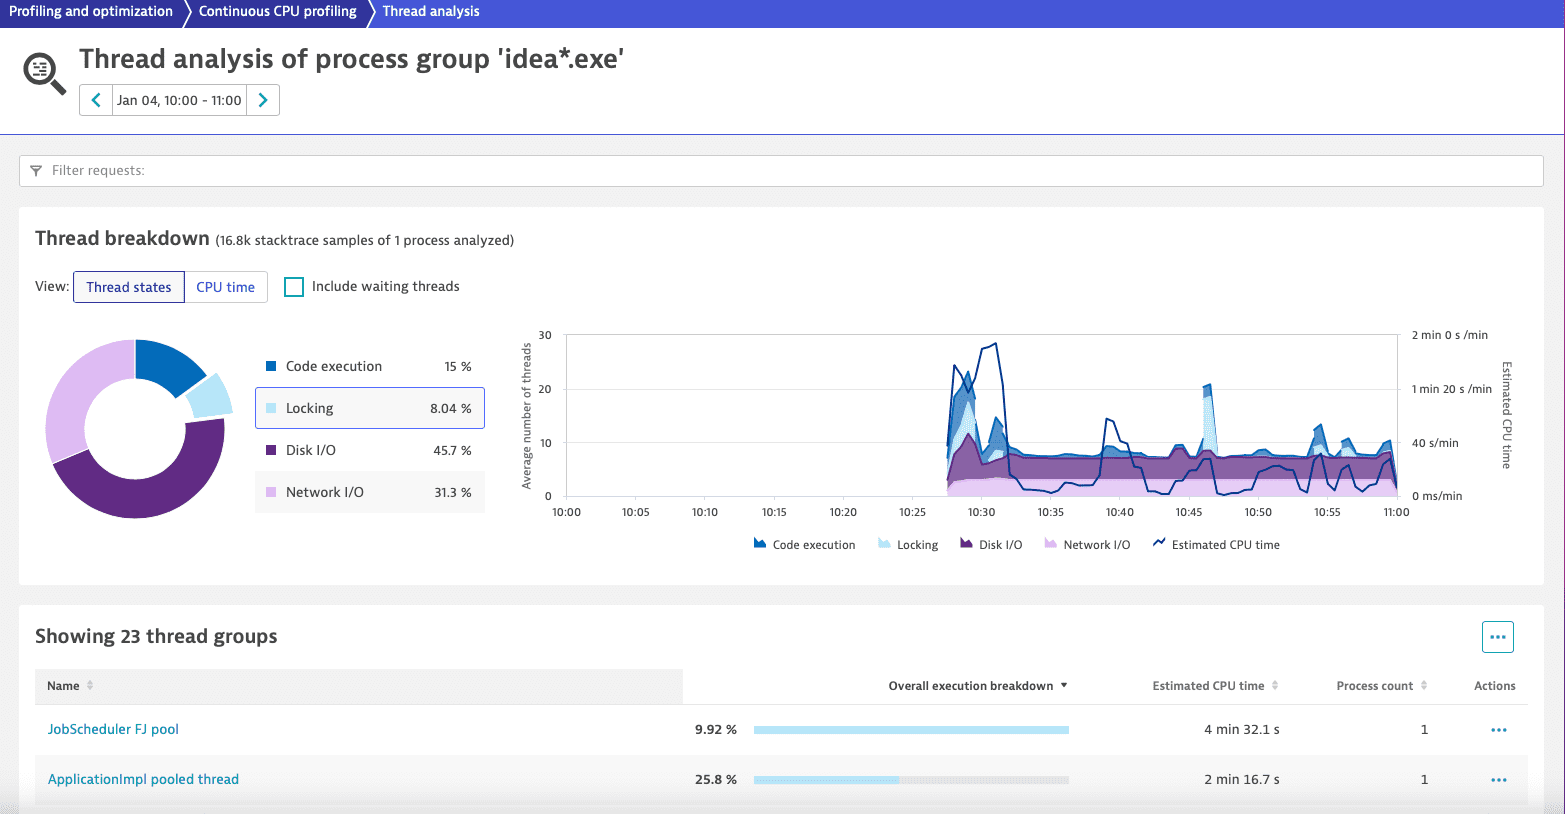
We see that the system is not in bad shape, but there is still locking behavior affecting 23 thread groups. We select the first and most affected thread group, JobScheduler FJ pool, to continue our analysis.
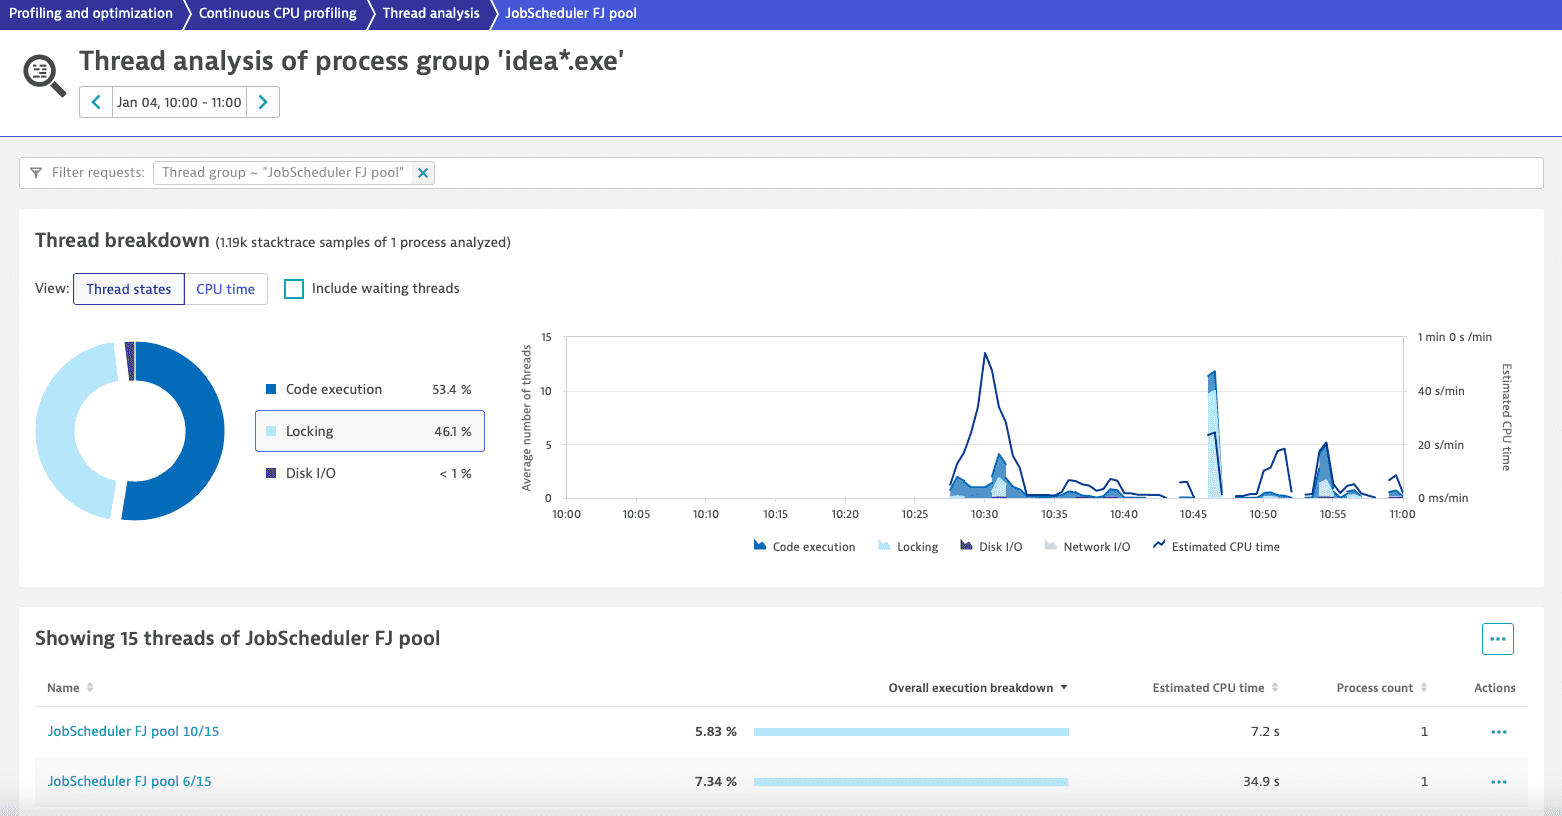
For the thread group JobScheduler FJ pool, a considerable amount of time (almost half: 46.1%) is continuously spent in locking, and it's distributed across 15 threads. This indicates a general lock affecting all of those threads. We want to avoid this behavior because it limits both speed and the ability to increase throughput by adding resources. Ultimately, it can lead to a state where the system won’t be able to process more data even if we add more hardware.
To get to the root cause, we select More (…) > Method hotspots.
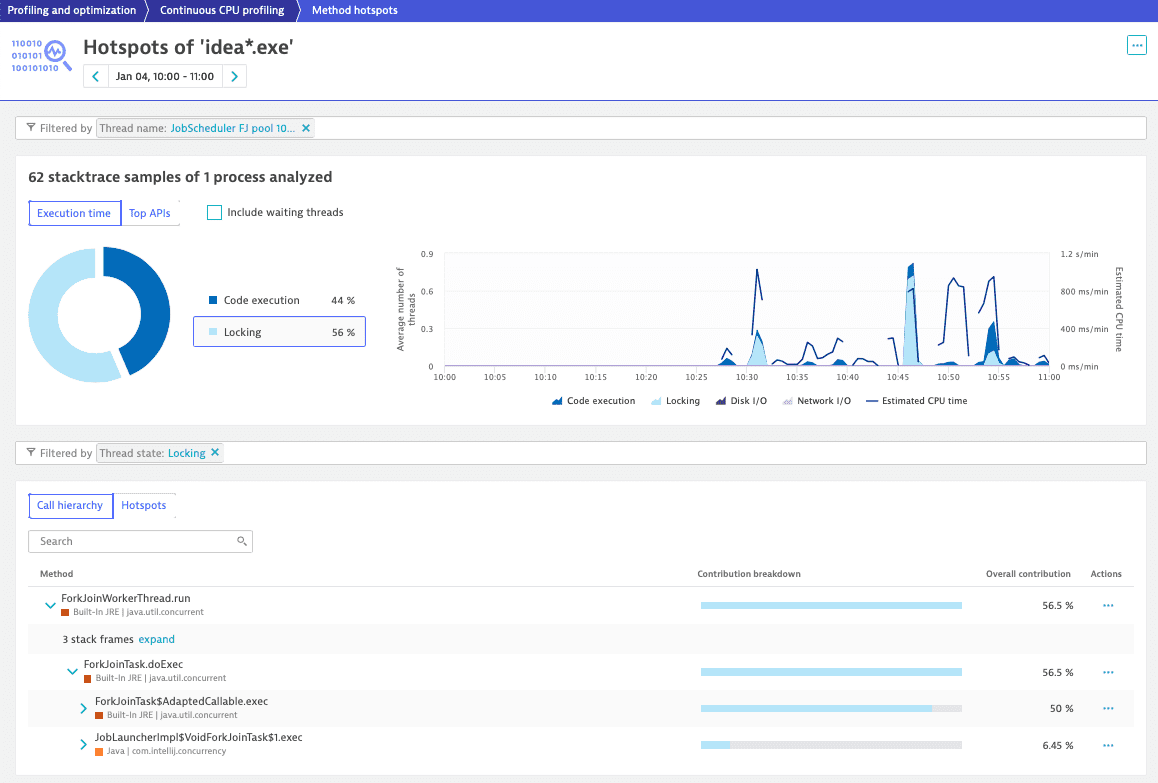
Based on the retrieved information, we can locate the problem of locking and test different ways to write the code to increase its performance.
Example: High number of threads causes over-utilization of resources
Identify CPU-intensive thread groups
In this example, the process group doaks-prod1-eastus-cassandra spends 9.97% of the time in Code execution.
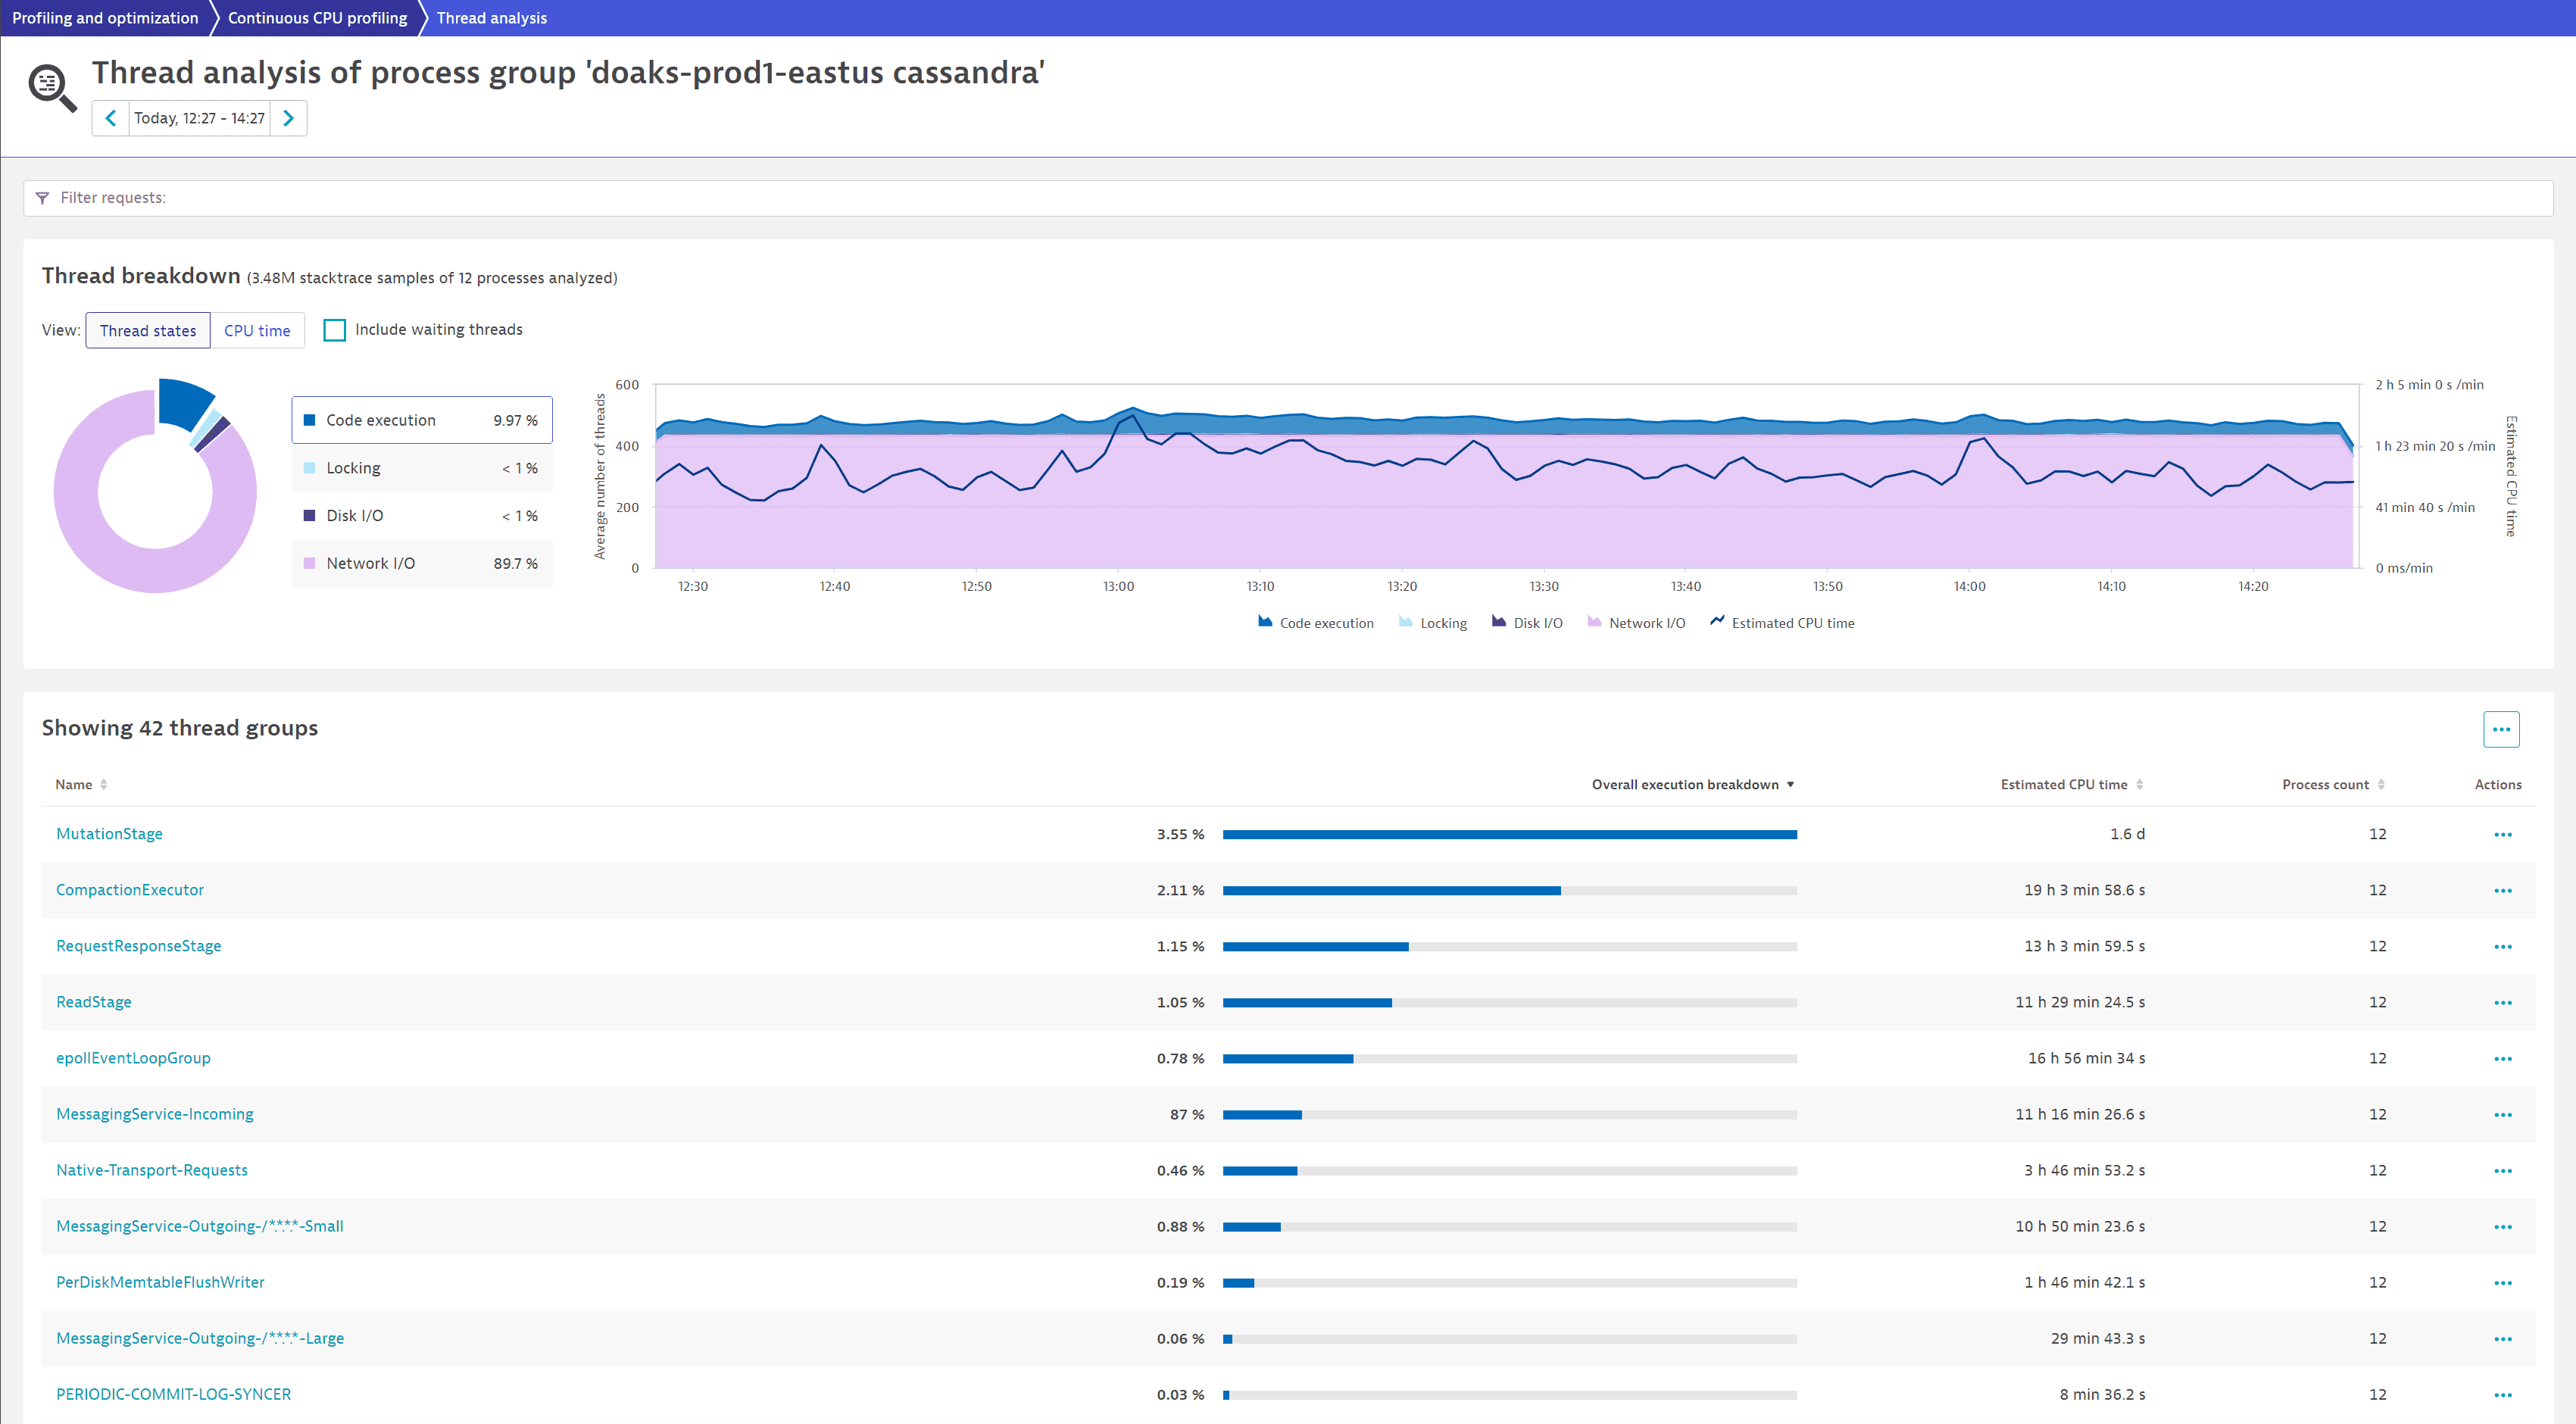
We select CPU time to understand how the behavior is affecting CPU consumption. From the chart, we can see that the thread group MutationStage is the biggest contributor. From the table below, we learn that it's spending 1.6 d in Estimated CPU time and 3.55% of the Overall execution breakdown in code execution.
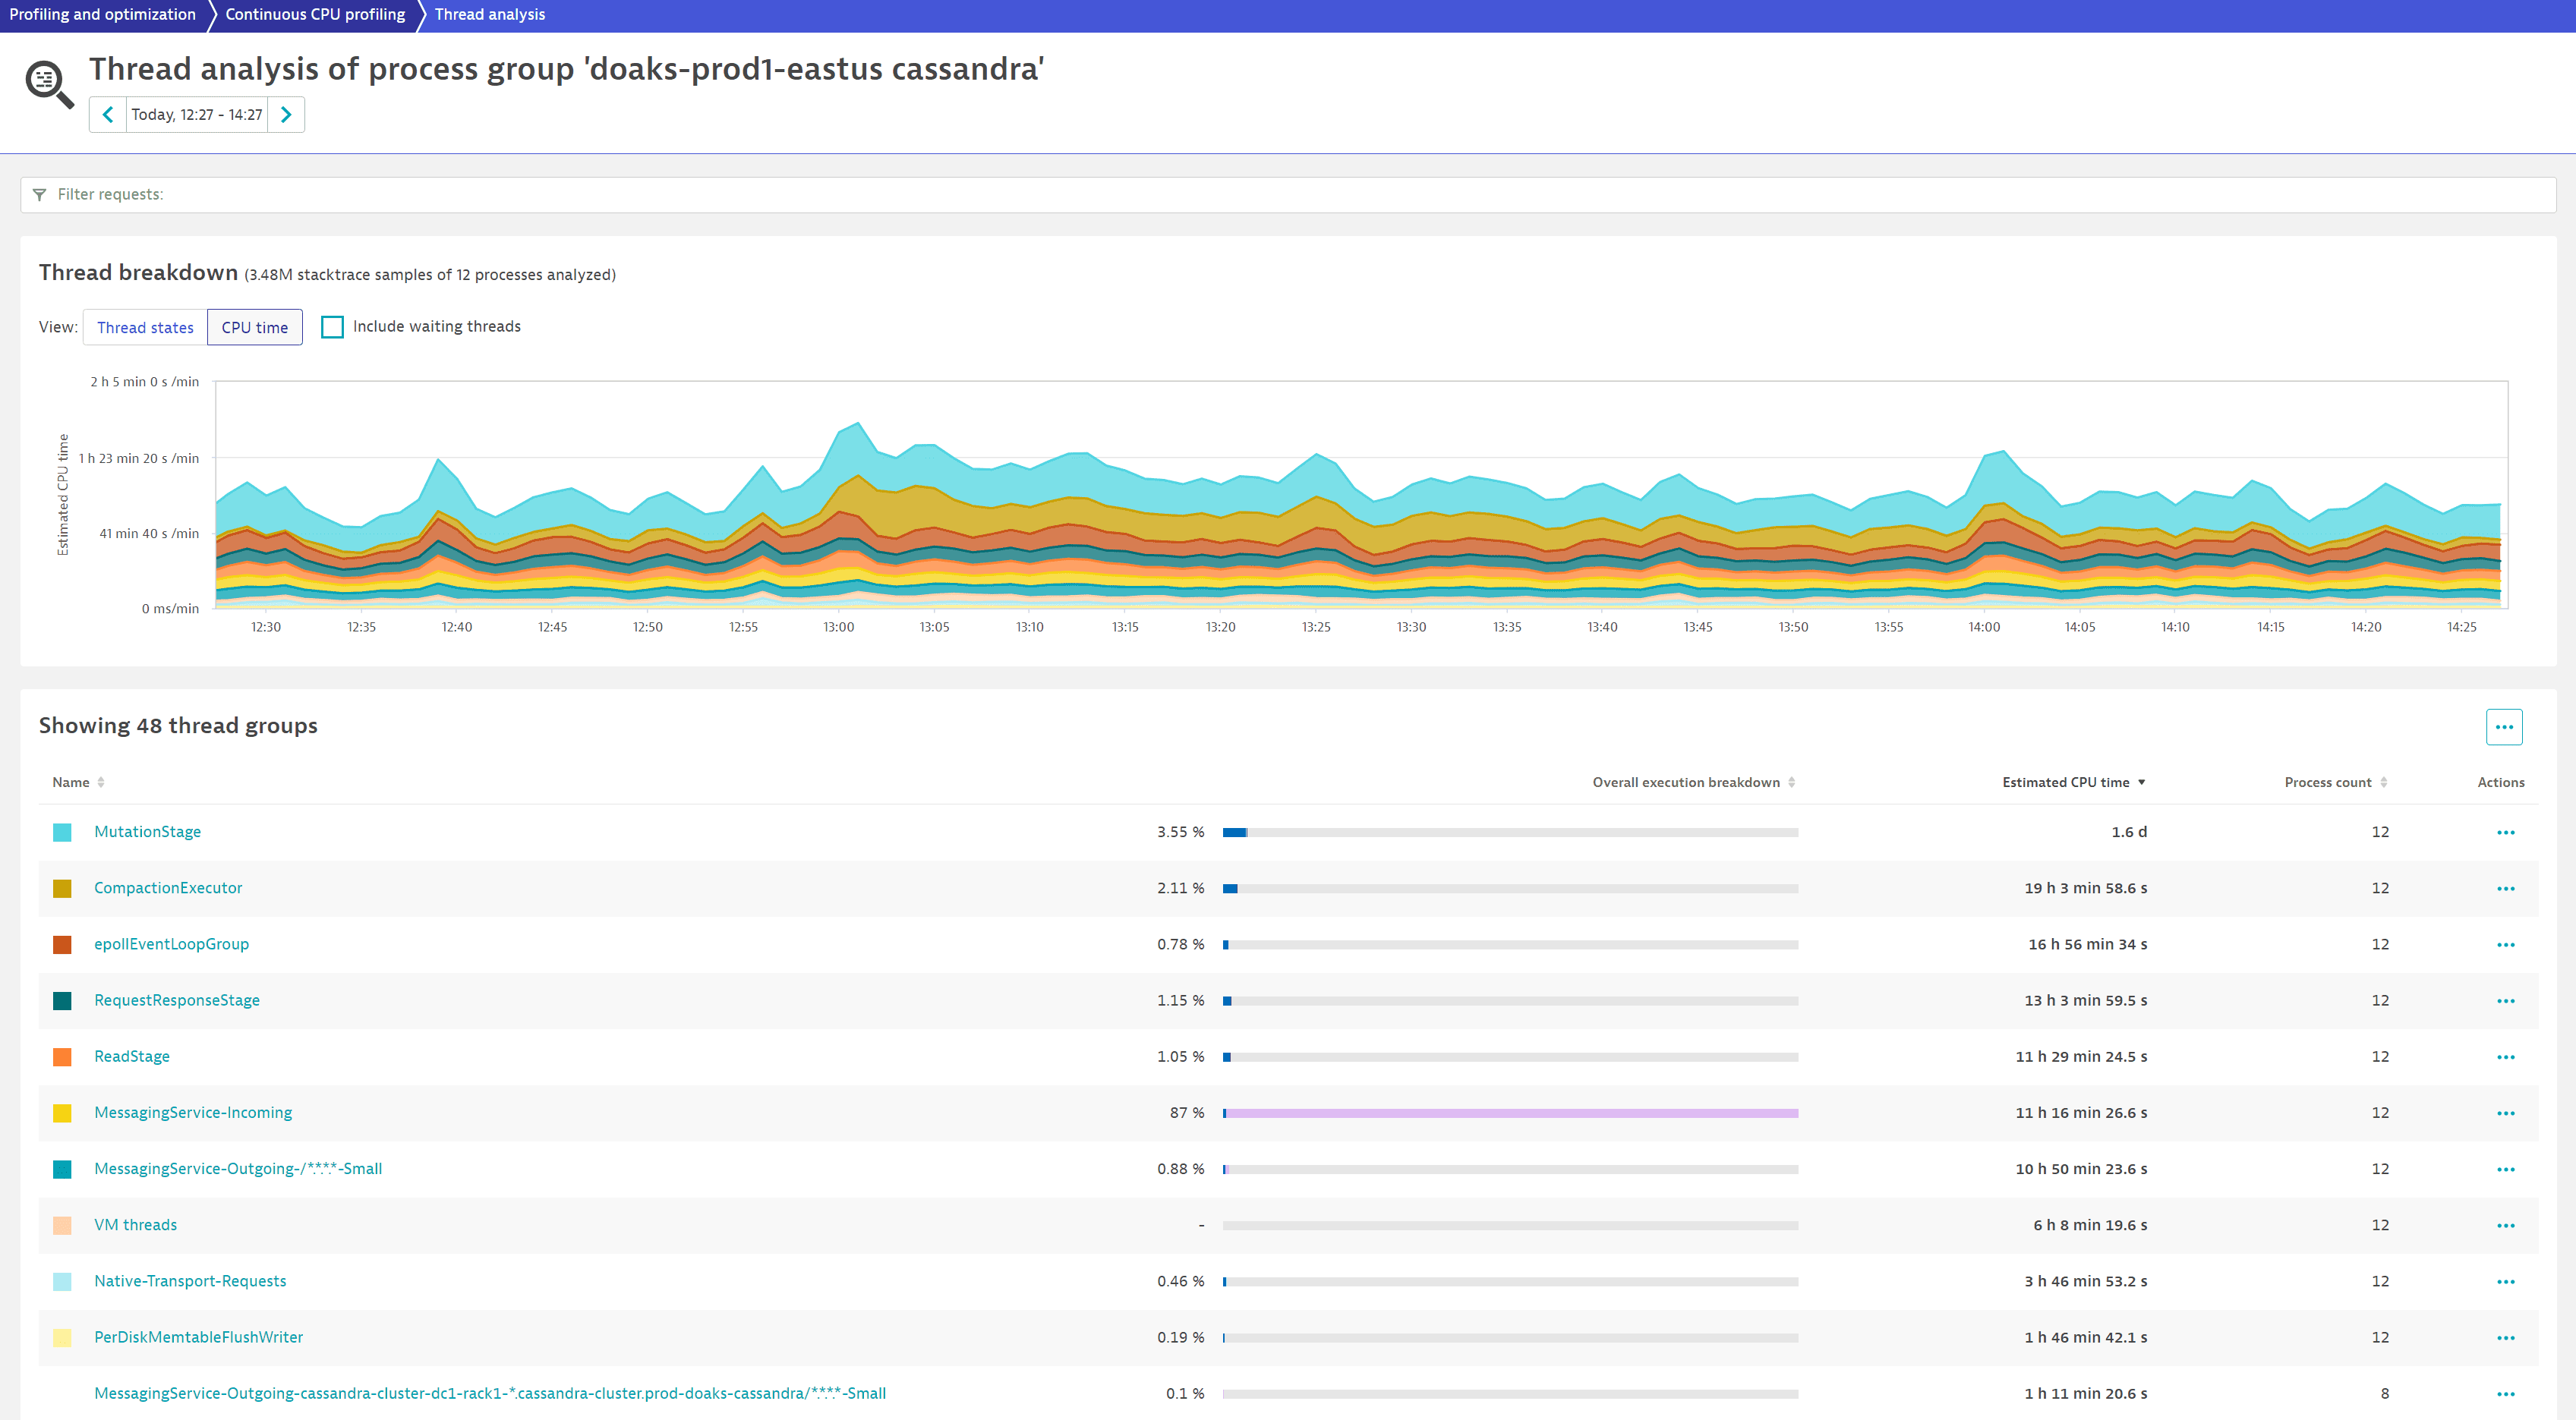
We want to identify which code is executed and how it impacts CPU consumption. After selecting the thread group name (MutationStage), the first thread in the list at the bottom of the page is the highest contributor (MutationStage-2).
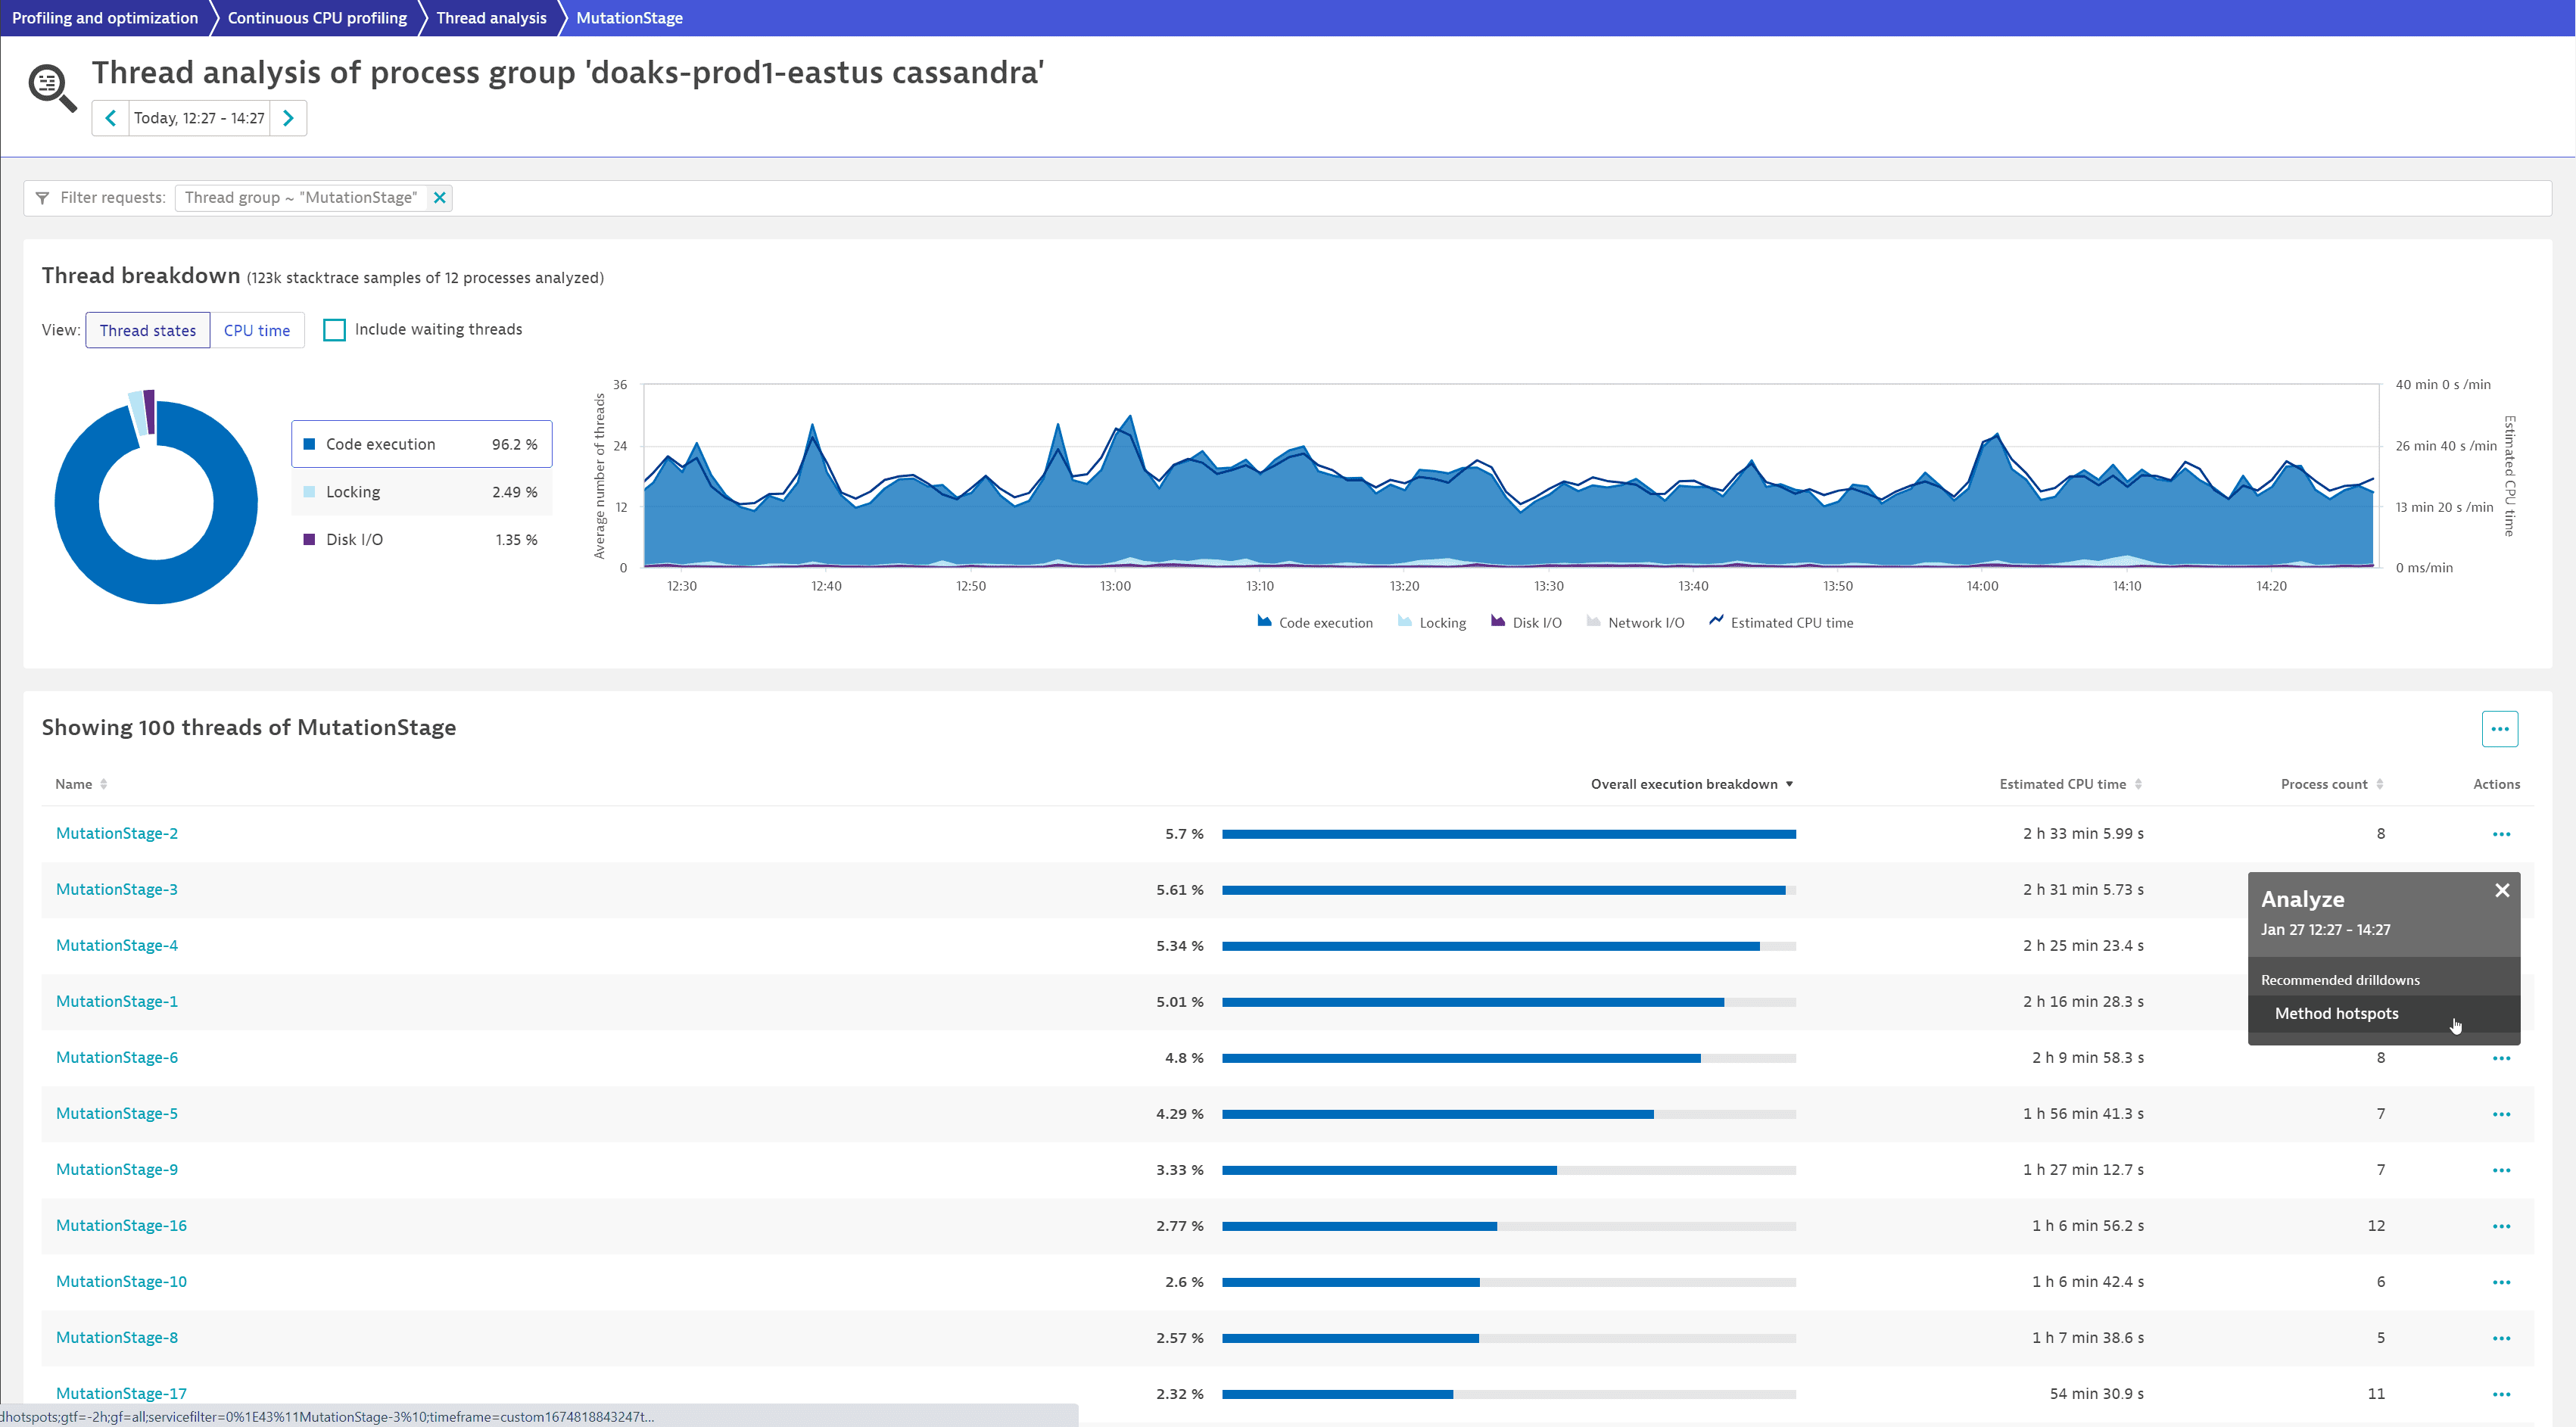
To see a list of hotspots, we select More (…) > Method hotspots for MutationStage-2.
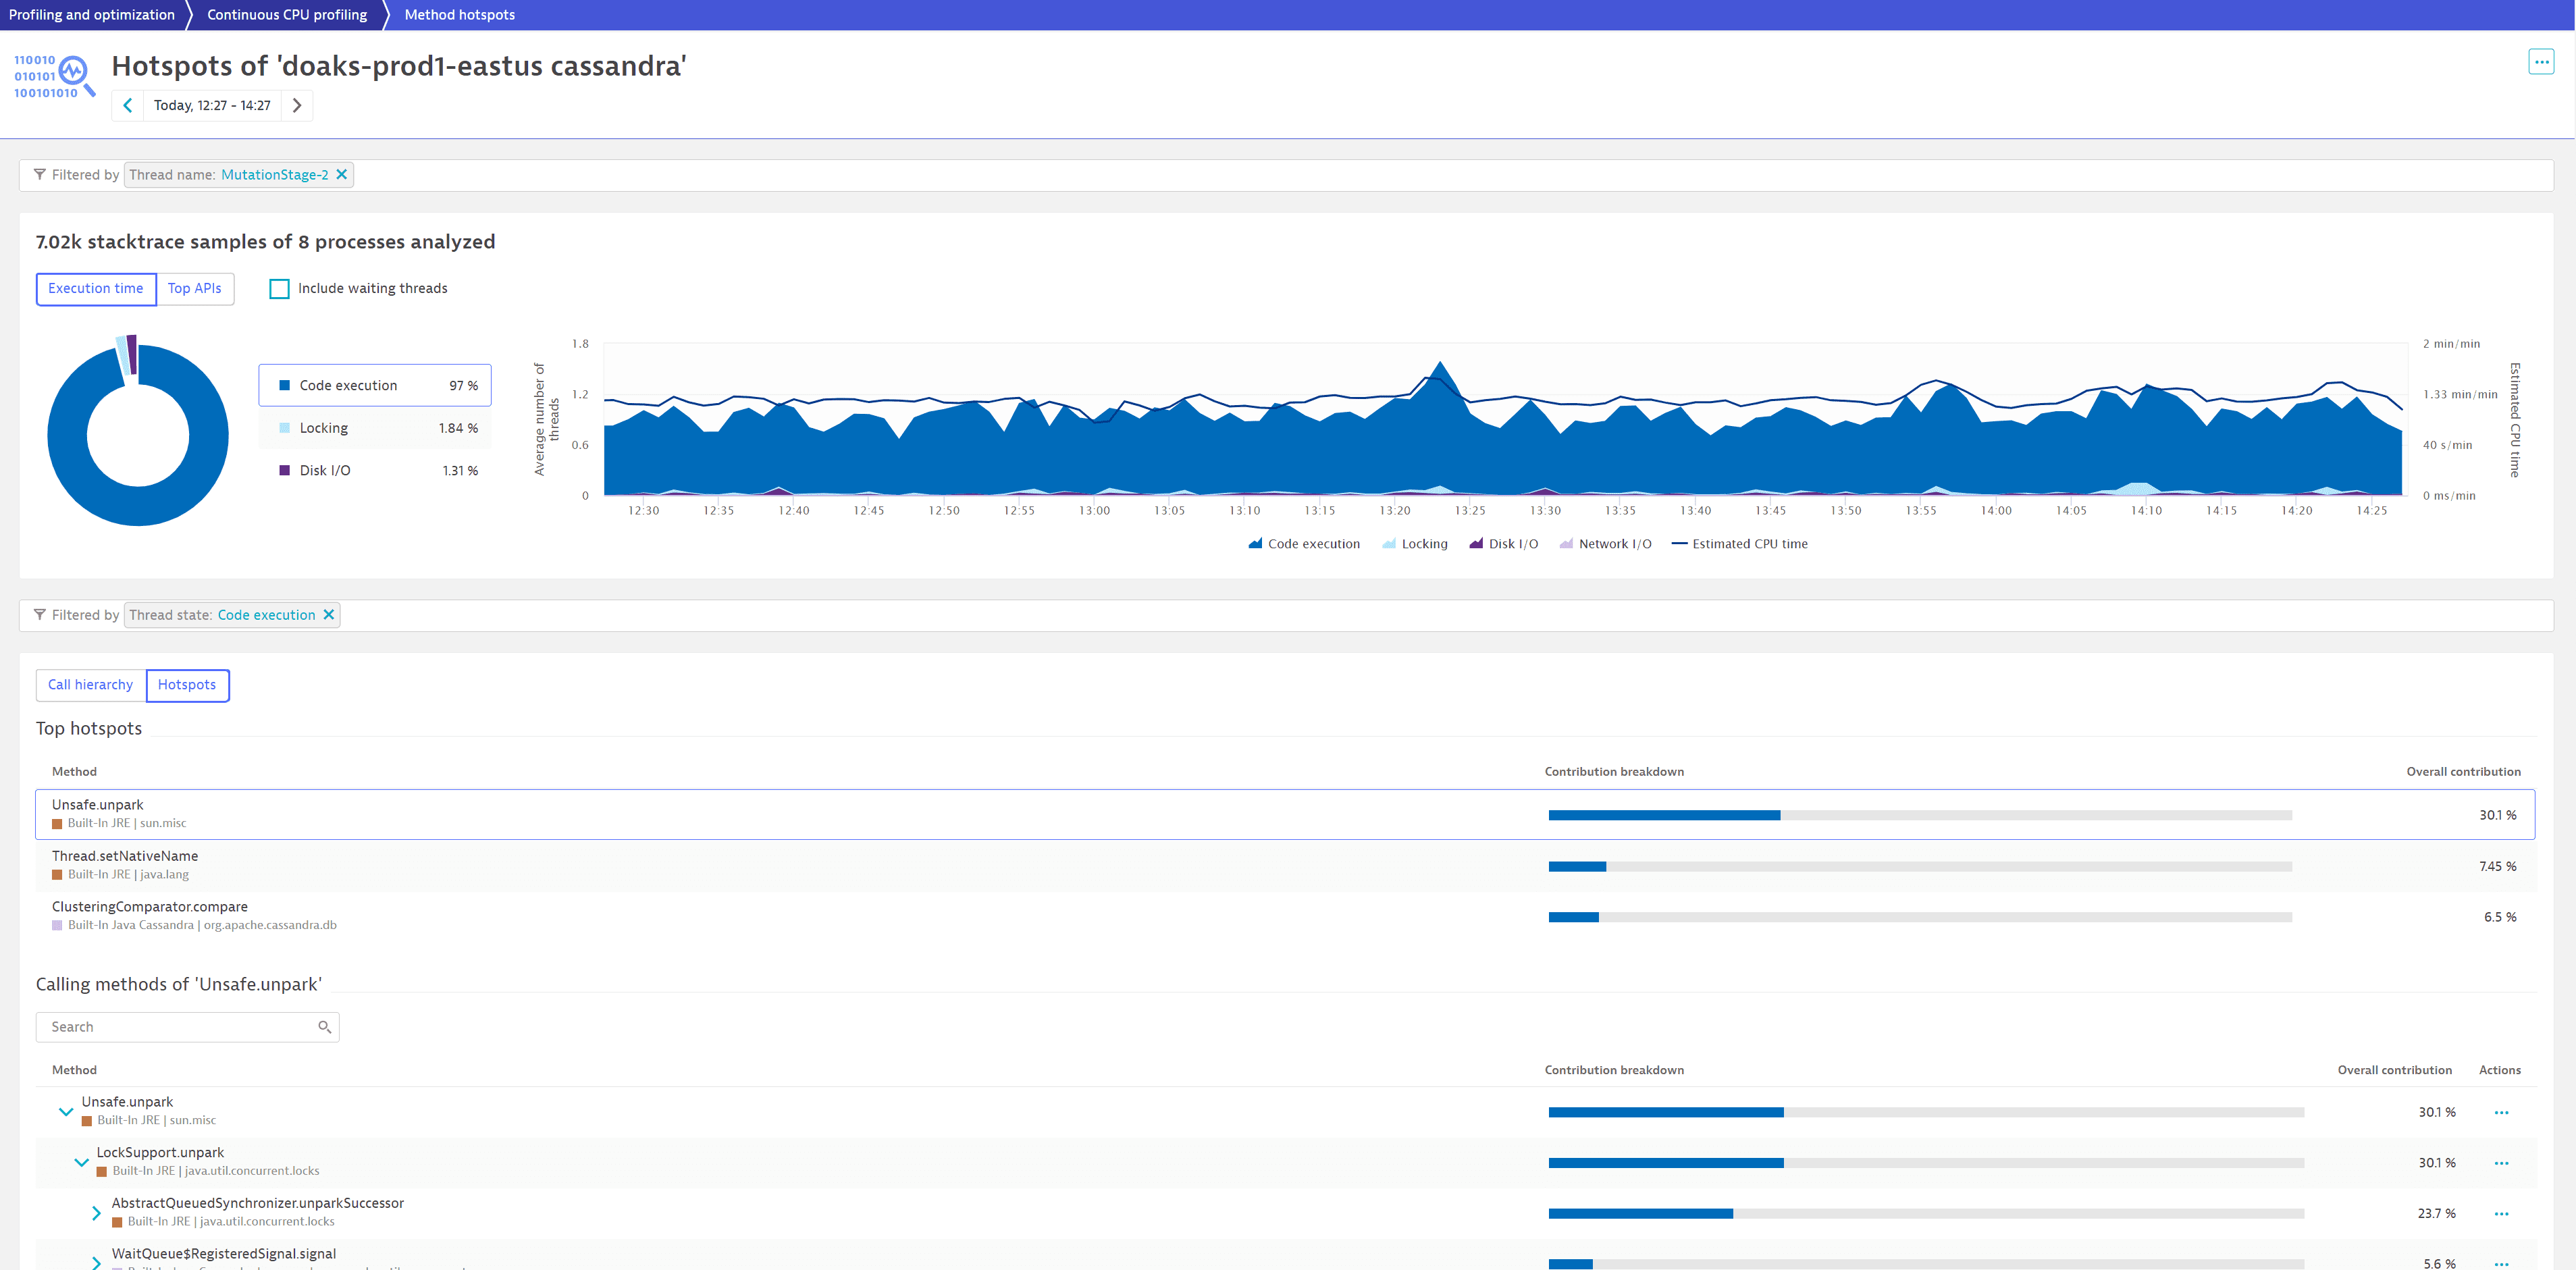
We now see that Unsafe.unpark contributes 30.1% to code execution and is a good candidate for optimization.
Frequently asked questions
Yes, the data retention period for continuous thread analysis is the same as for distributed traces, code-level insights, and errors.
 Profiling & Optimization