Define and apply tags
- Dynatrace Classic
- How-to guide
- 14-min read
- Published Jul 19, 2017
Use tags to organize monitoring data and analysis based on related entities in all environments. Tags simplify searches for related services, process groups, and hosts. They also facilitate the collection of related metrics into meaningful groups for analysis. Tags can also be used for all types of entities across your environment for the purpose of alerting, charting and window maintenance. For more details on defining maintenance windows via tags, see How to define a maintenance window.
You can apply tags manually or automatically.
- Manual tagging is great for small-scale efforts where it isn't worth your effort to create tagging rules when you need to tag just a few static items.
- Automatic, rule-based tagging is great for dynamic or large-scale environments, where manual tagging can be impractical. Rule definition for automatic tagging requires some up-front effort on your part, but it's much easier and more reliable than trying to manually keep up with tags on thousands of entities in a changing environment.
Manual tagging
In smaller environments, tags can be set up manually by following the steps listed below.
View all manually applied tags
To list all tags manually applied to any entities
- Go to Settings and select Tags > Manually applied tags.
- Optional In the Filter by name box, enter a filter string to list all manually applied tags that match your search string:
- Enter a partial string to match all tags that start with, end with, or contain the string (
bcmatchesbcd,abc, andabcd) - Use a colon to find a key:value combination
- In a large environment, you may need to use filtering to limit the list to a manageable size or use rule-based automatic tagging.
- Enter a partial string to match all tags that start with, end with, or contain the string (
To list all tags manually applied to a certain entity (such as an application, browser monitor, HTTP monitor, service, host, or process)
- Open the entity-specific page (such as a host details page).
- Tags applied to that entity are listed under the page title.
- You can view, add, and delete manually applied tags directly from the entity-specific page.
- Automatically applied tags are also listed, but you can't add or delete them directly; they are applied based on tagging rules that you define for automatic tagging.
Manually apply or clear a tag
You can manually apply and clear tags:
- From the Manually applied tags page—best for manually applying or clearing tags on multiple entities
- From the entity page—handy for when you're working with a specific entity such as a single host
Manual tagging of multiple entities
To manually apply or clear a tag for multiple entities
-
Go to Settings and select Tags > Manually applied tags.
-
Find and select an existing tag, or create a new tag.
To find and select an existing tag
- In the Filter by name box, enter a filter string to list all manually applied tags that match your search string:
- Enter a partial string to match all tags that start with, end with, or contain the string (
bcmatchesbcd,abc, andabcd) - Use a colon to find a key:value combination
- Enter a partial string to match all tags that start with, end with, or contain the string (
- When you find the tag, select its name. This displays a table of manually taggable components.
To create a new tag
- In the Key (required) box, enter the name of the new tag.
- Optional In the Value box, enter a value (to create a key:value pair)
- Select Add. This creates your tag and optional value, and then displays a table of components to which you can apply the new tag.
- In the Filter by name box, enter a filter string to list all manually applied tags that match your search string:
-
By default, the table displays applications.
- If you are applying an existing tag,
Taggedis selected and the selected check boxes indicate applications to which the tag has already been applied - If you are creating a new tag,
Untaggedis selected and no check boxes are selected (because the tag doesn't exist yet)
- If you are applying an existing tag,
-
Optional Change
ApplicationstoAll typesor another specific component type, depending on the type of component to which you want to apply the tag.Component types that you can manually tag
- Applications
- Browser monitors
- HTTP monitors
- Services
- Hosts
- ESXi
- AWS
- Azure Scale sets
- Processes
- Process groups
- Custom devices
- Custom device groups
-
Optional Change
TaggedtoAllorUntagged.All/Tagged/Untagged options
- All—list all components of the selected type, regardless of whether the selected tag has been applied to them
- Tagged—list all components of the selected type to which the selected tag has already been applied
- Untagged—all components of the selected type to which the selected tag has NOT already been applied
-
Optional Enter a value in the edit box.
Value
This is a value for a key:value pair.
-
Select or clear the check box for each component for which you want to apply or clear the selected tag.
- Select the Tag component check box to apply the tag to all matching components
- Clear the Tag component check box remove the tag from all matching components
Manual tagging of a single entity
To manually apply or clear a tag for a single entity (such as an application, browser monitor, HTTP monitor, service, host, or process), it may be easier to start from the entity page.
For example, to tag a single host manually
- Go to
 Hosts Classic.
 - Select the host that you want to tag.
- Expand the Properties and tags section under the page title to list all tags applied to that host manually or automatically.
- Manually applied tags have a delete button, indicating that you can delete them manually.
- Automatically applied tags have no delete button. When you hover over an automatically applied tag, a tooltip displays the tag key and value followed by the phrase
(applied by tagging rule).
- Select Add tag.
- In the pop-up window, enter the required Key, optionally enter a Value, and select Add.
- If you decide that you instead want to tag multiple entities (such as hosts), select Tag settings in the pop-up window to open the Manually applied tags page, and then follow the Manual tagging of multiple entities instructions above.
Automatic tagging
Automatic tagging is rule based:
- Tags are applied automatically to new entities that match rules you've defined.
- Automatically applied tags can’t be removed manually from individual services, process groups, process group instances, applications, or hosts.
You can also set up automated tagging of the entities in your environment using:
How to define an automatically applied tag
To automatically apply a tag
-
Go to Settings and select Tags > Automatically applied tags.
-
Select Create tag.
-
Type a name for the new tag in the Tag name field.
-
Select Add new rule.
-
Specify an Optional tag value. This value will appear next to the tag name after a
:and is used to provide more precise information. This value can be a property of the entity (for example, a service or a process group) where the tag is applied to. If the selected property is not available, the tag value will remain empty. Please note, that optional tag value placeholders do not work for entity selector based rules. -
From the Rule applies to list, choose the type of entity you want to apply the rule to (such as
Services,Process groups, orHosts). -
Optional Restrict the rule to specific entities by setting the provided properties using the respective lists.
-
You can directly define a condition that the entity must meet before the tag is applied. If you want to define more conditions, select Add condition. Conditions check for specific values of any property that is available within the Conditions drop list on the left. A rule example for a tag named
ocp-projectis shown in the image below.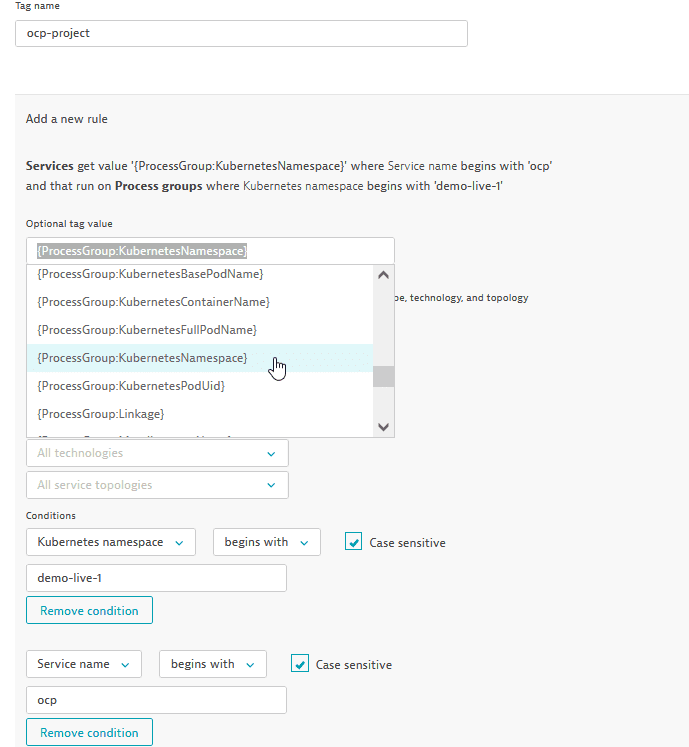 Page showing how to create rule for a new tag.
 -
You can also propagate a rule to the underlying entities (such as process groups and hosts in the case of services, or hosts in the case of process groups) by selecting the corresponding check boxes at the bottom of the rule (see image above).
-
Select the Preview button to verify the results returned by the specific rule. Note that to be tagged, an entity must meet all the specified conditions of a rule.
-
Select Create rule. You can define multiple rules for each tag. Rules are executed in order. You can edit or delete a defined rule or activate/deactivate a rule at any time via the Disable/Enable switch.
-
To save your tag, select Save changes at the bottom right corner of the page.
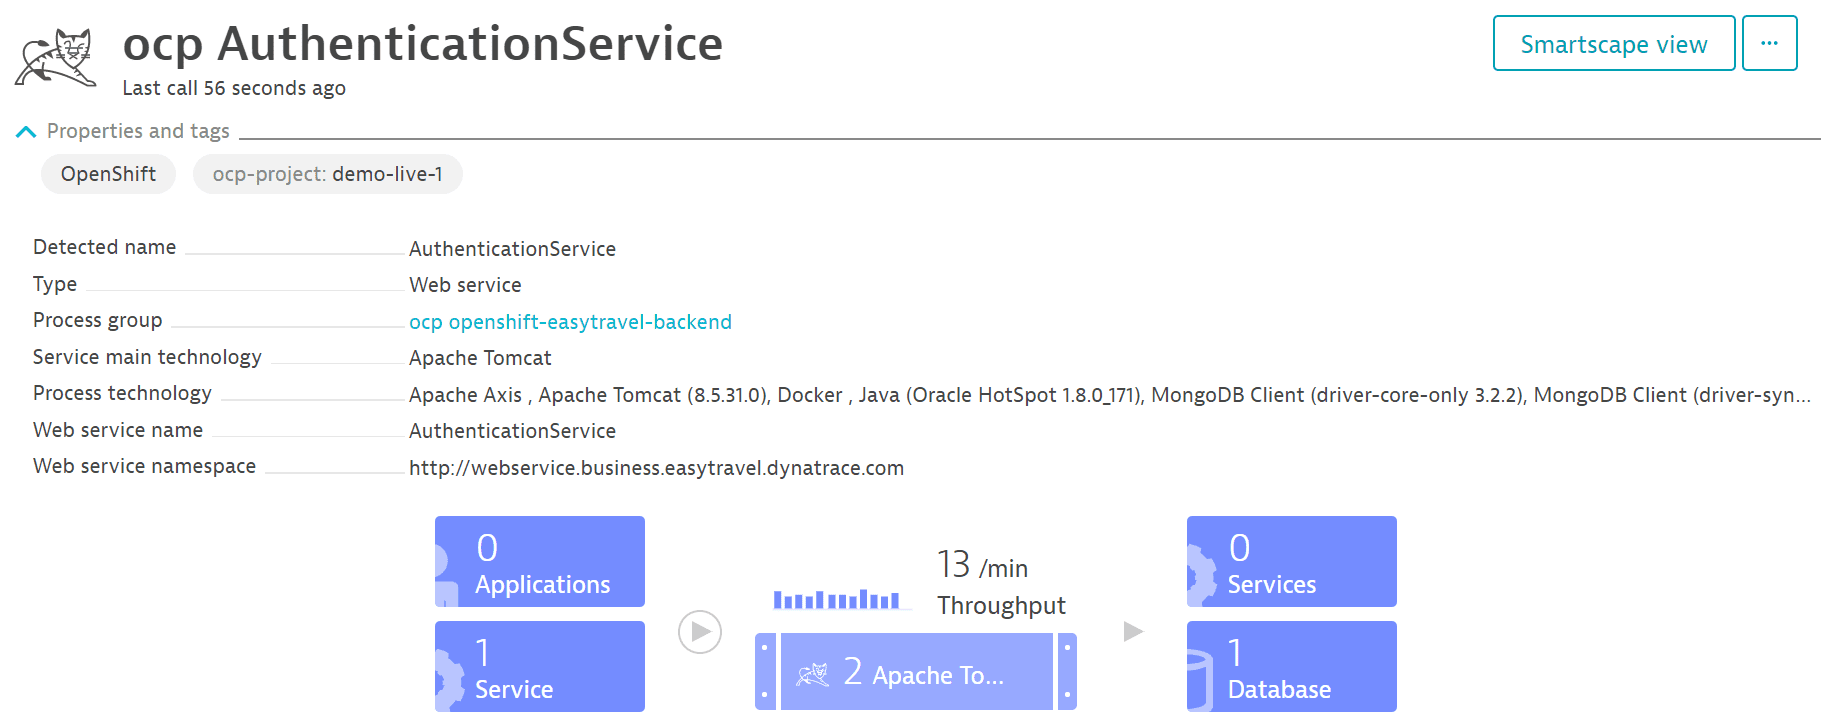
When you select a tag, you can see the rules currently defined for the tag as well as the entities that match all the defined rules in the Matching entities area. Automatically applied tags are applied to all existing and newly detected entities (services, process groups, and others). Note that it can take up to a minute before your new tag is applied. Once a tag is applied to an entity, the tag is listed on that entity's page. For example, with services, each new tag is listed on the service's overview page within the Properties and tags section. The tag named ocp-project, for instance, that was defined in the example above, appears on the overview page of ocp AuthenticationService within Properties and tags extended with the tag value demo-live-1 (see image below).
Each tagging rule is self-contained and evaluated independently of any other existing rules.
Regular expressions
You can create conditions for your automatically applied tags based on regular expressions. In step 8 above, select the property you want from the Conditions drop list on the left. Then select contains regex from the next drop list and type the regular expression in the text field.
Automatically applied tags cannot be used in conditions for automated rule-based tagging.
Service and process group properties available for tagging
The service and process group properties available for tagging vary based on technology type.
To find out which properties a service provides:
- Go to
Services Classic.
- Select the service that you want to tag.
- Select Properties and tags to display the available properties.
To find out which properties a process group provides
- Go to
 Hosts Classic.
 - Select the host that includes the process group you want to tag.
- Select Properties and tags to display the available properties.
Properties supported by Dynatrace for automated tagging
Service properties
- Custom service class name
- Database name
- Database topology
- Database vendor
- Detected service name
- Endpoint path
- Public domain name
- Service name
- Service port
- Service tags
- Web application ID
- Web context root
- Web server host
- Web server name
- Web service name
- Web service namespace
Process properties
- Apache Spark master IP address
- Apache configuration path
- Azure host name of process
- Azure site name of process
- Catalina base
- Catalina home
- Cloud Foundry application
- Cloud Foundry instance index
- Cloud Foundry space
- Cloud Foundry space ID
- ColdFusion JVM configuration file
- ColdFusion service name
- Detected group name
- Detected process name
- Docker container name
- Docker image name
- Dotnet command
- Dynatrace custom cluster ID
- Dynatrace custom node ID
- Elasticsearch cluster name
- Elasticsearch node name
- EXE name
- EXE path
- GlassFish domain name
- GlassFish instance name
- IIS application pool
- IIS role name
- JBoss home
- JBoss mode
- JBoss server name
- Java JAR file
- Java JAR path
- Java main class
- Kubernetes base pod name
- Kubernetes container name
- Kubernetes full pod name
- Kubernetes namespace
- Kubernetes pod uid
- Listen port
- Node.js application name
- Node.js script name
- Process group name
- Process name
- Ruby application root path
- Ruby script path
- Varnish instance name
- WebLogic home
- WebLogic name
- WebSphere cell name
- WebSphere cluster name
- WebSphere node name
- WebSphere server name
Host properties
- AWS availability zone
- Azure SKU
- Azure compute mode
- Azure web application host name
- Azure web application site name
- Cloud type
- Detected AWS Availability Zone
- Detected host name
- EC2 Instance ID
- Host IP address
- Host group name
- Host name
- Host tags
- Hypervisor type
- Local EC2 host name
- OS type
- OS version
- PaaS type
- Public EC2 host name
Rule examples for defining automatically applied tags
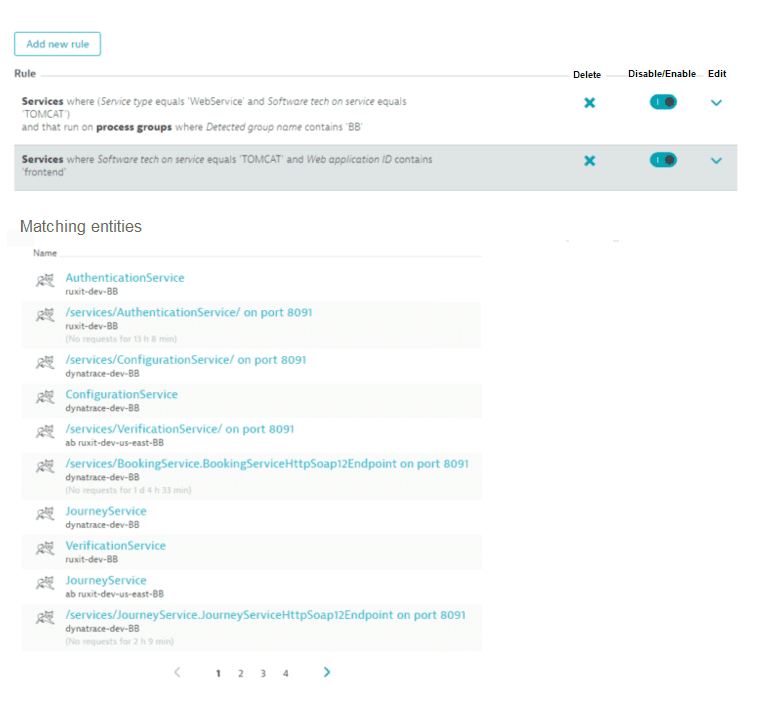
The image below shows two rules. The first rule filters services that are of type Web service, running on Tomcat, that include the string BB in their process group names. The second rule returns services that run on Tomcat and whose Web application ID contains the word frontend.
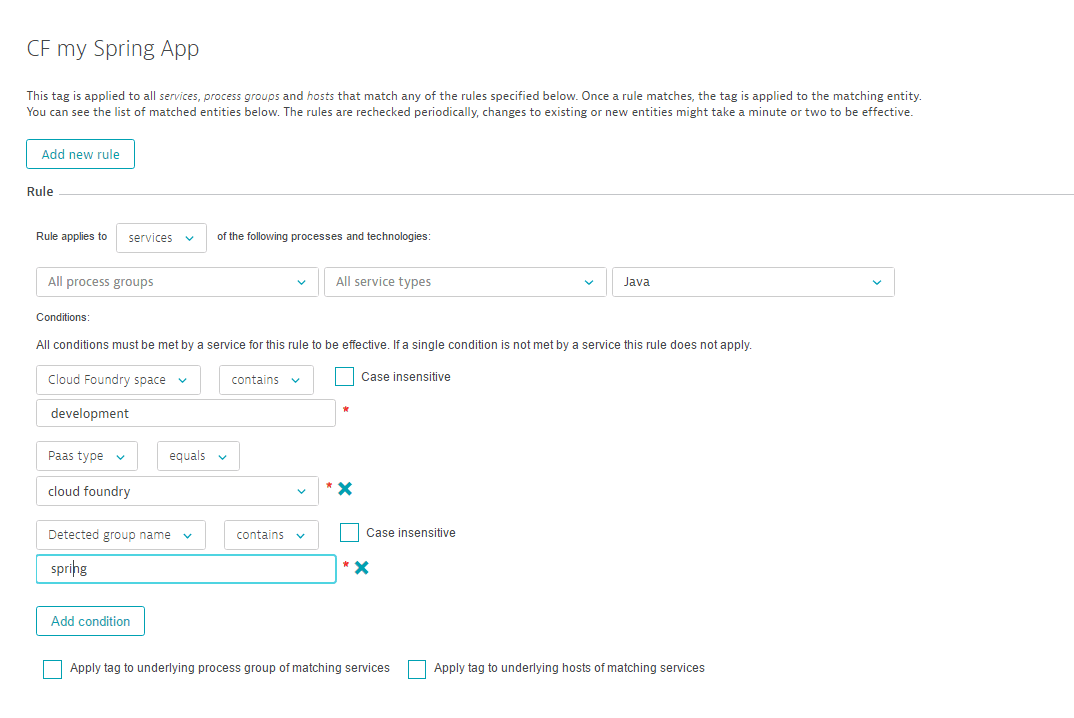
The rule example below matches all services that are built on Java-based service technologies, run in a Cloud Foundry space called development, have the PaaS setup type cloud foundry, and include the string spring within their detected process group name.
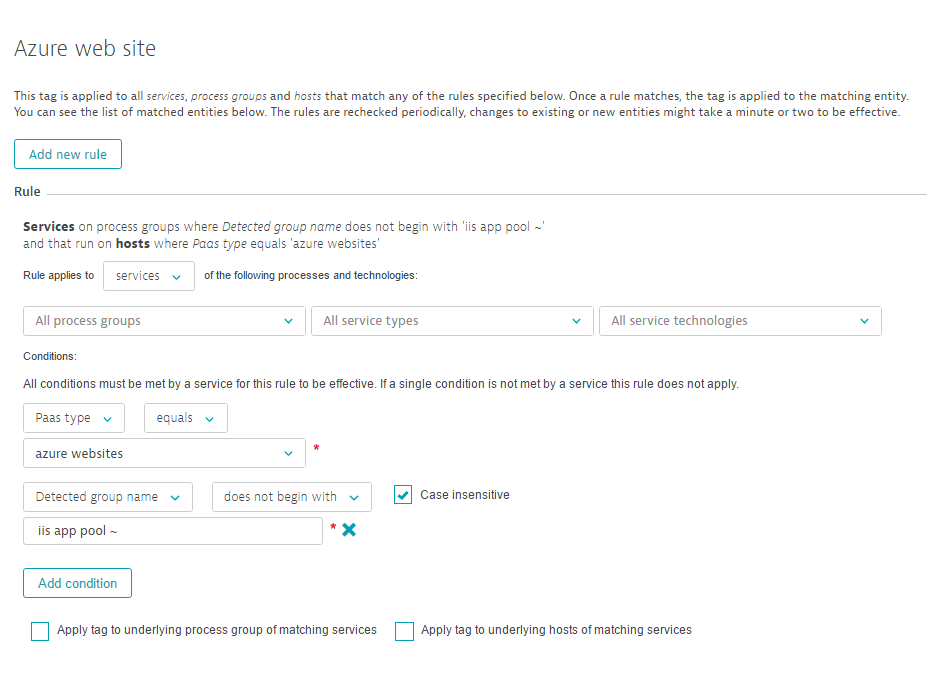
The example below shows a rule that applies a tag to all Azure websites services on process groups where the Detected group name does not begin with IIS app pool ~.
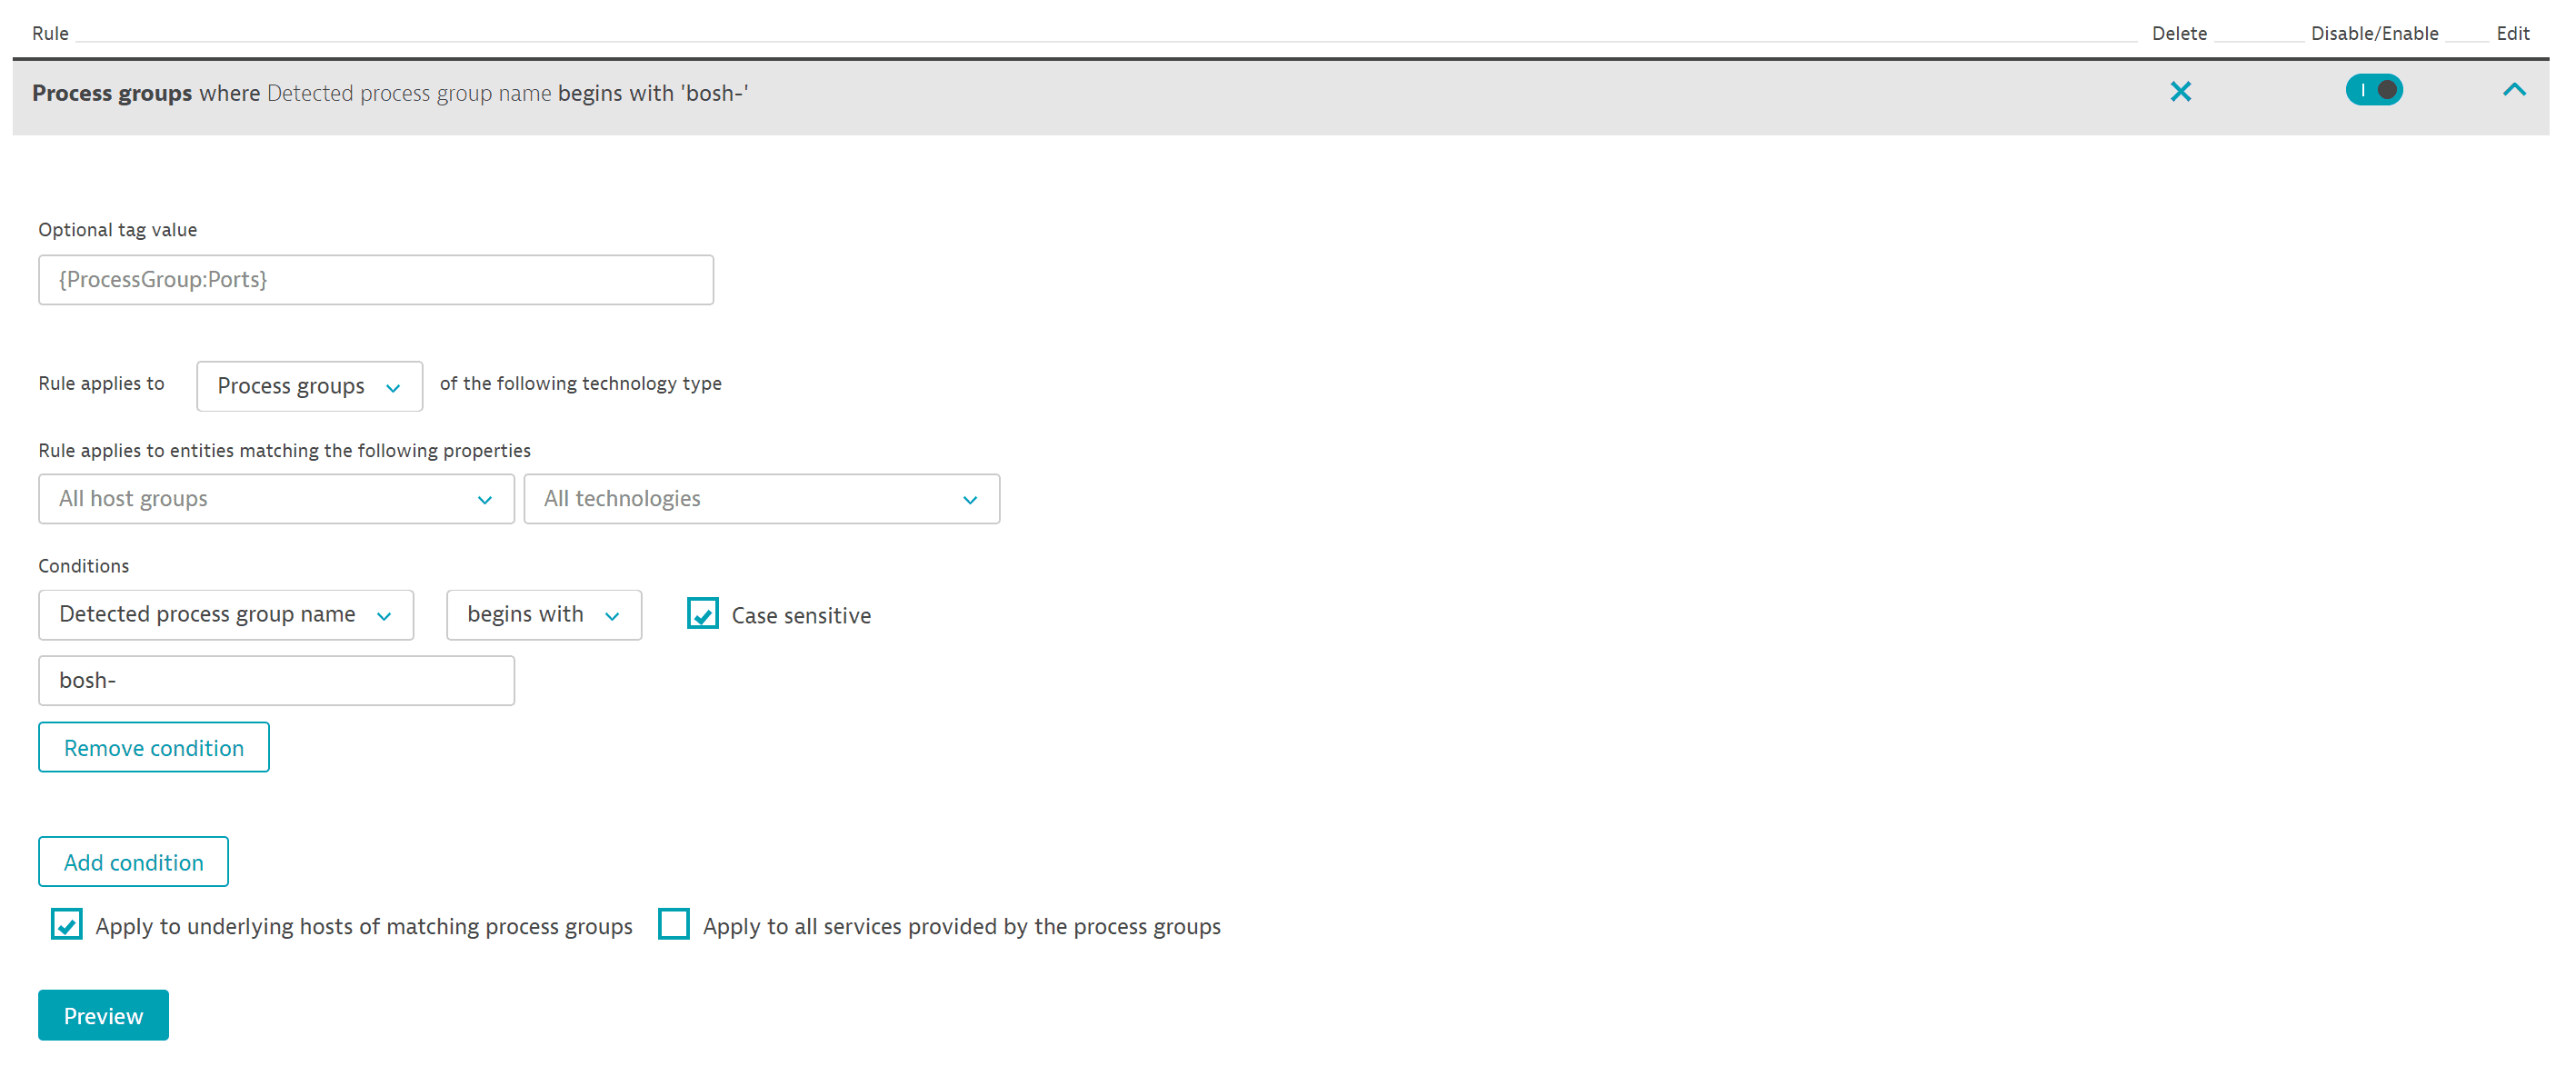
The image below shows a rule that tags specific process groups through the selection of the check box—thereby additionally applying the tag to the underlying hosts.
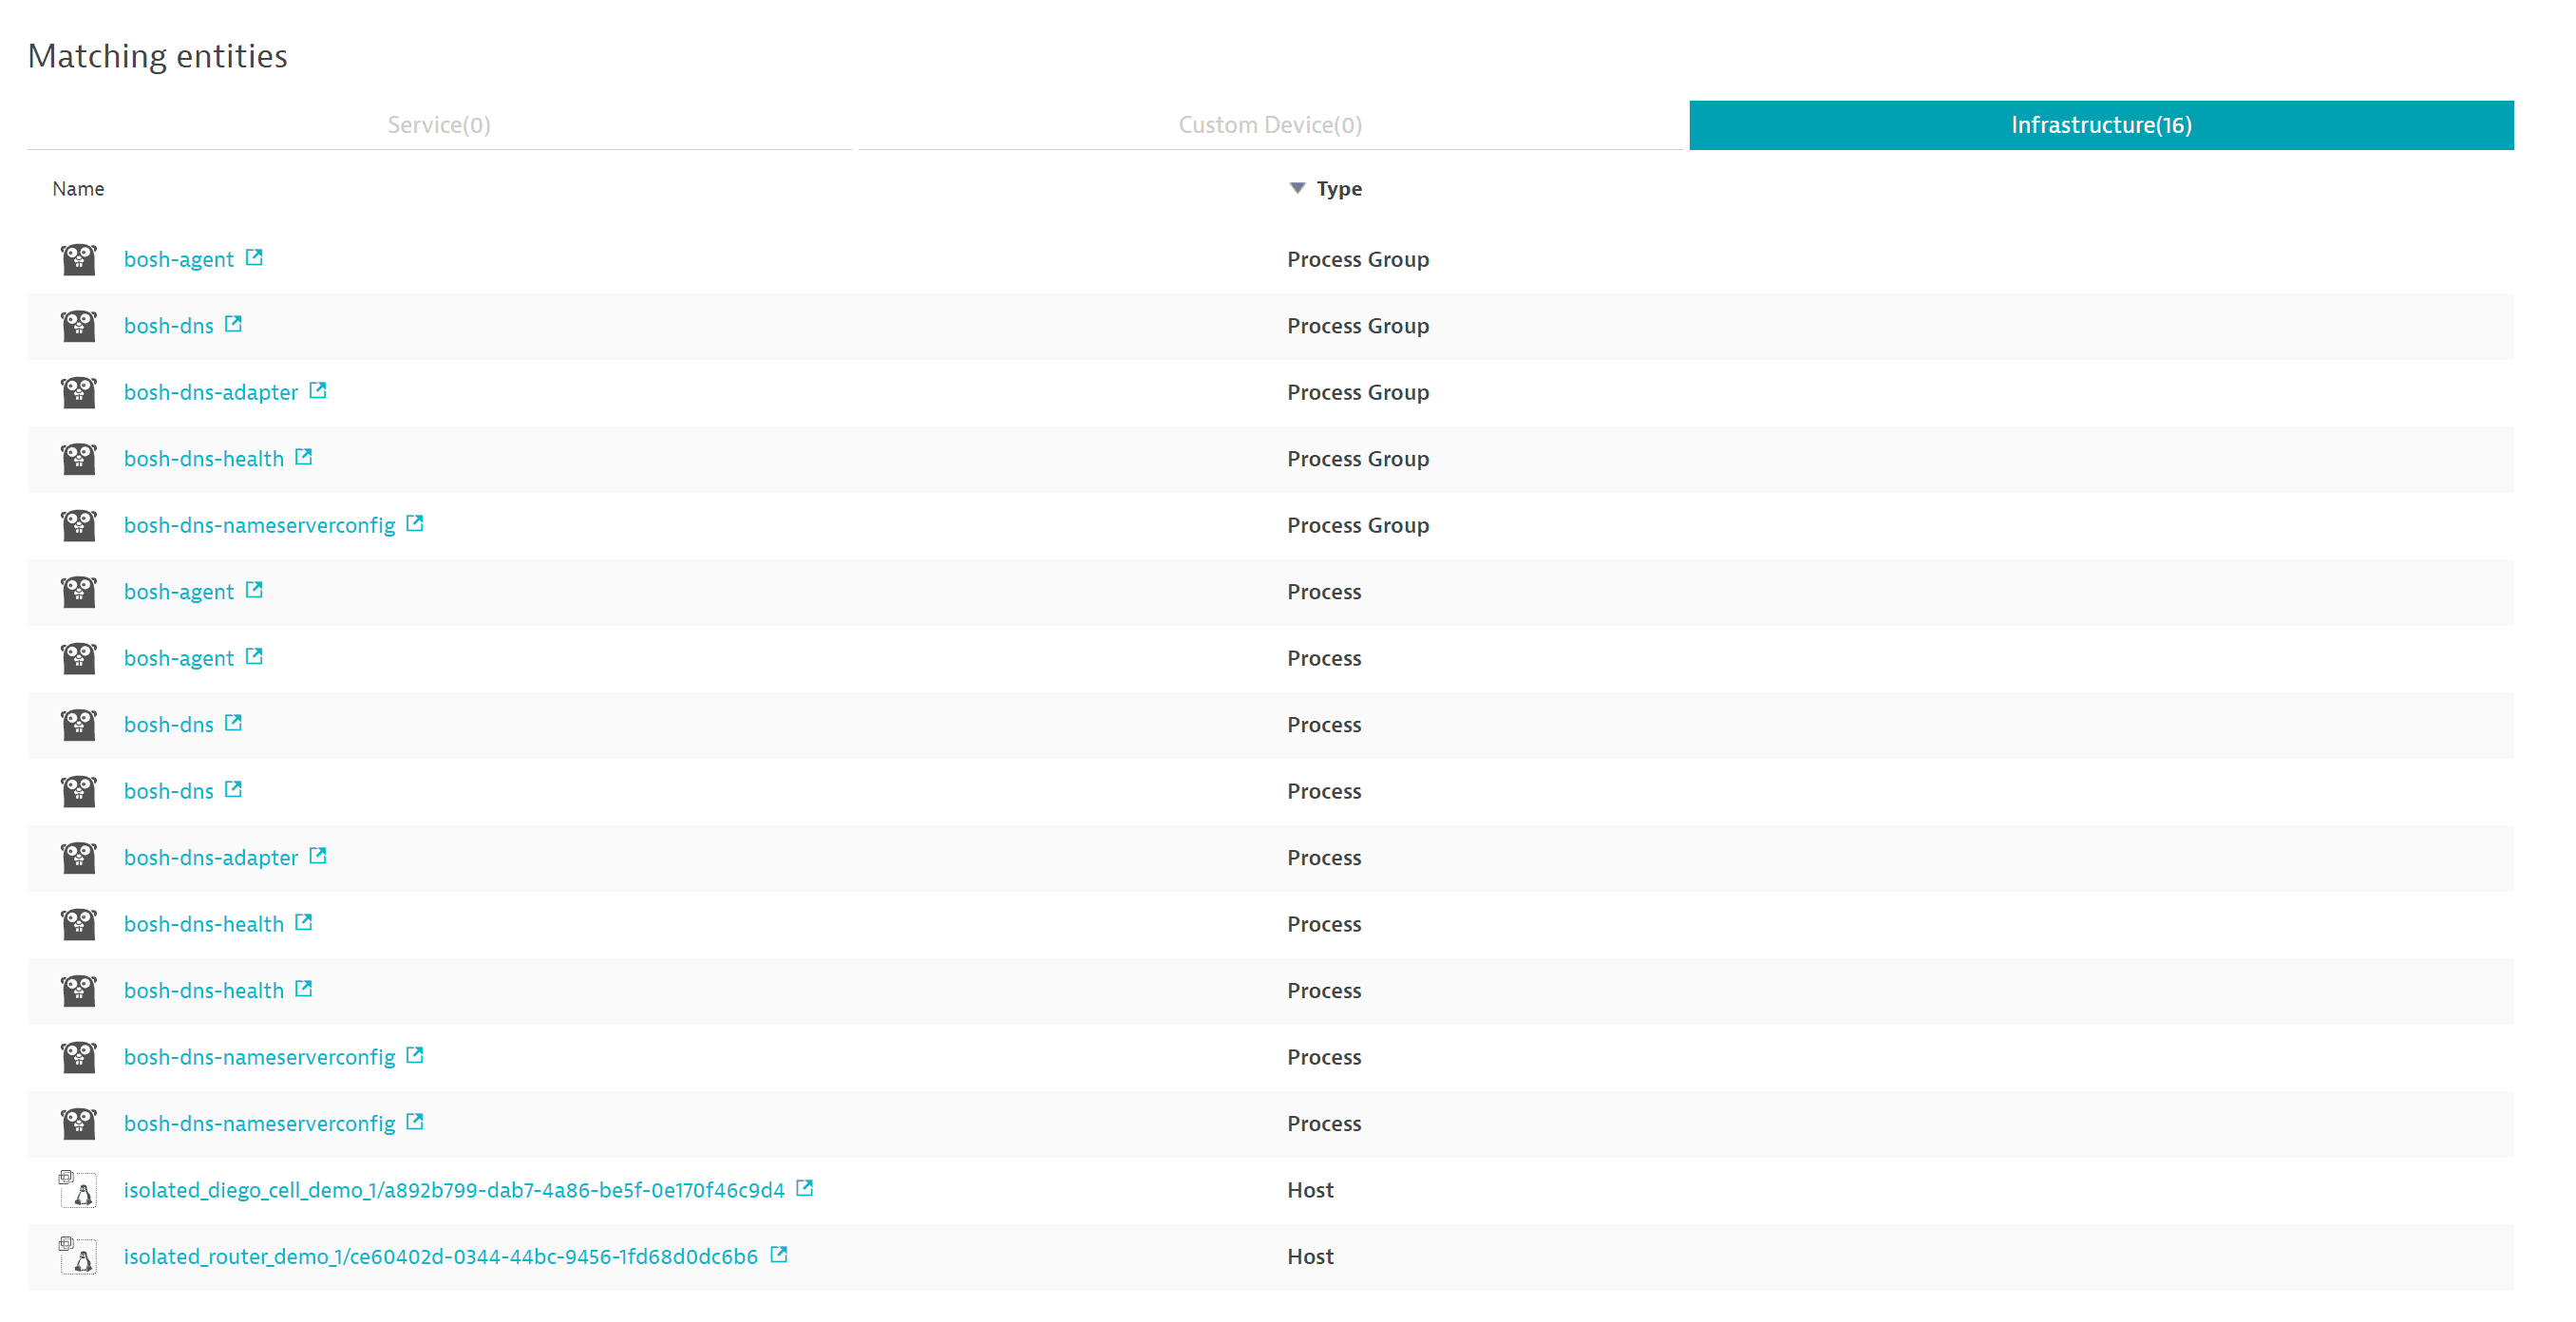
The Infrastructure tab includes the hosts to which the tag has been propagated (see image below).
Examples of how to use tags
Service, process group, and host tags can be leveraged in a number of ways. Two examples are detailed below.
Narrow down your analysis
You can use tags to narrow the focus of your analysis to a specific set of services.
- Go to
Services Classic.
- In the Filtered by box, select
Tagand then type and select a tag name. Repeat this for each tag you want to filter the table by.
Once you've selected a tagged group of related services, it's easy to focus your analysis on those services. For example:
- Filter the Services page by one or more tags.
- Select the Pin to dashboard button to add a health monitoring tile to a dashboard for the services matching the selected tags.
- From the dashboard, you can now:
- Watch the tile to monitor the selected services at a glance
- Select the tile to drill down to the Services page filtered by the tags you selected in step 1.
Ensure efficient routing of problem notifications
You can also use tags for efficient routing of problem notifications to responsible team members.
For example, assuming that you've defined a tag, TeamBoston, to tag all entities that this team is in charge of. To make sure the team members receive problem notifications
- Use this tag to define an alerting profile.
- Go to Settings and select Integration > Problem notifications.
- Select Set up notifications.
- Select the appropriate incident-management system or team-collaboration channel.
- Select the alerting profile (from step 1) from the Alerting profile list.
The next time a problem notification is sent out, Dynatrace will check to see if any affected services carry properties that you've defined in your service tags. When critical parts of your environment are affected by a detected problem, the related notification will be delivered to the appropriate teams.