Trace Lambda functions
- Dynatrace Classic
- How-to guide
- 8-min read
Dynatrace provides you with a dedicated AWS Lambda layer that contains the Dynatrace extension for AWS Lambda. You need to add the publicly available layer for your runtime and region to your function. Then, based on your configuration method, Dynatrace provides a template or configuration for your AWS Lambda function.
Capabilities
Dynatrace provides extensive Python, Node.js, Java, Go, and .NET monitoring capabilities:
- Automatic distributed tracing across AWS services such as API Gateway, SQS, SNS, EventBridge and seamless integration with other AWS services. For more details, refer to AWS Lambda integration.
- OpenTelemetry support for trace and metric ingestion.
- Native log ingestion from Lambda functions. Dynatrace supports log ingestion directly via the AWS Lambda Telemetry API, reducing dependency on CloudWatch. For more details, refer to AWS Lambda log collection.
- Cold start detection and optimization.
- Infrastructure-as-Code support (Terraform, AWS SAM, Serverless Framework).
See our supported technologies matrix for details on supported frameworks and runtimes for AWS supported runtimes.
Incoming invocations
For AWS Lambda invocations, Dynatrace offers generic support for all trigger types. OneAgent can capture specific information or connect the trace to any parent and therefore add additional information only for invocations made via:
- AWS SDK Lambda Invoke API
- API gateway
- Lambda function URL
- AWS SQS
- AWS SNS
- AWS Application Load Balancer
AWS EventBridge support for Go is not available in the initial release. Support will be added in a future update.
For other invocation types, OneAgent can't capture any specific information or connect the trace to any parent. Invocations via the AWS SDK require the client to be instrumented with Dynatrace to connect the trace.
Steps
Enable monitoring for AWS Lambda functions
To get started
- In Dynatrace Hub, select AWS Lambda.
- Select Set up.
- Follow the instructions to enable monitoring of AWS Lambda functions.
Choose a configuration method
Dynatrace OneAgent is distributed as a Lambda layer that can be enabled and configured manually or using well-known Infrastructure as Code (IaC) solutions.
The Lambda layer is stored in the Dynatrace AWS account 585768157899.
The wizard provides you with various configuration options and configuration snippets you can use in your deployment automation of choice.
Quick start vs. advanced configuration
Latest Dynatrace
This option is available only in the latest Dynatrace. For details, see Upgrade to the latest Dynatrace.
After you select your runtime, you have two different observability options:
-
Quick start
This is a fast onboarding option with minimal setup. You select only the architecture, region, and configuration method. You'll monitor your environment using distributed tracing. This setup is useful for using the basic AWS Lambda functions with standard monitoring needs.
-
Advanced configuration
You have a much richer selection of customization options. This setup is useful for teams that need detailed observability, more control, and customizations for complex environments or specific monitoring needs. It provides integration with other AWS services, such as CloudWatch and X-Ray.
Configure with JSON file
If you select this method, Dynatrace provides you with:
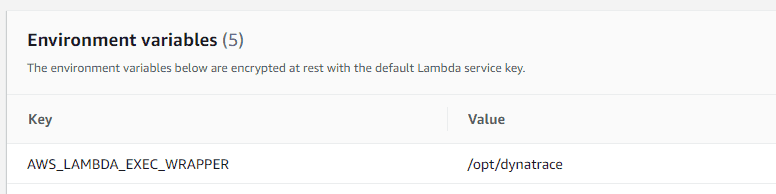
- An environment variable to add to your AWS Lambda function
- A JSON snippet that you need to copy into the
dtconfig.jsonfile in the root folder of your Lambda deployment - Lambda layer ARN
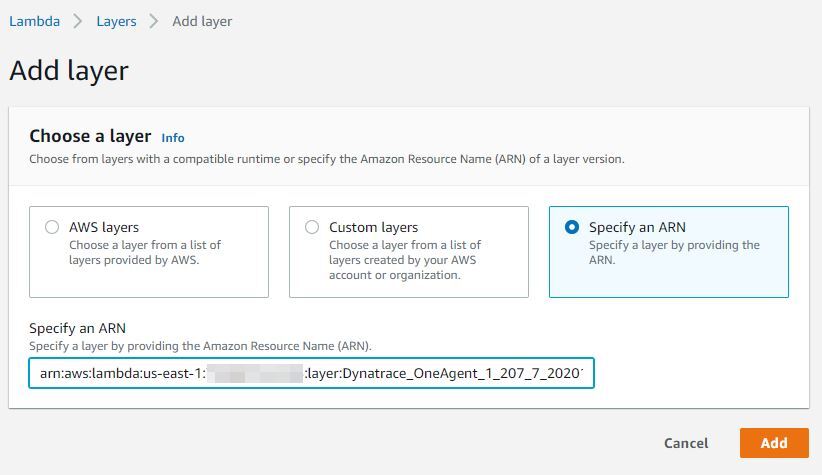
When using this method, make sure that you add the Dynatrace Lambda layer to your function. You can do this through the AWS console (Add layer > Specify an ARN and paste the ARN displayed on the deployment page) or by using an automated solution of your choice.
Enter environment variables via the AWS Console
Enter the Lambda layer ARN via the AWS Console
Configure with environment variables
Environment variables can be used for configuration, but we advise using the Secrets Manager as the recommended approach for fetching a security token. For more details, refer to Fetch token from AWS Secrets Manager.
When using this method, make sure that you add the Dynatrace Lambda layer to your function. The layer, as well as the environment variables, can be set either manually through the AWS console (Add layer > Specify an ARN and paste the ARN displayed on the deployment page) or by using an automated solution of your choice.
Client-side decryption of environment variables (Security in Transit) is not supported.
If you select this method, Dynatrace provides you with:
-
Values to define environment variables for the AWS Lambda functions that you want to monitor
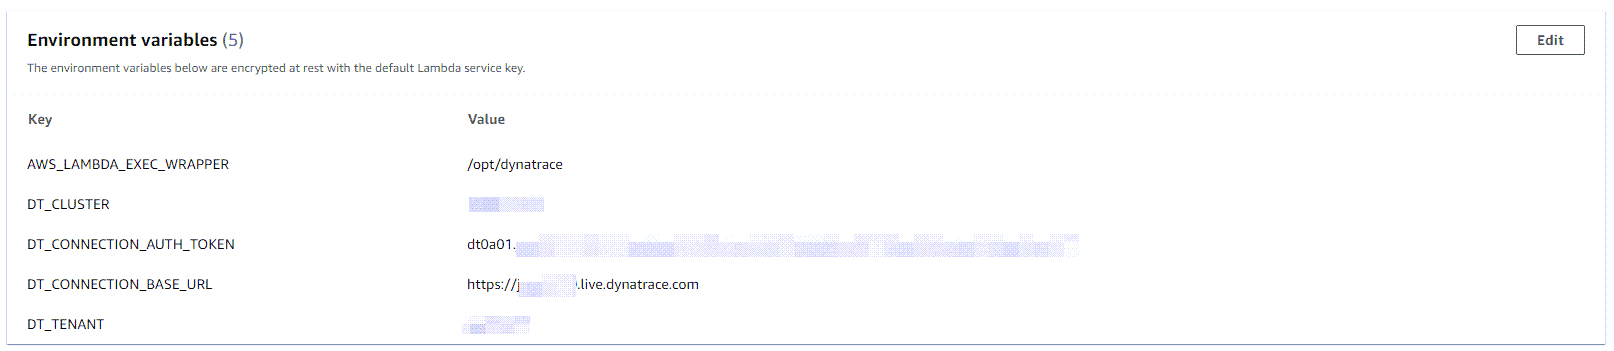 AWS Lambda environment variables
 -
Lambda layer ARN
Specify a layer by providing the ARN
Configure and deploy using Terraform
Terraform is a popular Infrastructure as Code (IaC) solution. If you select this method, Dynatrace provides you with:
- A template to define the AWS Lambda function. This includes all the configuration that you need to deploy and configure the Dynatrace AWS Lambda extension together with your functions.
- Lambda layer ARN
Configure and deploy using AWS SAM
The AWS Serverless Application Model (SAM) is an open-source framework for building serverless applications.
If you select this method, Dynatrace provides you with a template to define the AWS Lambda function. This includes all the configuration that you need to integrate the Dynatrace AWS Lambda extension.
Configure and deploy using the serverless framework
The Serverless Application option is a framework for deploying serverless stacks.
If you select this method, Dynatrace provides you with a template to define the AWS Lambda function. This includes all the configuration that you need to integrate the Dynatrace AWS Lambda extension.
Configure and deploy using AWS CloudFormation
AWS CloudFormation is an IaC solution that enables provisioning of a wide range of AWS services.
If you select this method, Dynatrace provides you with a template to define the AWS Lambda function. This includes all the configuration that you need to integrate the Dynatrace AWS Lambda extension.
Specify a Dynatrace API endpoint
Optional
This is an optional step that enables you to specify a Dynatrace API endpoint to which monitoring data will be sent.
The typical scenario is to deploy a Dynatrace ActiveGate in close proximity (same region) to the Lambda functions that you want to monitor in order to reduce network latency, which can impact the execution and cold start time of your Lambda functions for (usually one) network request by OneAgent per Lambda invocation (which happens at the end of the invocation). See #monitoring-overhead section for typical overhead numbers.
Enable Real User Monitoring
Optional
This is an optional step to use Real User Monitoring (RUM), which provides you with deep insights into user actions and performance via the browser or in mobile apps.
Configure the AWS API Gateway
-
If inbound (non-XHR) requests to your Lambda functions are not connected to the calling application, configure the API Gateway to pass through the Dynatrace tag. To do this, enable Use Lambda Proxy Integration on the Integration Request configuration page of the API Gateway.
-
If the API Gateway is configured from the Lambda configuration page, this setting will be enabled by default. For more information, see Enable CORS on a resource using the API Gateway console.
AWS Lambda also supports non-proxy integration, which—without some additional configuration—prevents Dynatrace from
- Tracing calls from other monitored applications
- RUM detection (web and mobile)
To make tracing calls from other monitored applications/RUM detection work in this scenario, create a custom mapping template in the integration requests configuration.
-
In the AWS API Gateway Console, go to Resources and select a request method (for example, GET).
-
Select Mapping Templates and then select Add mapping template.
-
Add the following content to the template:
{"path": "$context.path","httpMethod": "$context.httpMethod","headers": {#foreach($param in ["x-dynatrace", "traceparent", "tracestate", "x-dtc", "referer", "host", "x-forwarded-proto", "x-forwarded-for", "x-forwarded-port"])"$param": "$util.escapeJavaScript($input.params().header.get($param))"#if($foreach.hasNext),#end#end },"requestContext": {"stage": "$context.stage"}}The
x-dtcheader is specific to tracing RUM scenarios, whereas the remaining headers are generally needed to link traces together and extract relevant information, such as web request metadata. -
Select Save to save your configuration.
-
Redeploy your API.
Configure AWS
Make sure the x-dtc header is allowed in the CORS settings of your monitored Lambda functions.
RUM for Lambda functions requires a specific header (x-dtc) to be sent with XHR calls to AWS. To enable it, the CORS settings of your AWS deployment must allow the x-dtc header during preflight (OPTIONS) requests. To configure CORS and allow the x-dtc header for your specific setup, see Enable CORS on a resource using the API Gateway console in AWS documentation.
Configure Dynatrace
To configure the x-dtc header for calls to your Lambda functions
- Go to Web, Mobile, Frontend, or Custom Applications, depending on your application type.
- Select the application you want to connect with your Lambda function.
- Select the browse menu (…) in the upper-right corner and select Edit.
- Select Capturing > Async web requests and SPAs.
- Make sure that your framework of choice is enabled. If your framework is not listed, enable Capture XmlHttpRequest (XHR) for generic support of
XHR. - Select Capturing > Advanced setup.
- Scroll down to the Enable Real User Monitoring for cross-origin XHR calls section and enter a pattern that matches the URL to your Lambda functions. For example:
TheAwsUniqueId.execute-api.us-east-1.amazonaws.com - Select Save. After a few minutes, the header will be attached to all calls to your Lambda function and requests from your browser will be linked to the backend.
If requests start failing after enabling this option, review your CORS settings. To learn how to configure CORS, see Enable CORS on a resource using the API Gateway console in AWS documentation.
Deployment
Copy the configuration snippets into your deployment and use your deployment method of choice to enable the layer and set the configuration for your Lambda functions.
Configuration options
Fetch token from AWS Secrets Manager
OneAgent version 1.295+
Instead of specifying the authentication token explicitly in the configuration, you can configure OneAgent to fetch a token stored in AWS Secrets Manager.
Prerequisites
- Make sure you granted the
secretsmanager:GetSecretValuepermission for the authentication token secret ARN to the Lambda function monitored by OneAgent. For details, see Authentication and access control for AWS Secrets Manager in the AWS Secrets Manager documentation. - Make sure the secret value contains only the plaintext authentication token value (without quotes). Note that
- Secrets with JSON structure are not supported. For details, see Create an AWS Secrets Manager secret in the AWS Secrets Manager documentation.
- When you retrieve the secret value, Secrets Manager returns by default only the current secret version (
AWSCURRENTlabel). For details, see What's in a Secrets Manager secret? in the AWS Secrets Manager documentation.
To fetch the token for a tracing connection, set the token secret ARN either to the environment variable DT_CONNECTION_AUTH_TOKEN_SECRETS_MANAGER_ARN or the JSON property Connection.AuthTokenSecretsManagerArn.
This option always overrides DT_CONNECTION_AUTH_TOKEN (Connection.AuthToken). If the fetch fails, OneAgent won't be able to export trace data.
A fetch accesses AWS Secrets Manager only once, during the Lambda function's initialization phase; this causes an increase of the Lambda function's cold start duration.
For details on fetching the token for log collection, refer to Fetch token from AWS Secrets Manager.
Enforce Lambda layer signature verification
OneAgent version 1.341+
Dynatrace Lambda layers run as extensions inside the function's execution environment. If your organization enforces code signing as part of your supply chain security posture, you can use this mechanism to cryptographically verify layer authenticity before deployment.
AWS Lambda code signing ensures that only code from trusted publishers can be deployed to Lambda functions. When code signing is enabled, AWS validates that every layer and code package attached to a function is signed by a signing profile you explicitly allow. Deployments that fail this check are rejected before execution.
Dynatrace signs publicly distributed Lambda layers with AWS Signer. If your Lambda functions enforce code signing, add the Dynatrace signing profile to your function's Code Signing Configuration so that Dynatrace layers are accepted during deployment.
The Dynatrace deployment wizard provides the AWS CLI commands to retrieve the signing profile, create a code signing configuration, and attach it to your Lambda function.
A code signing configuration enforces signing only on deployments made after it is attached. Existing layers and code on a function continue to run; the next deployment of unsigned or untrusted code is rejected with CodeSigningConfigAccessDeniedException.
Dynatrace Lambda layers are signed in all regions that support AWS Signer. Classic OneAgent Lambda layers are not signed. The deployment wizard hides this option for regions where AWS Signer is not available and for Lambda functions monitored via classic AWS Lambda integration.
Monitoring overhead
Enabling monitoring unavoidably induces overhead to the monitored function execution. Overhead depends on several factors, such as function runtime technology, configuration, and concrete function characteristics such as code size or execution duration and complexity.
The amount of memory configured for a function directly impacts the compute resources assigned to the function instance. For more details, see Memory and computing power.
The worst-case scenario on measured overhead is a function with an empty function handler and minimum memory configuration.
Cold start overhead
- For Node.js, cold start overhead is about 900 ms.
- For Java, cold start overhead is about 1,500 ms.
- For Python, cold start overhead is about 1,000 ms.
- For Go, cold start overhead is about 600 ms.
- For .NET, cold start overhead is approximately 5,000 ms.
For the cold start benchmarking process, hello-world functions (only returning a response) were tested with 512 MB of allocated memory. It is important to note that the observed overhead may vary based on a few factors:
-
Configured memory: A Lambda function is allocated CPU proportional to the memory configured which can influence its cold start performance. Functions with higher memory allocations typically exhibit faster initialization times due to the increased CPU allocation.
-
Function implementation: The complexity of the actual function implementation—including external dependencies, initialization logic, and the runtime environment—can significantly impact the cold start duration.
-
Runtime version: The specific runtime version or container image used can also influence cold start times.
When conducting performance evaluations, we recommend considering these factors, as they may affect the benchmarking results in real-world scenarios.
Response time latency
Latency depends on the function implementation, but is typically less than 10%. This means that the time it takes until the caller of a Lambda function receives a response might increase by 10% when the OneAgent layer is added, compared to when OneAgent is not active/present.
Code space overhead
The following table contains uncompressed layer sizes.
| Runtime | Code space | Code space with log collector included |
|---|---|---|
Node.js | ~23 MB | ~32 MB |
Java | ~25 MB | ~32 MB |
Python | ~16 MB | ~24 MB |
Go | ~25 MB | ~28 MB |
.NET | ~35 MB | ~44 MB |
Dynatrace AWS integration
While not mandatory, we recommend that you set up Dynatrace Amazon CloudWatch integration. This allows data ingested via AWS integration to be seamlessly combined with the data collected by the Dynatrace AWS Lambda extension.
For more details, refer to Amazon CloudWatch Metric Streams.
Filter cold starts
One of the important metrics for Lambda is the frequency of cold starts. A cold start happens when a new instance of a Lambda function is invoked. Such cold starts take longer and add latency to your requests.
A high cold-start frequency can indicate errors or an uneven load pattern that can be mitigated using provisioned concurrency. Dynatrace reports such cold starts as a property on the distributed trace.
To analyze cold starts
- Select View all requests on the Lambda service details page.
- In the request filter, select Function cold start in the Request property section.
- Filter by invocations containing Only cold start or No cold start.
Known limitations
General limitations
-
HTTP connect timeouts, flush timeouts, and backoff thresholds are not configurable.
-
OneAgent running on AWS Lambda does not support functionalities that require OneAgent reconfiguration through the server-side user interface.
-
OneAgent for AWS Lambda uses only local settings defined via environment variables or config files, instead of pulling configuration from the Dynatrace cluster. As a result, any settings defined at the cluster level are ignored, and defaults apply unless explicitly overridden.
-
Most Dynatrace AWS Lambda extensions don't capture IP addresses of outgoing HTTP requests. This results in unmonitored hosts if the called service isn't monitored with Dynatrace.
-
AWS Lambda Managed Instances deployment mode is not supported. This new hosting option allows deploying Lambda functions on AWS-managed EC2 instance clusters. The Dynatrace Lambda extension and code module layers currently do not support this deployment mode.
.NET limitations
OneAgent version 1.335+
-
Supported runtimes: .NET 8 and .NET 10.
-
The following sensors are supported:
Sensor Minimum supported version Minimum OneAgent version HttpClient
—
1.335+
Amazon AWS SDK
3.5.0+
1.335+
Amazon AWS Lambda SDK
3.5.0+
1.335+
Amazon EventBridge
3.5.0+
1.335+
Amazon SNS
3.5.0+
1.335+
Amazon SQS
3.5.0+
1.335+
Amazon DynamoDB
3.5.0+
1.335+
ADO.NET
—
1.335+
Serilog (structured log enrichment)
2.9+
1.335+
log4net (structured log enrichment)
2.0.6+
1.335+
gRPC
2.23.2+
1.337+
IBM MQ
8.0+
1.337+
Kafka
1.4.0+
1.337+
MongoDB
2.3+
1.337+
OpenTelemetry
1.0.1+
1.337+
Azure Cosmos DB
3.18+
1.337+
Redis (StackExchange.Redis)
2.0.0+
1.337+
-
Once injection is complete, the .NET runtime retains both the original assemblies and the instrumented versions in memory. This is a known Microsoft .NET limitation that cannot be mitigated by Dynatrace OneAgent, resulting in approximately 75 MB of additional memory overhead for .NET Lambdas.
-
ASP.NET Core, code-level attack and vulnerability evaluation, and several metrics are not supported within AWS Lambda.
Node.js limitations
-
aws-sdktracing support is available for CommonJS only. ECMAScript Lambda deployments will not have AWS-SDK tracing available. -
You must enable monitoring for ESM Lambda functions. This feature is currently
opt-in. To enable ESM Support for incoming AWS Lambda invocations, set theDT_ENABLE_ESM_LOADERSenvironment variable totrue. Enabling ESM support increases memory consumption. -
Node.js handlers from bundlers (for example, esbuild or vite) might not be visible to OneAgent because of the modified export structure through the bundling process.
How to enable auto-instrumentation for Node.js handlers bundled via a bundler
You can use a simple wrapper script to enable auto-instrumentation.
Here's a sample AWS Lambda handler written in TypeScript (
index.ts):import { Context, APIGatewayProxyResult, APIGatewayEvent } from 'aws-lambda';export const handler = async (event: APIGatewayEvent, context: Context): Promise<APIGatewayProxyResult> => {console.log(`Event: ${JSON.stringify(event, null, 2)}`);console.log(`Context: ${JSON.stringify(context, null, 2)}`);return {statusCode: 200,body: JSON.stringify({message: 'hello world',}),};};-
Bundle the function code using the bundler of your choice.
-
If this results in code that cannot be automatically instrumented by OneAgent, create a wrapper file (for example,
handler_wrap.mjs) to expose the handler in a way that OneAgent can instrument.For ESM Lambda deployments:
// handler_wrap.mjsexport { handler } from "./index.mjs";For CommonJS Lambda deployments:
const bundleDist = require("./dist/index");exports.handler = bundleDist.handler; -
In your AWS Lambda runtime configuration, set the handler to
handler_wrap.handler.
OneAgent will now be able to detect and instrument the function correctly. Using a bundler introduces additional limitations on the visibility of dependencies. For details, see OneAgent Node.js known limitations.
-
Go limitations
General limitations:
-
Go applications for AWS Lambda must be built with dynamic linking enabled. To enable dynamic linking, set
CGO_ENABLED=1and use the system linker.Example
CGO_ENABLED=1go build -ldflags '-linkmode=external' -o myapp main.go -
Go applications do not require a special runtime. The OS-only runtime is used.
Go 1.xruntime is deprecated and not supported.
Versioning limitations
-
Go support for AWS Lambda requires OneAgent version 1.333+. It is not backwards-compatible with older OneAgent versions.
-
External metadata support for Go in AWS Lambda is not supported. As a result, third-party library versions or newly released Go versions are not automatically supported. New version support is shipped with the usual OneAgent release cycle and requires OneAgent to be updated to take effect.
-
AWS-Lambda-Go SDK v1.18.0+ is required for Go applications.
Deployment limitations
-
Deployment is possible through a container image or ZIP file. In both cases, dynamic linking must be enabled.
ZIP file archive
The archive must contain the binary, and the application must be linked against glibc v2.34 or older. Since statically linked applications are not supported, linking against such an old version of glibc requires building in Ubuntu 20.04 or older.
Container image
The application must be compiled with a matching glibc version. Both AWS base images and non-AWS base images are supported.
-
To set the path to the OneAgent library, use the
LD_PRELOADenvironment variable.LD_PRELOAD=/opt/dynatrace_layer/agent/lib64/liboneagentproc.so
Dynatrace Managed limitations
- Managed offline clusters are not supported.