Dynatrace Managed license management
- Published Feb 01, 2022
A Dynatrace Managed deployment can have several clusters, each with its own license, and each license controls the products you can use (products may include host units, host unit hours, Digital Experience Monitoring, Davis data units, and Application security units). Account Management provides a view of license usage across clusters (Total license usage) and hourly/daily usage information for each cluster (Usage details).
This page is provided for informational purposes only. The terms of the Dynatrace free trial offer and/or your Dynatrace license will be applied to any use of Dynatrace products or services. For more information, see Dynatrace classic licensing.
Total license usage
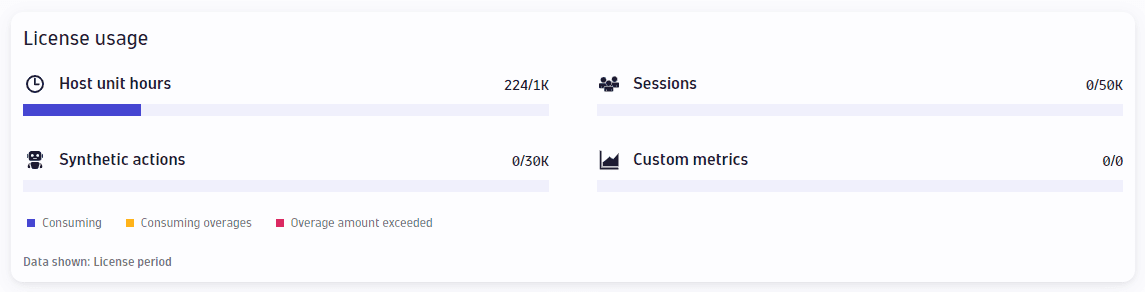
Total license usage shows real-time information on how your license is being consumed.
A selector allows you to select and view license usage for each cluster license. The All option can aggregate license usage across all clusters.
-
Each licensed product is shown as a separate infographic, indicating how much of each product you have used.
-
The product infographics indicate license quota usage as a number (for example, 100 / 1k) and as a percent used.
The product infographics use color to indicate status:
- Blue indicates that your usage is below your quota
- Yellow means you have exceeded your quota and you are now incurring overages (if allowed)
- Red indicates that your maximum quota has been reached and monitoring is disabled
Hover over a product infographic to display a detailed breakdown of usage.
The Total environment usage table provides a textual view of license usage by environment and product.
Usage details
Use the Usage details charting to explore the historical consumption of your license by selecting the appropriate Cluster, Product, Resolution, and Timeframe options.
Resolution allows you to view consumption data in different ways:
Daily– provides day-by-day total usageHourly– view hourly cumulative totals for a selected dayTotal– view cumulative usage for consumption-based licenses (host unit hours, Digital Experience Monitoring, Davis data units, Application security units)Linear forecast– view forecast usage based on linear extrapolation from the last 30 days of usage data (Digital Experience Monitoring and Davis data units only).Seasonal forecast– view total forecast usage based on a seasonal forecast from the last 365d of data (Digital Experience Monitoring and Davis data units only).
Changing chart options updates the Cluster usage breakdown table in the chart below. The table represents total consumption by cluster, based on cluster, product, and timeframe selections.
Select  Export data to download charted data as a CSV format file, which can be helpful for additional tabular reports and aggregation.
FAQ
Why does Consumption usage details not match total license usage?
- License usage provides an accurate and real-time measurement of how much license has been consumed, and differentiates between free, paid, and overage usage.
- Consumption usage details provides a historic breakdown of total consumption that includes paid, free, and overage units, and therefore may not match the license usage.
When should I use Linear vs. seasonal forecast?
- If you are a new customer, you may have to rely on the linear model until you have a full year of consumption history to predict a better model. The linear model is also accurate if your past 30 days of usage are more indicative of your future usage.
- If your business is more seasonal (for example, retail spikes during holiday periods) and you have a year or more of consumption data, the seasonal model can provide a better estimate of future use.