What's a monitoring environment?
- Explanation
- 4-min read
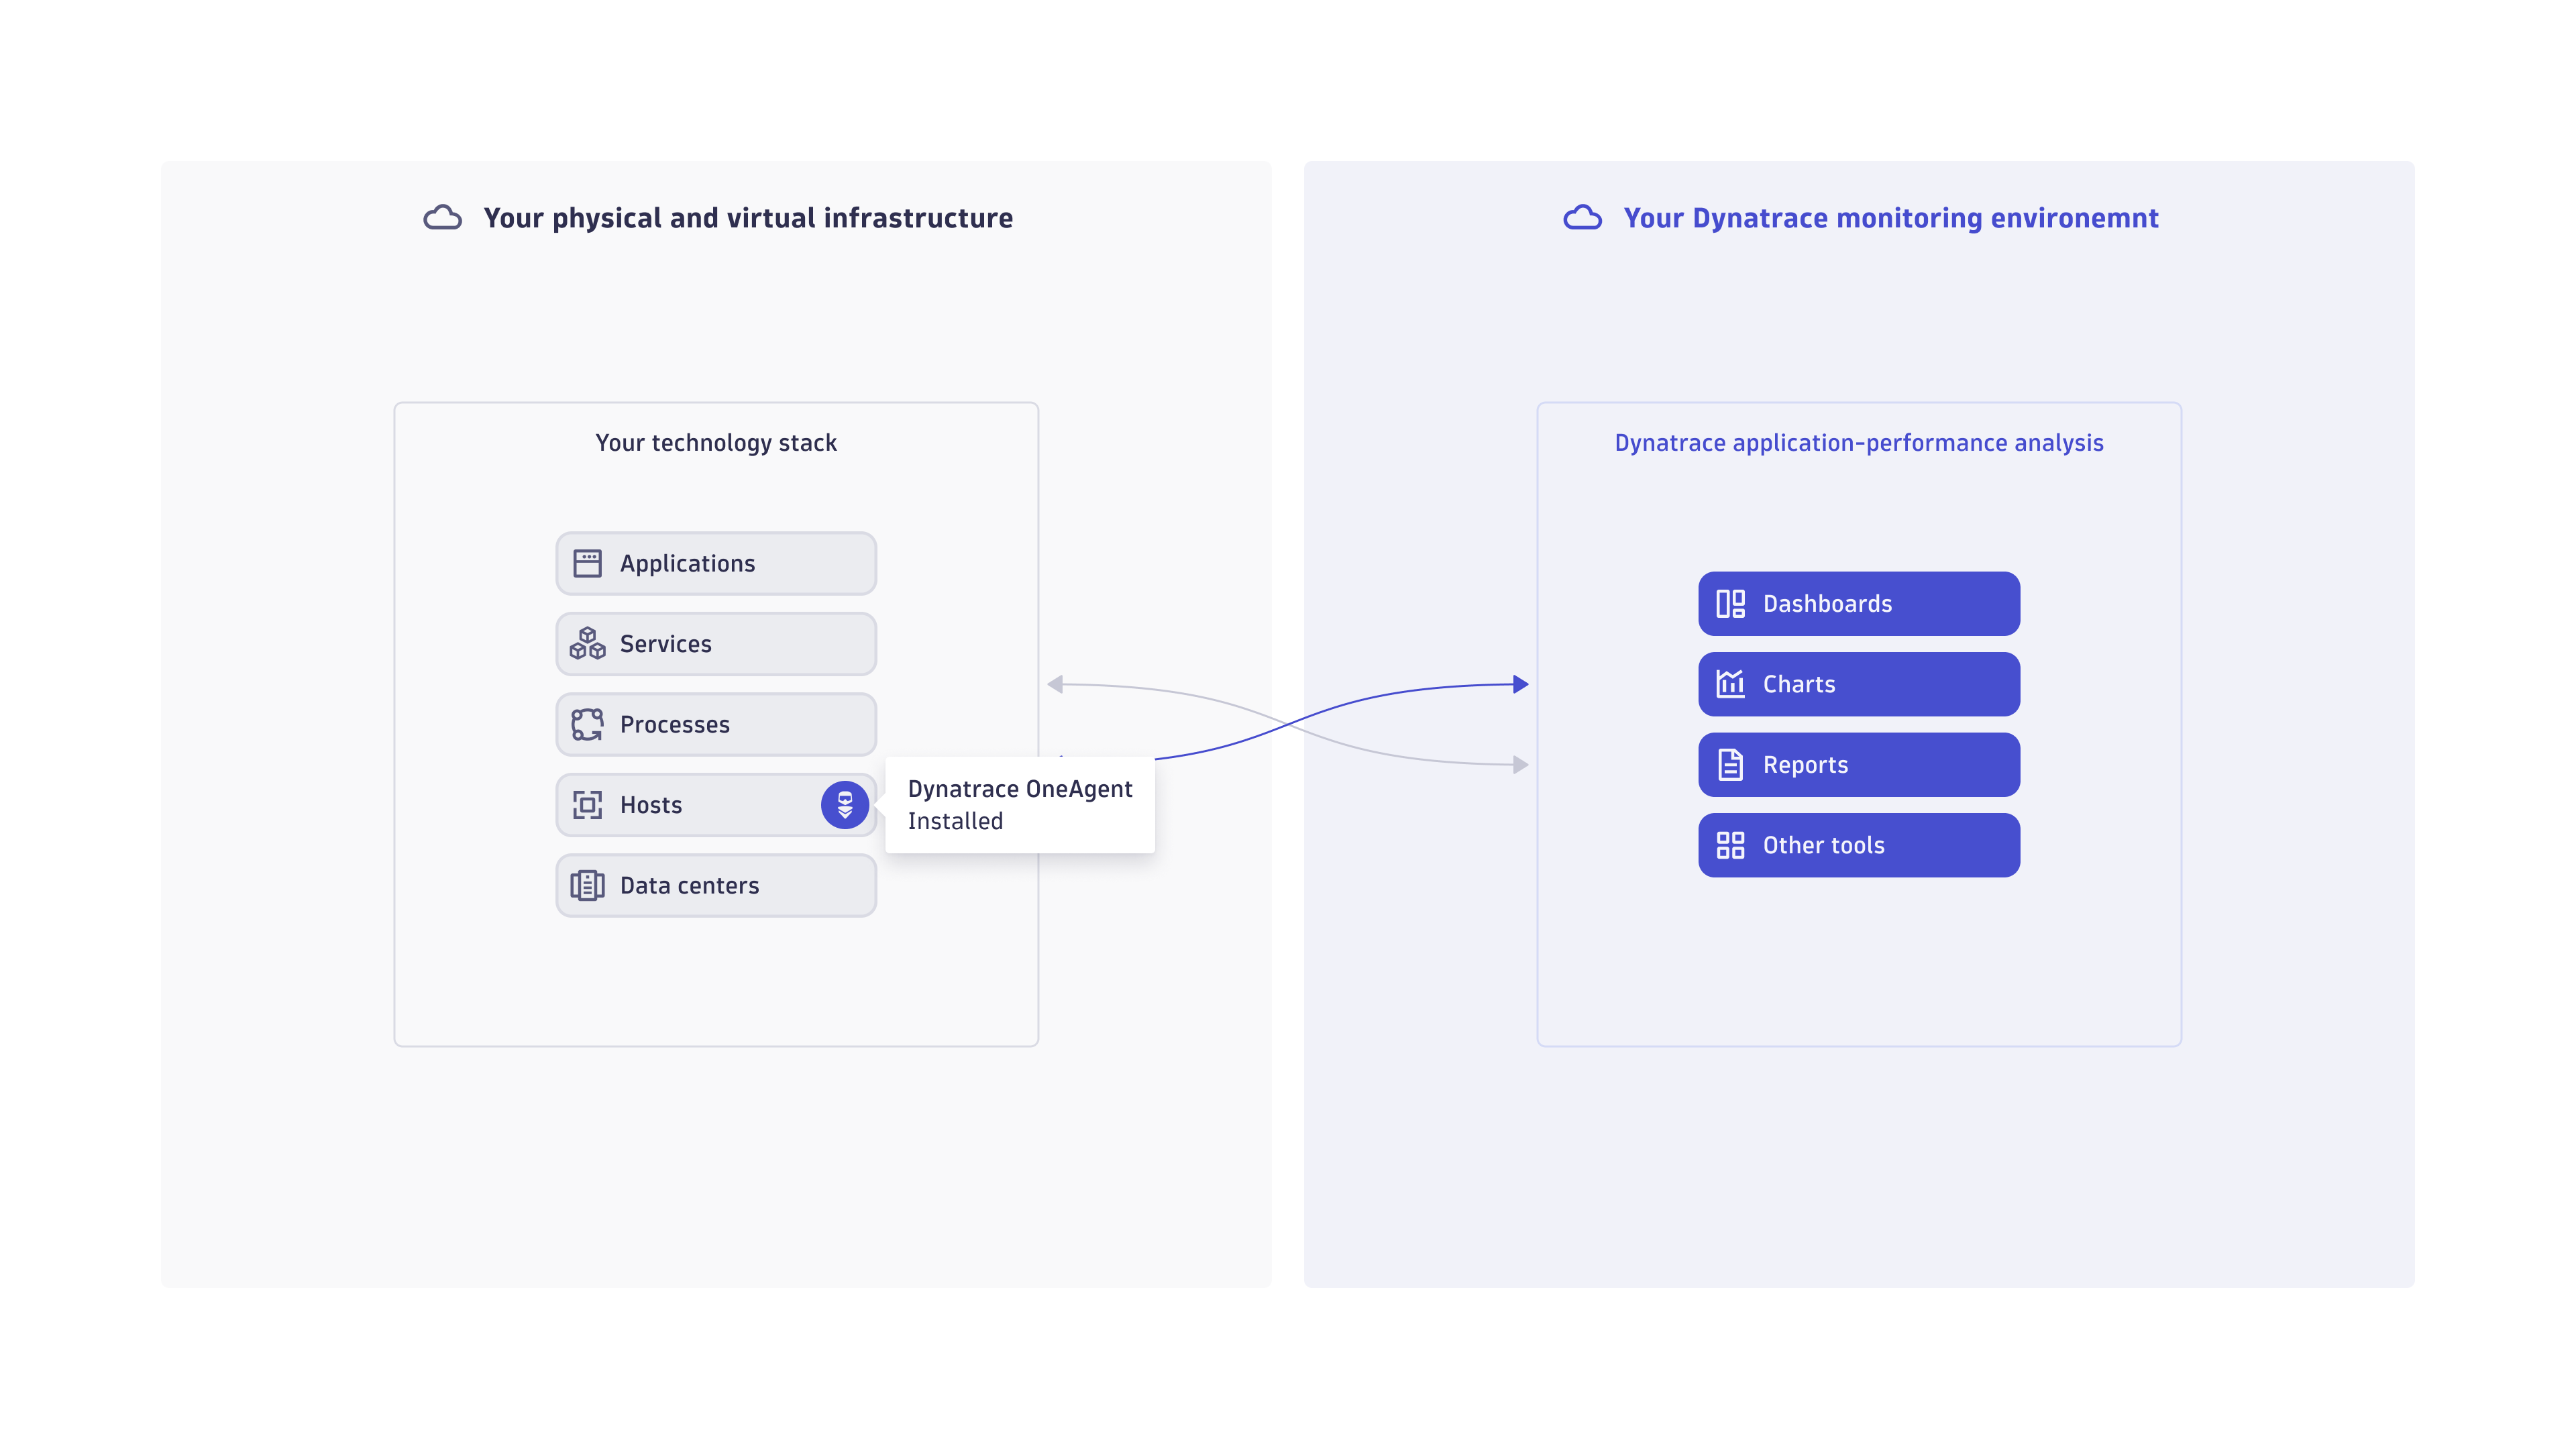
Your Dynatrace monitoring environment is where all your Dynatrace performance analysis takes place. Dynatrace OneAgent sends all captured monitoring data to your monitoring environment for analysis. A monitoring environment is analogous to an analysis server that provides all Dynatrace application-performance analysis functionality, including all dashboards, charts, reports, and other tools.
Monitoring environment location
Your monitoring environment location depends on your deployment type.
| Deployment type | Monitoring environment location |
|---|---|
Dynatrace Managed | In your own data center |
Dynatrace for Government | In cloud with FedRAMP moderate authorization |
Environment identifier
All external access to your Dynatrace monitoring environment relies on two credential types: an environment ID and an access token.
Each environment has a unique character string as its identifier—the environment ID. The Dynatrace application programming interface (API) uses environment IDs to pull monitoring data from and push relevant external events to the correct Dynatrace environments.
In Dynatrace Managed and in Dynatrace for Government, your environment ID is the string after /e/ in your Dynatrace environment address:
https://{your-domain}/e/{your-environment-id}/
For example, for the address https://managed-cluster/e/abc123a, the environment ID is abc123a.
Multiple monitoring environments
You can set up separate monitoring environments with a single Dynatrace Managed cluster.
When you set up multiple monitoring environments:
- Each monitoring environment shares the same user base and other account settings.
- Each monitoring environment stores its data in isolation from other environments.
- You can switch between monitoring views to track the performance and availability of each environment.
Use cases
Common reasons to create separate monitoring environments:
- Monitor your organization's development, staging, and production environments in isolation.
- Maintain a separate monitoring environment for each of your organization's data centers.
Set up multiple monitoring environments
How you set up different monitoring environments depends on whether you use Dynatrace Managed or Dynatrace for Government.
| Deployment type | How to set up different monitoring environments |
|---|---|
Dynatrace Managed | You can use the Cluster Management Console. For details, see Manage your monitoring environments. |
Dynatrace for Government | Contact your Dynatrace representative. |
Connect multiple environments
With multiple environments, Dynatrace keeps monitoring data isolated by design. Environments don't automatically share information with each other.
In some scenarios, however, you might need to connect your environments. For example:
- To trace calls between services monitored in different Dynatrace environments, you can configure cross-environment tracing. For details, see Set up cross-environment tracing in Distributed Traces.
- To display metrics from remote environments on your local environment's dashboards, you can set up cross-environment dashboard tiles. For details, see Create multi-environment dashboards.