Serverless monitoring
- 3-min read
The term serverless defines cloud services that share common characteristics:
- Abstracted from underlying infrastructure management
- Highly available and scaling elastically with your needs
- Billed on a pay-per-use (consumption) model
While often used as a synonym for Functions-As-A-Service (FaaS), serverless cloud services span all sorts of services. The three most important categories are:
- Serverless compute, including functions and containers, and managed Kubernetes
- Serverless PaaS such as API gateways, messaging systems, or queues
- Serverless databases and caches
Observability challenges
The nature of serverless technologies creates some challenges for the effective observability of such cloud services:
- Distributed, which makes distributed tracing a critical capability.
- Sandboxed environments, with limited capabilities to modify.
- Many different ways to capture telemetry.
- Limitations of cloud provider native monitoring services
- Gaining an understanding of system behavior can be difficult, as many data sources spread telemetry across multiple places.
- Obtaining an end-to-end view can be difficult, especially when using hybrid or multi-cloud and third-party applications.
- Limited capabilities, missing critical capabilities such as real user monitoring, or profiling requiring additional tools.
- New problem patterns:
- Cold start behavior
- Cloud service provisioning optimizations
- Complex service limits and quotas
- Transient faults
Serverless observability with Dynatrace
Dynatrace integrates with the three major public cloud providers to capture metrics, metadata, events, logs, and traces. It unifies these data sources to provide end-to-end visibility and Davis AI-powered analysis.
With over 600+ integrations, extensions, and technology-specific support, Dynatrace provides extensive monitoring support, including your serverless technologies running on Amazon Web Services (AWS), Azure, or Google Cloud.
Getting started with serverless monitoring
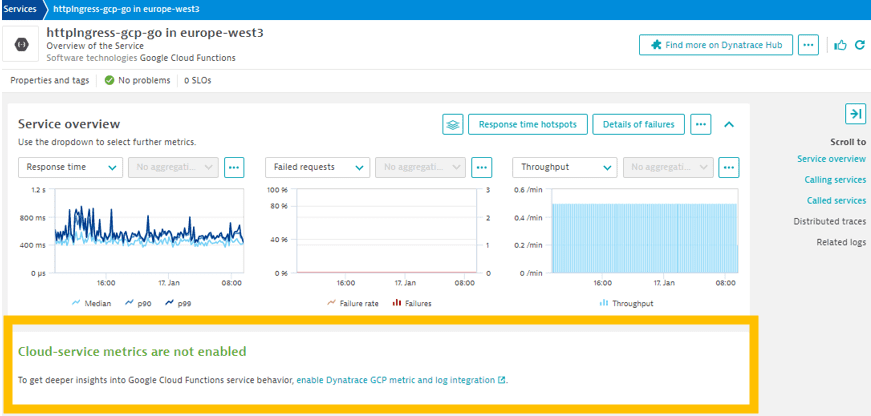
 Turn on cloud service monitoring
With a single integration per cloud vendor, Dynatrace automatically discovers your cloud services and monitors the services to provide you with out-of-the-box service health and availability monitoring:
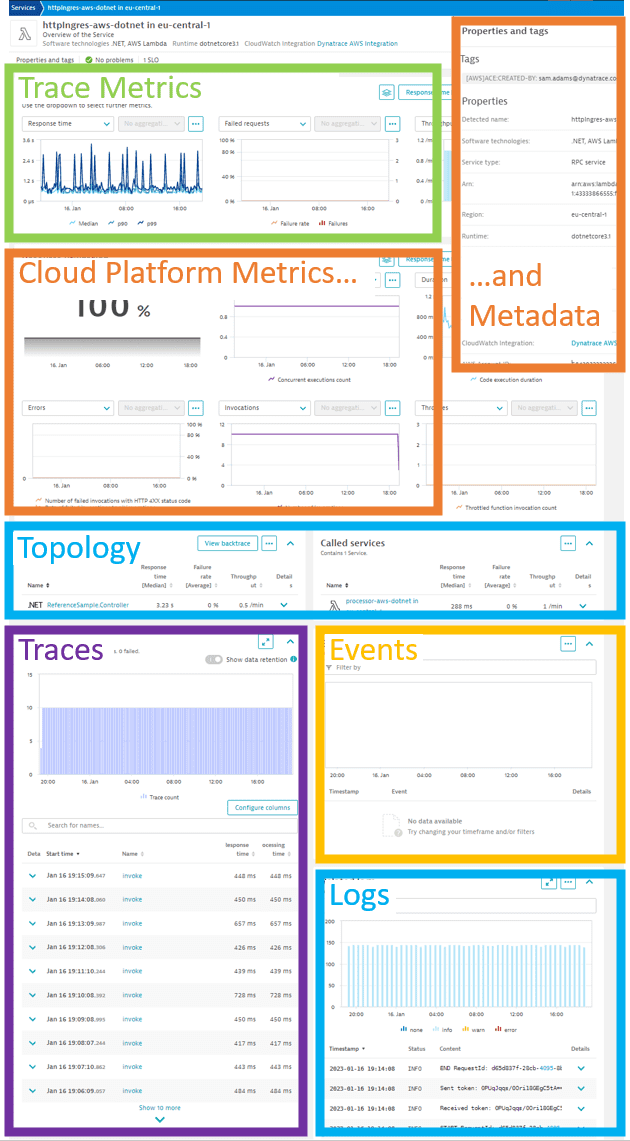
 Enable Dynatrace extensions on cloud services that support a native extensibility mechanism
Several cloud compute services support simple integration without the need to redeploy your service. This makes it easy to add deep service instrumentation for additional visibility.
Visit Dynatrace Hub to see all services with a cloud-native integration.
 Advanced visibility
For instructions on integrating Dynatrace into your container image, or using OpenTelemetry or advanced visibility to get additional details via logs and other telemetry events, see the service-specific tutorials:
Check the recommendations in the Dynatrace web UI to enable additional telemetry sources that improve the observability of your services. For example: