Dynatrace for Government
- How-to guide
- 10-min read
Dynatrace for Government is the FedRAMP version of Dynatrace Managed designed for federal, state, and local agencies.
Dynatrace is a software-intelligence monitoring platform that simplifies enterprise cloud complexity and accelerates digital transformation. Powered by Davis® (the Dynatrace AI causation engine) and complete automation, the Dynatrace all-in-one platform provides answers—not just data—about your applications and infrastructure. It also monitors the experience of your end users. Dynatrace modernizes and automates enterprise cloud operations, releases higher-quality software faster, and delivers optimum digital experiences to your organization's customers.
Dynatrace seamlessly brings infrastructure and cloud, application performance, and digital experience monitoring into an all-in-one, automated solution powered by AI. Dynatrace assists in driving performance results by providing development, operations, and business teams with a shared platform and metrics. In this way, Dynatrace can serve as your organization's single "source of truth."
Integration
Dynatrace for Government is part of your enterprise agency’s cloud ecosystem. It integrates with key components to support dynamic cloud orchestration, including Amazon Web Services (AWS), Azure, Google Cloud, VMware Tanzu Application Service, Red Hat OpenShift, and Kubernetes. In these environments, Dynatrace automatically launches and monitors the full stack. It monitors all applications and containers in the stack, including workloads that traverse multiple cloud and hybrid environments.
Close integration with cloud platforms helps you simplify development and operations, increase visibility, and improve situational awareness across hybrid, multi-cloud environments.
Dynatrace concepts
To get acquainted with the terms and concepts used within Dynatrace, visit the Dynatrace glossary and:
Dynatrace differences
The differences between Dynatrace for Government and Dynatrace SaaS
| Dynatrace for Government | Dynatrace SaaS | |
|---|---|---|
Full stack, all-in-one software intelligence |
|
|
Latest enterprise-technology support |
|
|
Early access to new features |
|
|
Deployment | Cloud, no infrastructure required | Cloud, no infrastructure required |
Data Storage | Dynatrace cloud data storage | Dynatrace cloud data storage |
Operations and updates managed by Dynatrace |
|
|
Single sign-on required |
| |
Synthetics | Private synthetic endpoints | Access to the Dynatrace public SaaS network |
Online support chat |
| |
Support |
|
|

How to get Dynatrace for Government
To obtain a Dynatrace for Government license, contact Dynatrace Sales. Your sales representative will provide you with further details. Dynatrace monitoring uses a consumption-based licensing model: you purchase and consume monitoring units based on your needs. For details, see License Dynatrace.
Once you reach an agreement, you'll receive an email with your license details and instructions on how to get started.

Set up Single Sign-On

Deploy Dynatrace

Monitor your host and its processes

Set up a problem notification

Create your first dashboard

Check further resources
Create your Dynatrace account
Meet with the Dynatrace team to set up your Dynatrace for Government environment. You need to integrate your existing single sign-on (SSO) configuration. See Supported SSO technologies to work with the Dynatrace for Government team to get integrated.
Deploy Dynatrace
To download and install OneAgent on a host
-
Go to Deploy Dynatrace.
-
Select Start installation, and then select the platform where you want to install OneAgent.
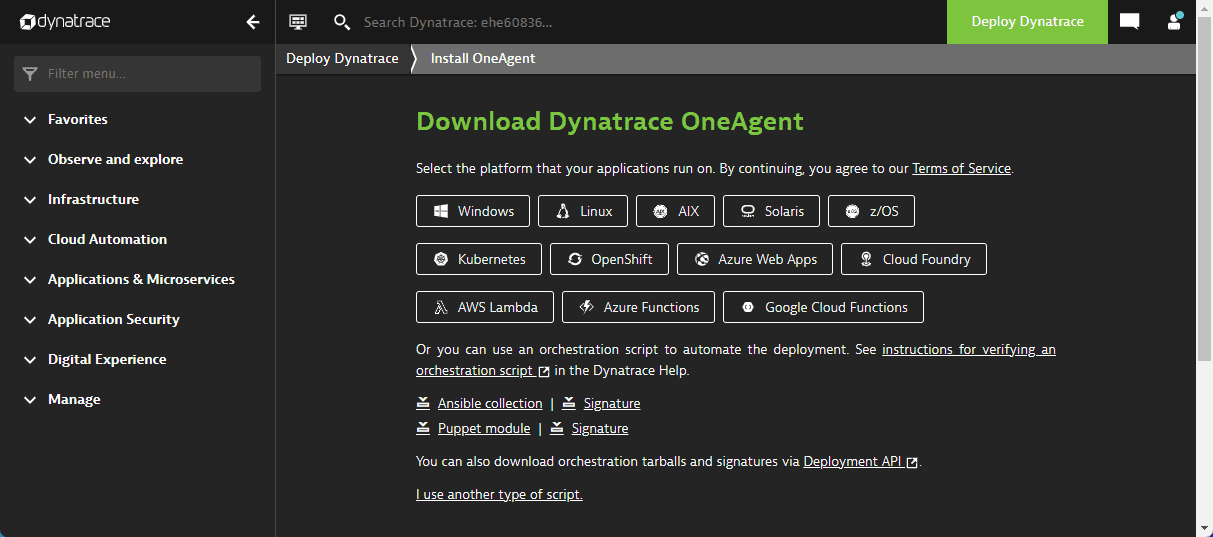 OneAgent platform selection
 -
Paste your PaaS token in the Download token field or select Create token to generate a new Deployment API token.
Copy the token and save it somewhere safe, because you won't be able to access it again.
-
Enter or select the appropriate parameters
- Architecture (Linux only)
- Monitoring mode Options are Full-Stack, Infrastructure, or Discovery. If you're using a free Dynatrace trial, select Full-Stack to see everything that Dynatrace is capable of observing. You can always change the monitoring mode after installation.
- For Optional parameters, add a Custom host name for easier identification. The rest of the parameters are out of scope for this guide.
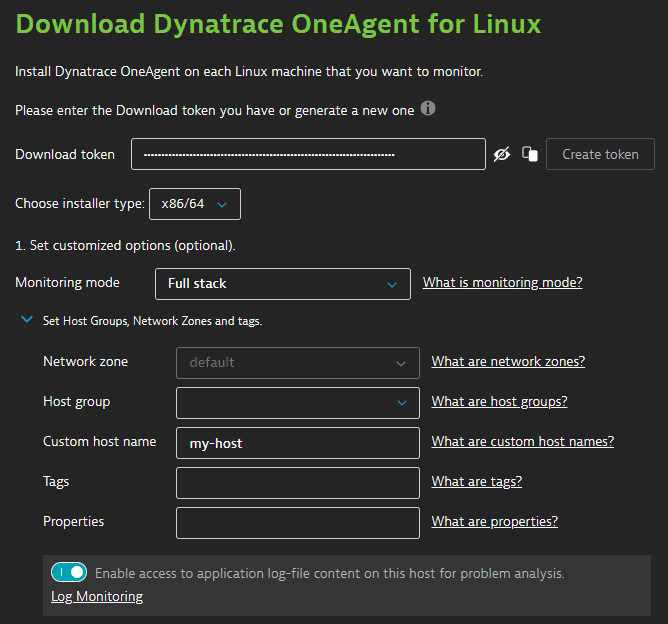 OneAgent deployment parameters
 -
Download OneAgent. Either use the provided command-line interface (CLI) command or select Download.
-
Verify the signature. Use the provided CLI command. (Note: Linux and AIX only.)
-
Install OneAgent. Either use the provided CLI command or run the executable by selecting it in the GUI. Follow the steps as described in the installer.
If you install via the GUI, add the following options in the Optional: advanced command-line settings screen:
--set-monitoring-mode=fullstack --set-app-log-content-access=true -
When the installer shows a Congratulations! Dynatrace OneAgent was successfully installed! message, OneAgent is running on the host. Select Finish to exit the installer.
-
Because OneAgent can't inject itself into running processes, you'll need to restart all processes that you want OneAgent to monitor.
-
To confirm that OneAgent is monitoring your host, open Dynatrace and go to Infrastructure & Operations > Host. If everything is working as expected, you'll see the name of your host in the Hosts table. See the screenshot below for an example.
OneAgent is now set up and monitoring your host. See Get started to continue your first journey with Dynatrace.
Monitor your host and its processes
When you select the host name, Dynatrace shows you what it already knows about your host.
The following are just a few of the things you can find on the host overview screen.
Properties and tags
Select Properties and tags on the notifications bar to display the Properties and tags panel, which displays metadata about the selected host:
- Tags lists tags currently applied to the host. Select Add Tag to add a tag to the host metadata.
- Properties lists various host properties, such as OneAgent version, OS version, monitoring mode, IP addresses, and management zones.
Problems
- On the notifications bar, Problems indicates active and closed problems related to the selected host.
- Select Problems on the notifications bar to display the Problems panel, which lists the problems.
- Select a problem to display details.
- Select Go to problems to go to the Problems page filtered by the selected host.
Vulnerabilities
-
On the notifications bar, Vulnerabilities indicates the top detected vulnerabilities affecting the selected host.
-
Select Vulnerabilities on the notifications bar to display the Vulnerabilities panel, which lists the most severe third-party vulnerabilities and code-level vulnerabilities related to this host.
- Select a vulnerability in the list to view the details and understand the severity and impact of a vulnerability within your environment.
- For a complete list of the detected vulnerabilities affecting this host, select Show all third-party vulnerabilities/Show all code-level vulnerabilities.
Example third-party vulnerabilities:
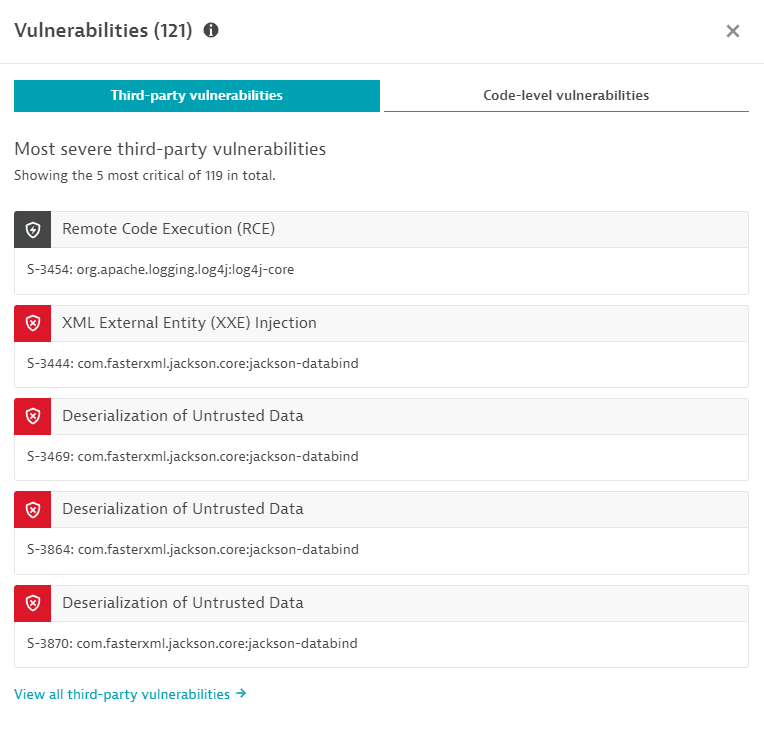 Host overview: TPV
Example code-level vulnerabilities:
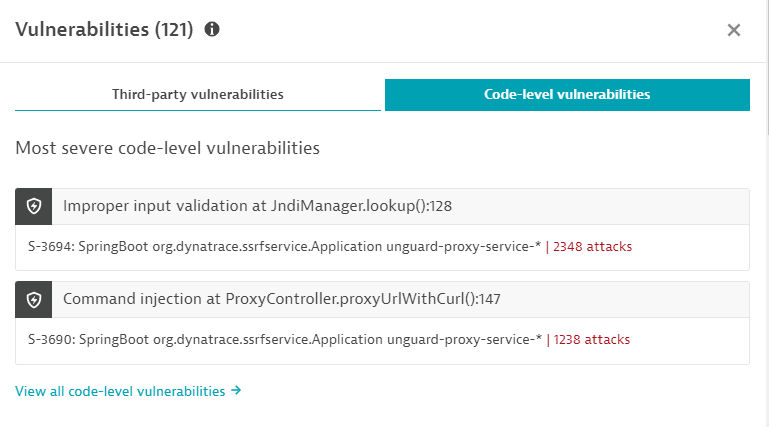 Host overview: CLV
If you're missing the security permissions for the selected management zone, the Vulnerabilities tab on the notification bar shows Not analyzed.
Availability
-
On the notifications bar, Availability indicates the percentage of time that the host was online and responsive to requests. Dynatrace detects and shows operating system shutdowns (including reboots) and periods when a host is offline (for example, if the host is down unexpectedly).
-
Select Availability on the notifications bar to display the Host availability panel, which charts host availability over time.
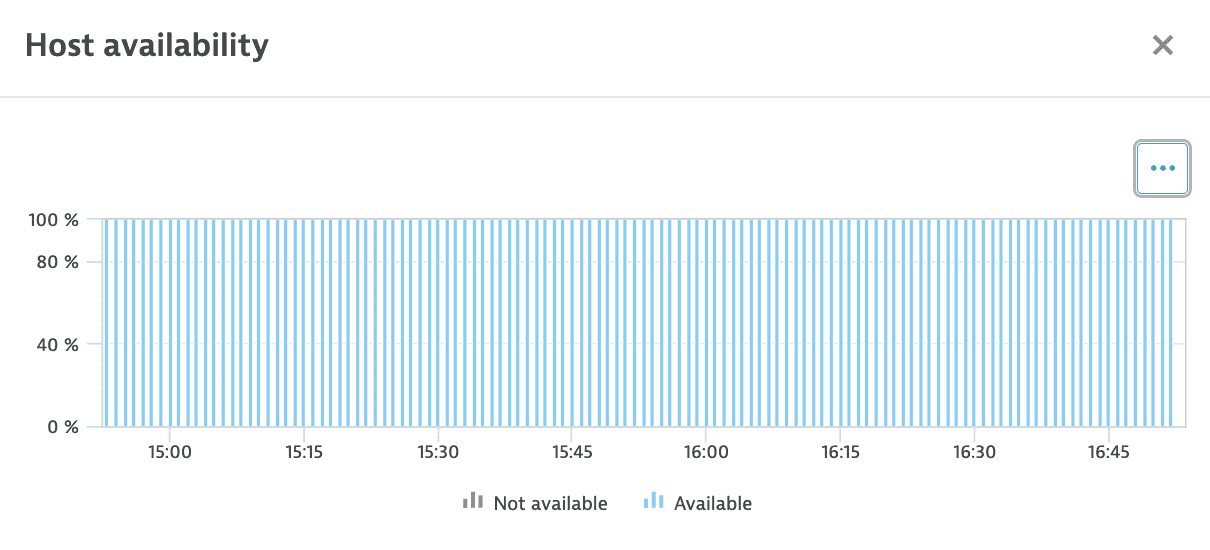 Host page detail - online availability
For details, see Host availability.
Host performance
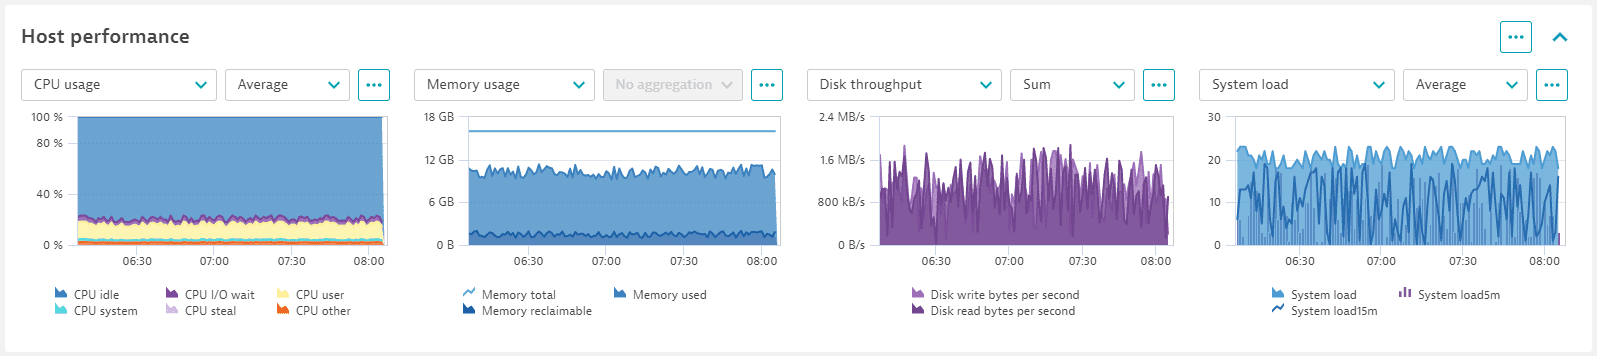
Go to the Host performance section for quick insights with relevant metrics: CPU, memory, and network metrics, with different metric aggregations for the selected timeframe. Timeline browsing lets you pinpoint selected anomalies in all metric charts simultaneously, making it easier to understand the relationships between the various infrastructure components at a specific point in time.
It is easy to inspect maximum or minimum peaks in resource consumption, as each metric chart allows the selection of a different aggregation. Custom metrics can also be displayed instead of the default metrics, allowing inspection of specific relationships across metrics that might be critical for any specific host configuration.
Leverage these charts
Select in the upper-right corner of a chart to:
- Show in Data Explorer—Opens Data Explorer for the associated query, so you can view the associated query, explore the data more in-depth, adjust the chart settings, and pin the chart to your own dashboard.
- Pin to dashboard—Pins a copy of the selected chart to any classic dashboard you can edit. For example, if certain hosts are particularly important to your business, create a dashboard designated to monitoring only those hosts, and then pin charts from their host overview pages to that dashboard, all with almost no typing. For details, see Pin tiles to a dashboard.
Process analysis
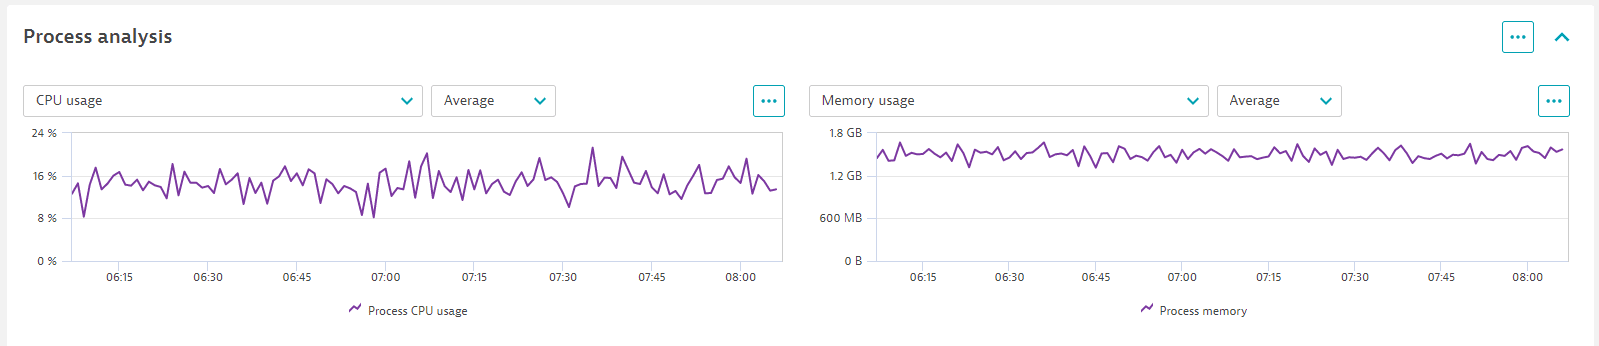
To get a better understanding of process behavior, go to the Process analysis section, which charts and lists processes running on the selected host. Select a process to drill down for details about that process on the host.
Leverage these charts
Select in the upper-right corner of a chart to:
- Show in Data Explorer—Opens Data Explorer for the associated query, so you can view the associated query, explore the data more in-depth, adjust the chart settings, and pin the chart to your own dashboard.
- Pin to dashboard—Pins a copy of the selected chart to any classic dashboard you can edit. For example, if certain hosts are particularly important to your business, create a dashboard designated to monitoring only those hosts, and then pin charts from their host overview pages to that dashboard, all with almost no typing. For details, see Pin tiles to a dashboard.
Process instance snapshots
OneAgent version 1.237+
The Process instance snapshots section offers additional insights into the most resource-consuming processes running on your host and the processes defined for Process availability monitoring.
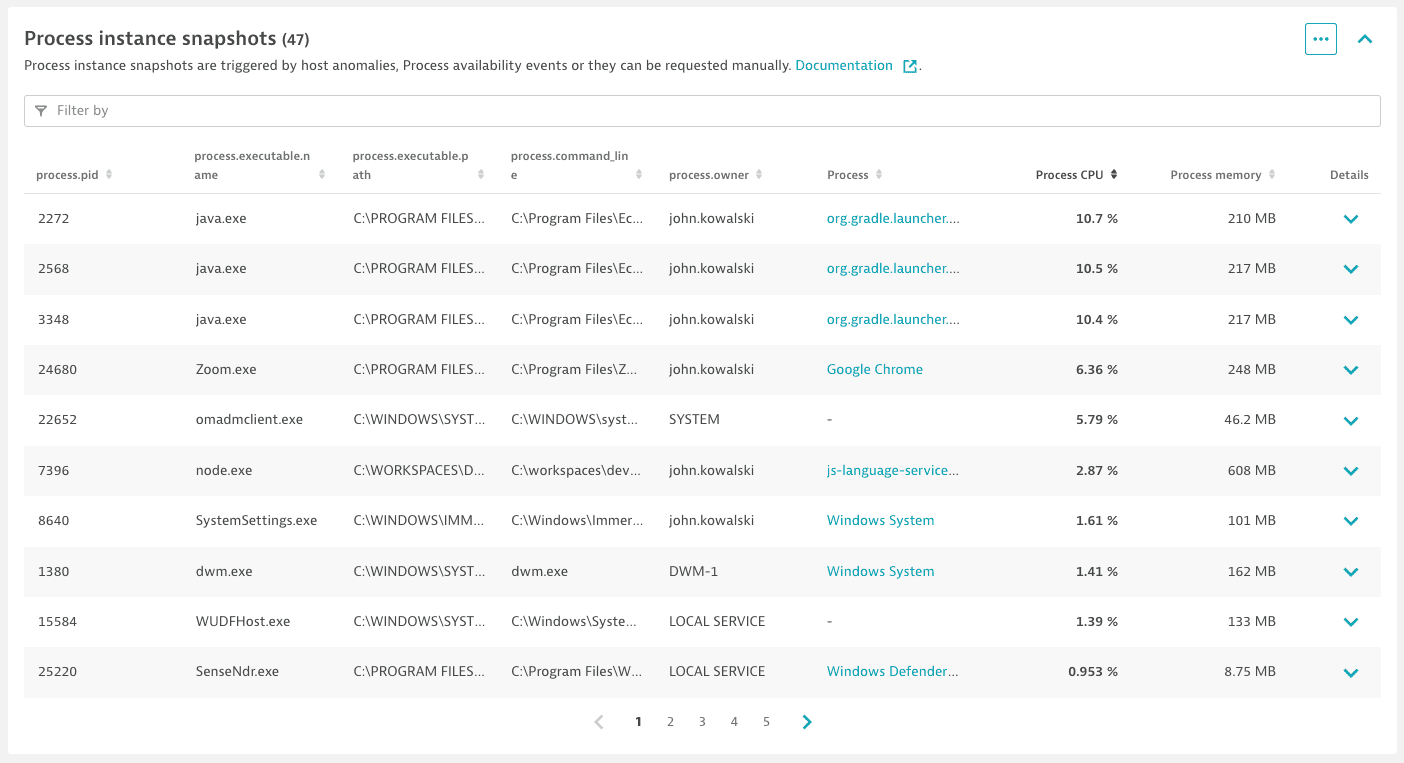
A single process instance snapshot is a set of monitoring data for processes. It contains data on the process CPU usage (%), Memory usage (B), Incoming network traffic (KB), and Outgoing network traffic (KB) measured at one-minute intervals. A single snapshot contains 20 minutes of monitoring data: 10 minutes preceding the trigger and 10 minutes after the trigger. Each host can report only 60 minutes of these metrics per day. A process is considered for the snapshot if its consumption of CPU, memory, or network is more than 1%.
A process instance snapshot is triggered by high CPU, memory, or network usage on your host. You can also request a process snapshot manually. Select in the upper-right corner of the section and select Request process snapshot now. Wait for a message confirming a successful snapshot trigger. Process snapshot data should appear after you reload the page within 90 seconds.
Additionally, for processes defined for Process availability monitoring, the snapshot shows how the processes behaved before they disappeared and if they reappeared within 10 minutes.
Enable process instance snapshots
You can enable process instance snapshots at a host or environment level.
- To enable it at the environment level, go to Settings, select Processes and containers > Process instance snapshots, and turn on Enable process instance snapshots.
- To define a host-level rule, go to a host overview page, select , go to Settings, select Process instance snapshots, and turn on Enable process instance snapshots.
- To define a host group level rule, go to the host group page at
https://your-environment/ui/settings/HOST_GROUP-NAME, select Process instance snapshots, and turn on Enable process instance snapshots.
On the same settings page, you can also lower the limit of processes reported in a single snapshot. The maximum/default setting is 100 processes.
Disk analysis
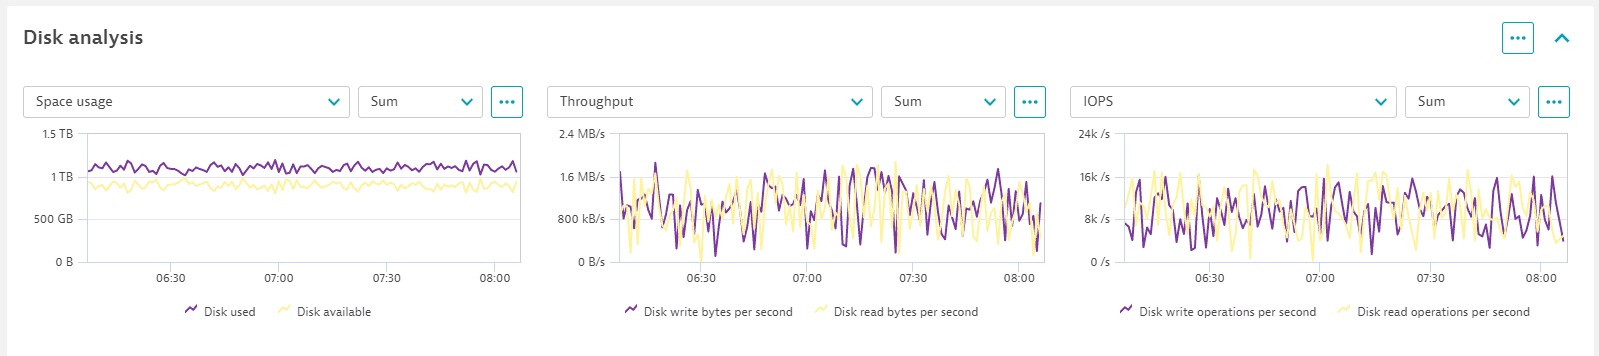
To identify disk performance bottlenecks, go to the Disk analysis section , which displays all mount points for Linux systems and all volumes for Windows. At a glance, you can see the disk space usage and throughput metrics, in addition to other selected disk metrics, to allow rapid identification of any disk performance issues.
- On the host page, filter disks by disk name to focus on the selected disk
- Expand a disk entry to see details about the selected disk. Each disk instance displays separate detailed performance metrics, making it easy to spot any disk resource not performing optimally.
Each mount point (Linux) or volume (Windows) has its own performance metrics in addition to the combined metrics. This allows spotting a slow or erratic disk much easier. Alerts can be set for individual disks as for the combined charts.
Leverage these charts
Select in the upper-right corner of a chart to:
- Show in Data Explorer—Opens Data Explorer for the associated query, so you can view the associated query, explore the data more in-depth, adjust the chart settings, and pin the chart to your own dashboard.
- Pin to dashboard—Pins a copy of the selected chart to any classic dashboard you can edit. For example, if certain hosts are particularly important to your business, create a dashboard designated to monitoring only those hosts, and then pin charts from their host overview pages to that dashboard, all with almost no typing. For details, see Pin tiles to a dashboard.
Disk monitoring
Disk monitoring is a scheduled task that collects disk metrics from the agent. It starts automatically when OS agent detects a disk.
The available settings for disks are:
- Disk options: You can create exception rules to remove certain disks from the monitoring list and detect duplicate disks. For more details, see below or refer to Disk options.
- Disk anomaly detection rules: You can configure host anomaly detection, including problem and event thresholds, to meet your specific needs. For more details, refer to Host anomaly detection.
- Anomaly detection for infrastructure: Disk: You can use these settings to configure detection sensitivity, set alert thresholds, or disable alerting for disks. For more details, refer to Anomaly detection.
Limitations
-
Supported disk metrics
Infrastructure
Disk
Metric key Name and description Unit Aggregations Monitoring consumption builtin:host .disk .throughput .read Disk throughput read
File system read throughput in bits per second
bit /s autoavgmaxmin Host units builtin:host .disk .throughput .write Disk throughput write
File system write throughput in bits per second
bit /s autoavgmaxmin Host units builtin:host .disk .avail Disk available
Amount of free space available for user in file system. On Linux and AIX it is free space available for unprivileged user. It doesn't contain part of free space reserved for the root.
Byte autoavgmaxmin Host units builtin:host .disk .bytesRead Disk read bytes per second
Speed of read from file system in bytes per second
Byte /second autoavgmaxmin Host units builtin:host .disk .bytesWritten Disk write bytes per second
Speed of write to file system in bytes per second
Byte /second autoavgmaxmin Host units builtin:host .disk .free Disk available %
Percentage of free space available for user in file system. On Linux and AIX it is % of free space available for unprivileged user. It doesn't contain part of free space reserved for the root.
Percent (%) autoavgmaxmin Host units builtin:host .disk .inodesAvail Inodes available %
Percentage of free inodes available for unprivileged user in file system. Metric not available on Windows.
Percent (%) autoavgmaxmin Host units builtin:host .disk .inodesTotal Inodes total
Total amount of inodes available for unprivileged user in file system. Metric not available on Windows.
Count autoavgmaxmin Host units builtin:host .disk .queueLength Disk average queue length
Average number of read and write operations in disk queue
Count autoavgmaxmin Host units builtin:host .disk .readOps Disk read operations per second
Number of read operations from file system per second
Per second autoavgmaxmin Host units builtin:host .disk .readTime Disk read time
Average time of read from file system. It shows average disk latency during read.
Millisecond autoavgcountmaxminsum Host units builtin:host .disk .used Disk used
Amount of used space in file system
Byte autoavgmaxmin Host units builtin:host .disk .usedPct Disk used %
Percentage of used space in file system
Percent (%) autoavgmaxmin Host units builtin:host .disk .utilTime Disk utilization time
Percent of time spent on disk I/O operations
Percent (%) autoavgmaxmin Host units builtin:host .disk .writeOps Disk write operations per second
Number of write operations to file system per second
Per second autoavgmaxmin Host units builtin:host .disk .writeTime Disk write time
Average time of write to file system. It shows average disk latency during write.
Millisecond autoavgcountmaxminsum Host units -
OneAgent installer based deployment
- Network disks are supported for Linux hosts, AIX hosts, and since the release of OneAgent version 1.277, monitoring of network disks has been enabled also on Windows.
- SMB 1.0 is supported starting with OneAgent version 1.263.
-
OneAgent application-only deployment
-
Application-only OneAgents provide a reduced set of Disk I/O metrics, such as:
Disk read bytes per secondDisk write bytes per secondDisk read operations per secondWrite operations per second
-
Linux uses the file
/proc/diskstatsthat provides information about disk I/O activity on the system./proc/diskstatsdoes not provide any information about network mounts. -
Solaris doesn't provide any Disk I/O information.
-
AIX reports only the Disk I/O information about
Disk read bytes per secondandDisk write bytes per second.
-
Windows only The disk page shows only local disks with a letter and/or a mount point. For remote disks, the system recognizes and displays only the shares with CIFS protocol. For details, see https://dt-url.net/jw03uor.
Disable monitoring for specific disks
Set an exclusion filter to avoid problems with special mount points:
- Go to Settings > Preferences > Disk options.
- Select Add item to exclude the disk from the monitoring list.
- Provide your OS, disk path and file system type.
- Select Save changes.
Disk deduplication
Disk deduplication helps reduce redundancy in Network File System (NFS) mounts on a host. In some cases, the same NFS share may be mounted multiple times at different mount points or with different options. This can result in duplicate entries that affect monitoring accuracy. Disk deduplication identifies and removes these redundant mounts to ensure cleaner and more accurate disk data.
The system detects duplicate disks by comparing their IP addresses and available or used space. If two or more disks share the same IP and usage metrics, they are considered duplicates and are deduplicated accordingly.
You can turn disk deduplication on or off in Settings > Preferences > Disk options.
User impersonation on Windows
On Windows, OS agent impersonates a logged-on user to collect disk metrics from NFS shares. The agent uses the impersonated security context to query the NFS server for disk metrics.
Network analysis
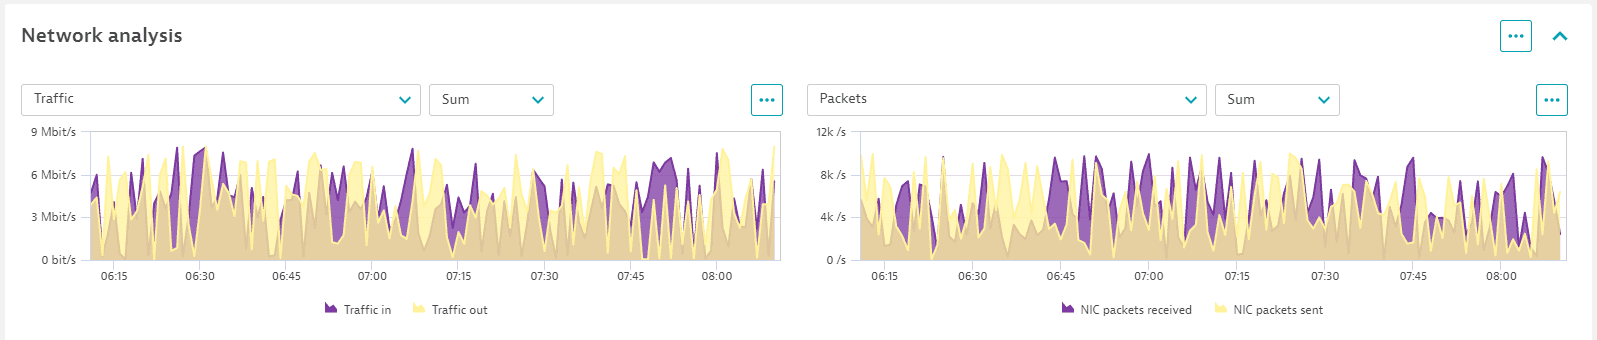
To spot network-related issues rapidly, go to the Network analysis section, which lists all network interfaces and combined metrics for all of them, in addition to individual metrics per network interface.
Use this section to:
- Identify packet loss, error packets, and other network issues
- Search for network interfaces by network name
- Identify network bottlenecks down to the specific adapter
Leverage these charts
Select in the upper-right corner of a chart to:
- Show in Data Explorer—Opens Data Explorer for the associated query, so you can view the associated query, explore the data more in-depth, adjust the chart settings, and pin the chart to your own dashboard.
- Pin to dashboard—Pins a copy of the selected chart to any classic dashboard you can edit. For example, if certain hosts are particularly important to your business, create a dashboard designated to monitoring only those hosts, and then pin charts from their host overview pages to that dashboard, all with almost no typing. For details, see Pin tiles to a dashboard.
Memory analysis
Use the Memory analysis section to analyze:
- Memory usage—total memory, memory used, and memory reclaimable
- Page faults—page faults per second
- Swap usage—swap total and swap used
Leverage these charts
Select in the upper-right corner of a chart to:
- Show in Data Explorer—Opens Data Explorer for the associated query, so you can view the associated query, explore the data more in-depth, adjust the chart settings, and pin the chart to your own dashboard.
- Pin to dashboard—Pins a copy of the selected chart to any classic dashboard you can edit. For example, if certain hosts are particularly important to your business, create a dashboard designated to monitoring only those hosts, and then pin charts from their host overview pages to that dashboard, all with almost no typing. For details, see Pin tiles to a dashboard.
Events
The events section displays recent host events that Davis AI has generated, with a clear timeline view to quickly identify critical events. The timeline view is interactive, filtering events around a specific moment, making it easier to isolate a particular event. In addition, different event types are color-coded for easier and faster identification and browsing.
- Show single card—Opens an Events card for the selected host.
Logs
The log viewer timeline is interactive, allowing a global timeline selection. Use it to identify issues around a specific log event and see how it relates to hosting performance or processes.
- The entire host page time selection will match what is selected in the log viewer. In this way, an error log can be easily compared to host performance metrics or process metrics around the time the log error took place. The same timeline selection will arrive on the event card.
- You can filter logs based on process group, status, log level, and other parameters, allowing searching, for example, just for error logs or for logs about a certain process.
Leverage this information
Select in the upper-right corner of the Logs section to:
- Go to Log Viewer—Opens the Log Viewer page filtered by the selected host.
- Create metric—Opens the Log metrics page with the Query value set to the selected host.
Set up a problem notification
Dynatrace offers several out-of-the-box integrations that automatically push Dynatrace problem notifications to your third-party messaging or incident-management systems. If your third-party system isn't supported with an out-of-the-box integration, you can set up email integration. Using this approach, Dynatrace sends an email whenever it detects a problem in your environment that affects real users.
-
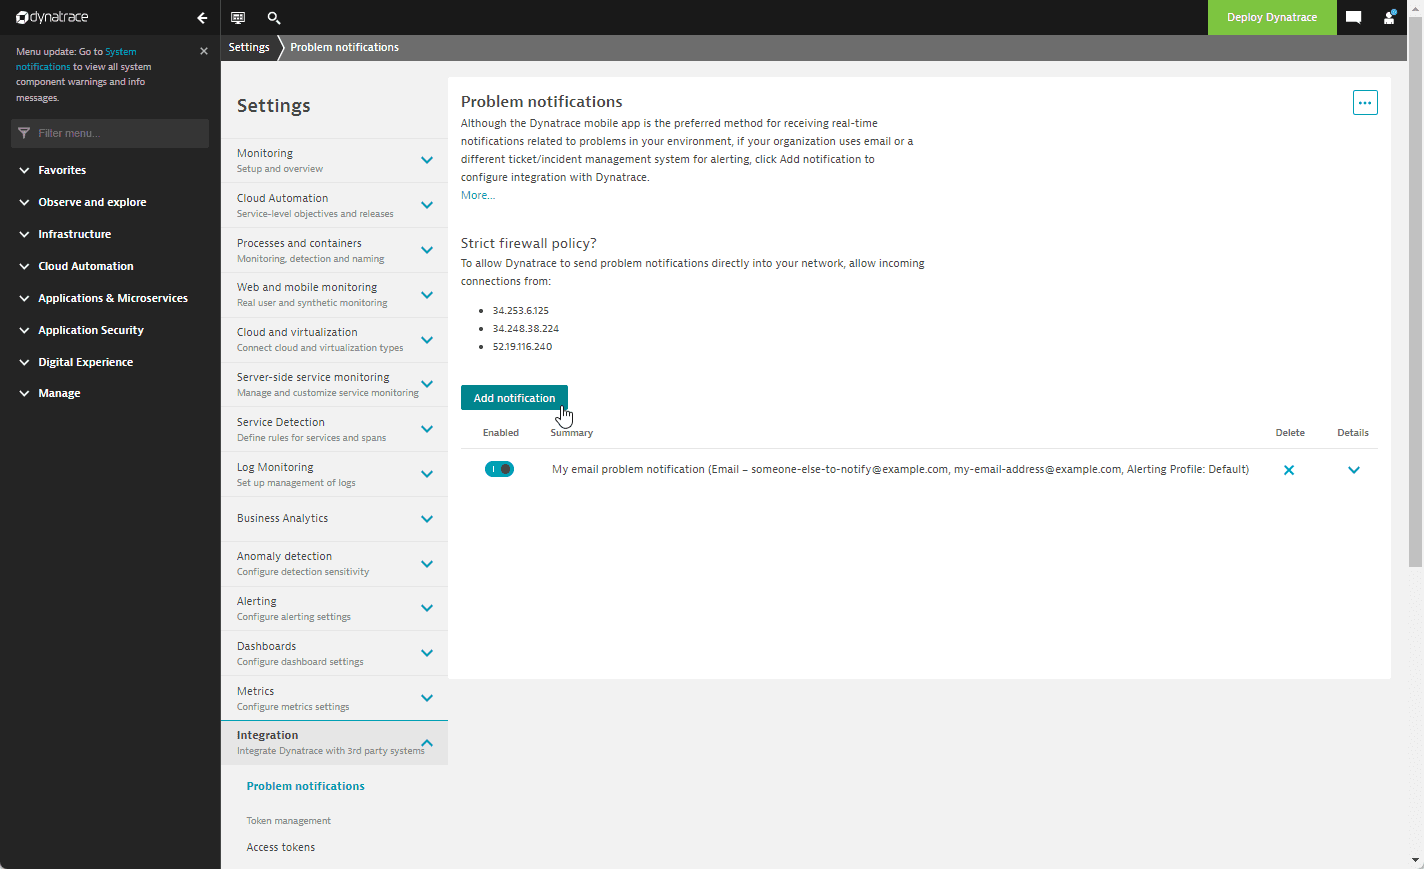
Go to Settings and select Integration > Problem notifications.
-
Select Add notification.
 Add an email problem notification
 -
Select Email from the available notification types.
-
Configure the notification:
- Enter a Display name for this integration. This freeform name appears in the Problem notifications table when you finish this configuration.
- In the To section, select Add recipient to add the email address that should receive notifications. To add more recipients, select Add recipient for each additional To address.
- In the CC field, select Add recipient to add additional email addresses that should receive notifications.
- In the BCC field, select Add recipient to add additional email addresses that should receive notifications but shouldn't appear in the email header.
- In the Subject field, type text or insert placeholders that Dynatrace automatically populates with relevant problem details, such as problem ID, state, or impact.
- In the Body field, configure the problem notification message that's to appear in the body of problem-notification emails.
Placeholders
The Available placeholders section of the configuration screen lists placeholders you can use for this integration. Placeholders are automatically replaced with actual values in the message.
- Select an alerting profile to filter the problem feed.
-
Select Send test notification to make sure your email integration is working.
-
Save changes.
Create your first dashboard
To create a dashboard
-
Go to Dashboards.
-
Select Create Dashboard.
-
Enter a name for your dashboard and select Create. The new dashboard opens in edit mode.
-
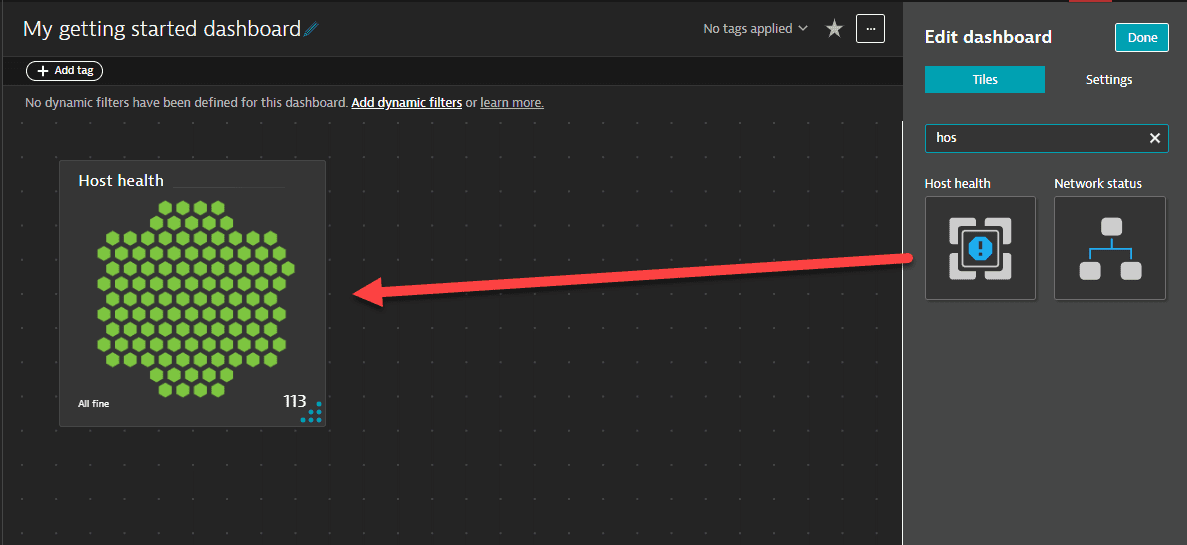
To add a tile, drag it from the Tiles pane to the dashboard. For example, drag a Host health tile to your new dashboard.
 Drag host health tile to dashboard
 -
Select Done. The dashboard now shows as it appears to you and people with whom you share it. (Other people won't see the Edit button if you don't give them edit permission.)
To pin a chart from the host overview screen to your new dashboard
-
Go to Hosts.
-
Find and select your host in the table.
-
On the host overview screen, in the Host performance section, find the CPU (central processing unit) usage chart.
-
Select > Pin to dashboard.
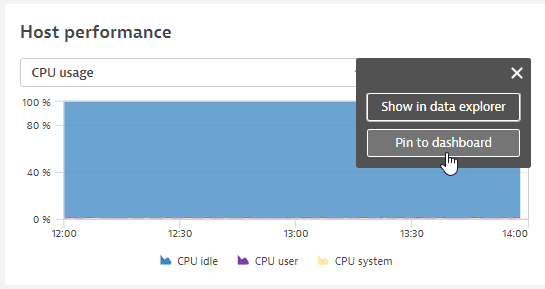 Pin CPU usage chart to dashboard
 -
Select Pin. This pins a copy of the CPU usage chart to your dashboard.
-
Select Open dashboard to return to your dashboard. The dashboard opens in edit mode with the new tile selected.
-
Select Done to save your changes and display the updated dashboard.
Try using the same procedure to add a few more tiles to your dashboard.
Check further resources
To learn more about Dynatrace, see:
- Free trial resources
- Getting Started with Dynatrace at Dynatrace University