Pin tiles to a dashboard
- How-to guide
- 5-min read
To put a view from another Dynatrace page, or a Data Explorer chart, on a dashboard as a tile, follow the steps below.
 Pin a filtered page
You can create a dashboard tile from any Dynatrace page that includes a Pin to dashboard button.
You need edit permission for the target dashboard. If you don't have a dashboard yet, create one first, which gives you edit permission for it.
This example pins a filtered view of the Hosts page.
-
Go to Hosts.
-
Set a filter on the list. In this example, set
Data center: Gdańsk, Poland.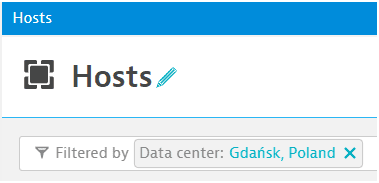 Hosts page filtered to the hosts in the Gdańsk, Poland, data center
How to set a filter
-
For common filters, select a filter directly from the Quick filters column of the Hosts page. The quick filters are a subset of the available filters.
-
To specify any available filter, start typing on the Filtered by line to select a filter, and then select or enter a value.
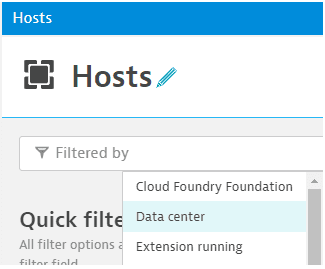 Filtered by line with the list of available host filters
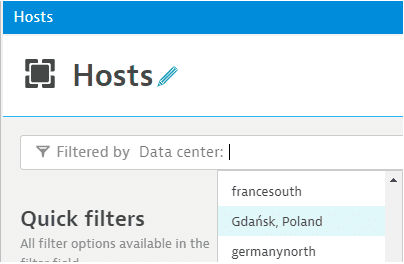 Filtered by line with the values for the selected filter
-
-
Select Pin to dashboard.
Dynatrace displays a preview of the tile and asks you to select the target dashboard. The list of dashboards is searchable: select the list, start typing to filter it, and then select the dashboard.
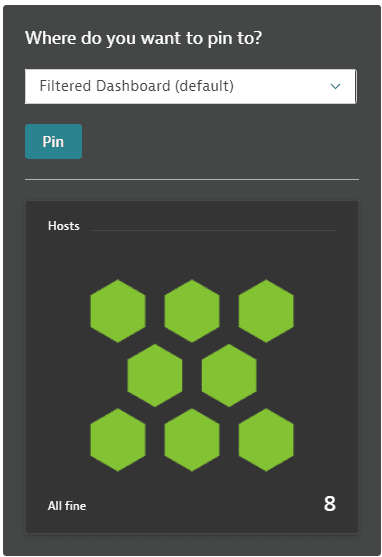 Pin to dashboard dialog with a preview of the tile and the searchable dashboard list
 -
Select a dashboard and select Pin.
Dynatrace creates the tile and pins it to that dashboard.
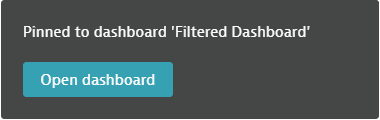 Confirmation that the tile is pinned, with the Open dashboard button
 -
Select Open dashboard.
The dashboard opens in edit mode with the new tile selected for editing. For a Host health tile, you can change these settings before you save it:
- Optional Select whether to show a visualization on the tile.
- Optional Select a custom timeframe.
- Optional Select a custom management zone.
- Optional Select an environment.
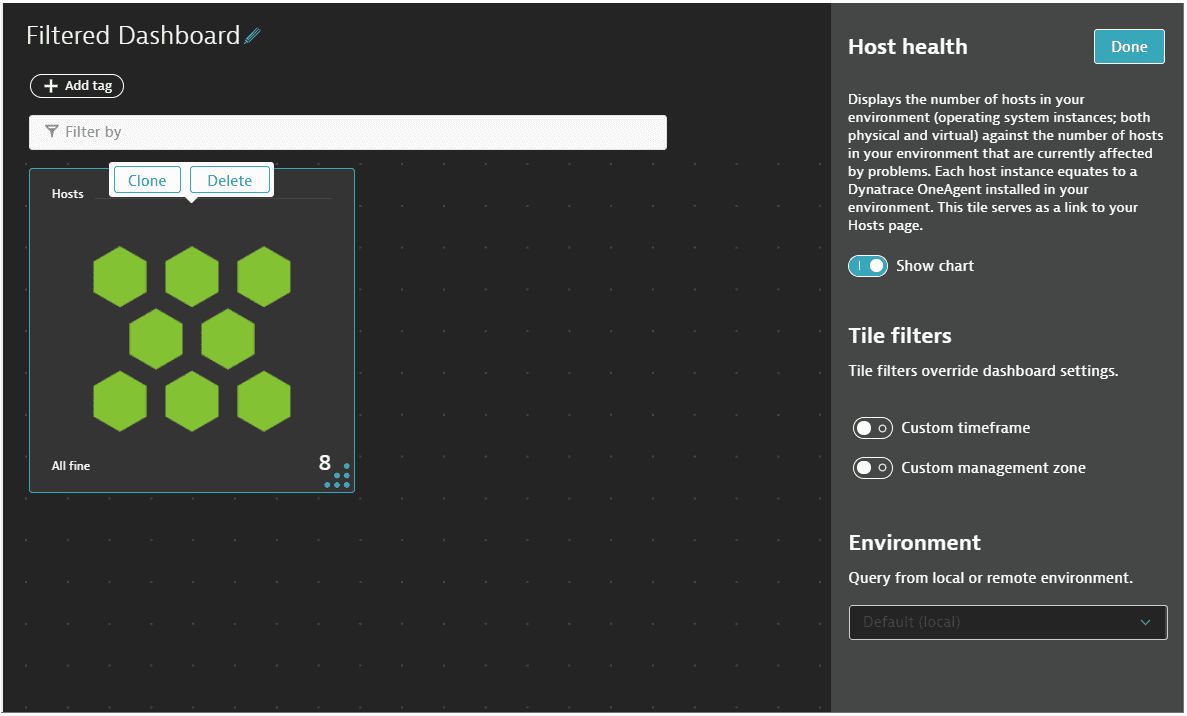 New tile selected in edit mode, with its optional timeframe, management zone, and environment settings
 -
Select Done.
The dashboard shows the new tile, which represents the hosts in the Gdańsk, Poland, data center.
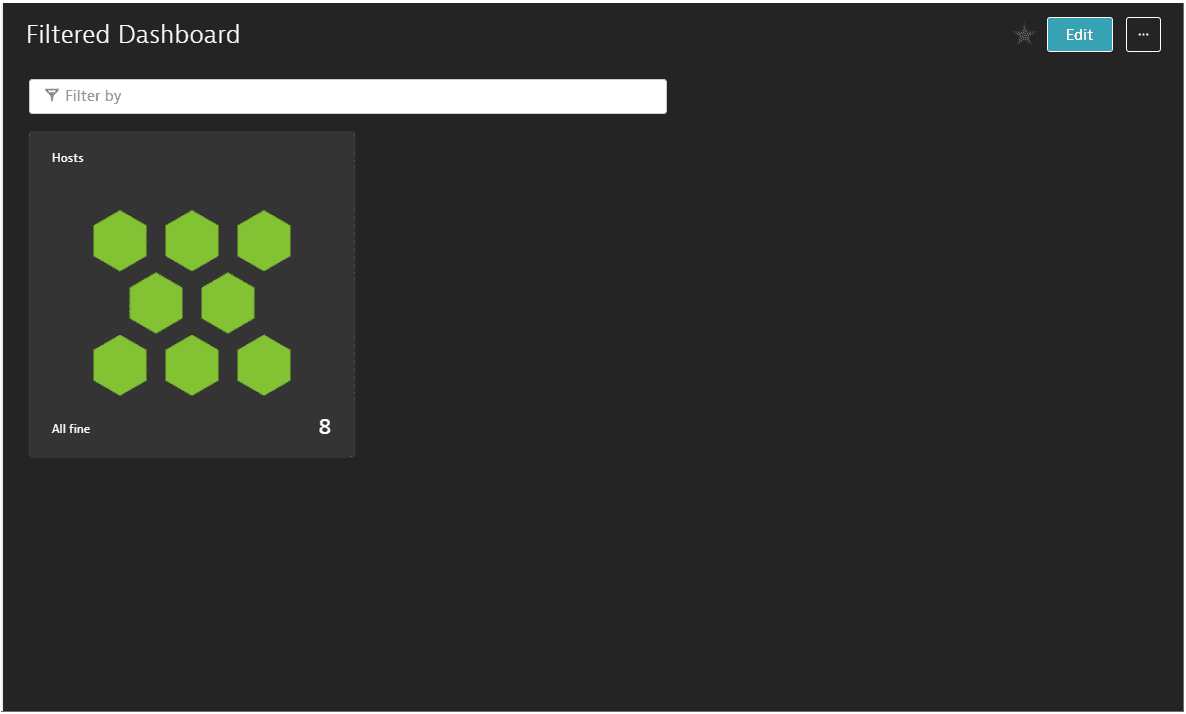 Dashboard showing the health of the hosts in the Gdańsk, Poland, data center
The filter is fully dynamic:
- When hosts join or leave the filtered set, or when their health changes, the tile updates automatically.
- Each hexagon on the tile represents a host. A green hexagon is a healthy host, and a red hexagon is a host with a problem. Hover over a red hexagon to see which host has the problem, or select it and then select View host to drill down to its details.
- To open the filtered Hosts page that you created the tile from, open the menu in the upper-right corner of the tile and select View details.
To put a bold label above the tile, add a Header tile. For details, see Available tiles.
 Pin a Data Explorer chart
-
Go to Data Explorer.
-
Configure the query for the tile. You can build the query iteratively.
- Select Run query after each query change to see its results.
- Select different visualization types to see what works best for your query. The available visual settings depend on the query and the visualization you choose. For details, see Visualization settings.
-
Select Pin to dashboard, and then choose the destination dashboard and tile title.
If you opened Data Explorer from a tile through Configure tile, you can instead select Save changes to dashboard to save your changes to the tile and dashboard you started from.
-
Select Open dashboard to see the tile on the dashboard.
-
Optional Change the tile title, or select a custom timeframe, a custom management zone, or an environment.
 Update a filtered tile
-
On your dashboard, select the tile.
The Hosts page opens with the tile's filter applied.
-
Add or delete filters.
In this example, keep
Data center: Gdańsk, Polandand addOperating system: Linux. When the filters change, the Update dashboard tile button is enabled.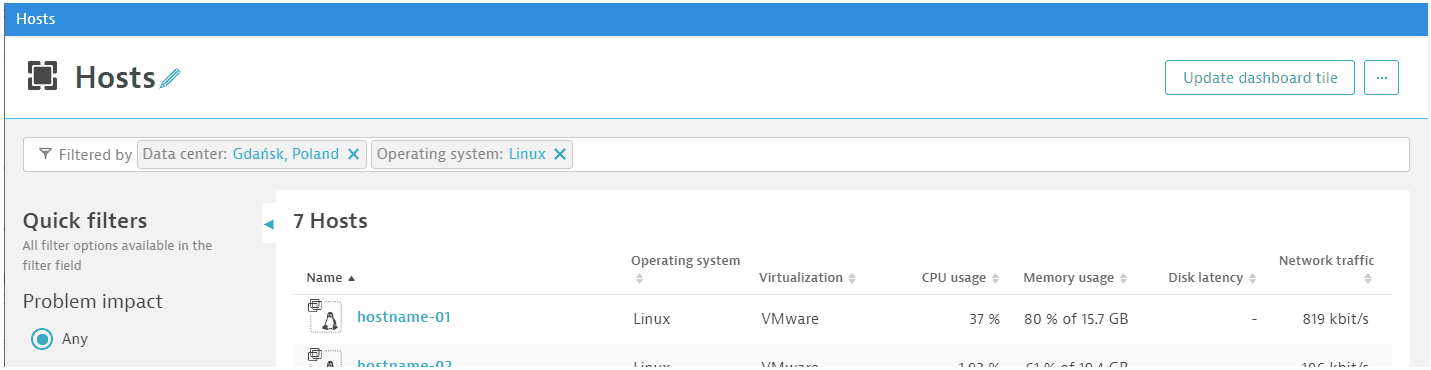 Hosts page with an added Linux filter and the Update dashboard tile button enabled
 -
Select Update dashboard tile.
Dynatrace saves the new filter settings to the tile. In this example, the tile shows the health of hosts that match
Data center: Gdańsk, PolandandOperating system: Linux, and it opens the Hosts page with those filters. -
To return to the dashboard, select the dashboard button in the upper-left corner of Dynatrace.
 Dashboard button that returns you to the current dashboard
 Pin as new tile
Instead of updating a tile, you can save a new copy of it. For example, you might want several similar tiles, each filtered for a different operating system.
-
Open the tile menu in the upper-right corner of the tile and select View details.
The Hosts page opens with the same filters set.
-
Select More > Pin as new tile, and then select the target dashboard.
- Select a different dashboard to have copies of the same tile on two dashboards.
- Select the same dashboard to have two copies of the tile on one dashboard. You can then edit each copy to use a different management zone, timeframe, environment, or set of filters.
 Clone tiles
Cloning saves work when you need several similar tiles. For example, to show three visualizations that differ only in the host they query, create the first visualization, refine its settings, and clone it twice. Then edit the clones to query the other two hosts.
-
Go to Dashboards and select the name of a dashboard to display it.
-
Select Edit in the upper-right corner of the dashboard.
The dashboard opens in edit mode. If you don't see Edit, you don't have permission to edit that dashboard.
-
Select the tile you want to clone, or drag a selection rectangle around several tiles.
-
Clone the selection.
- To add the copies to the current dashboard, select Clone, or Clone x tiles for several tiles.
- To add the copies to another dashboard, select Clone to, or Clone x to for several tiles. In the Where do you want to pin to? window, select an existing dashboard or Create new dashboard, and then select Pin.
-
Edit the cloned tiles as needed.
The cloned tiles appear on the dashboard you selected.
What's next
- Add dynamic filters to a dashboard.
- Share a dashboard with the people who need its tiles.