Available tiles
- Reference
- 13-min read
The following sections list the tiles you can add to your dashboards, grouped by category, with what each tile displays, where it drills down to, and its tile-specific settings.
To add a tile from the dashboard editor, see Create a dashboard. To pin a tile with filters set from a Dynatrace page, see Pin tiles to a dashboard.
Unless a tile states otherwise, its settings are a subset of these common settings:
- Show visualization: whether to show a visualization on the tile
- Custom timeframe: a timeframe that overrides the dashboard timeframe
- Management zone: a custom management zone for the tile
- Environment: the environment the tile reads its data from
Health tile drilldowns
Health tiles, such as Host health, Service health, and Application health, show green and red elements, such as hosts, services, or applications.
-
Hover over a problematic (red) element to see its identity.
-
To drill down to a problematic (red) element, select the red hexagon, and then select the drilldown button for that element, such as View host or View test. In this example Synthetic monitor health tile, selecting a red element enables the View test drilldown button.
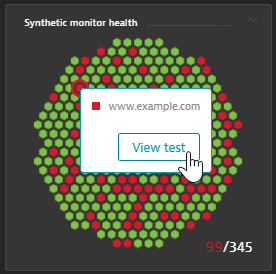 Drill down to problematic entity from health tile
 -
You can't drill down from a healthy (green) element. From any tile, however, you can select the menu in the upper-right corner of the tile and then select View details to display the relevant Dynatrace page for the tile. For example, View details from a Synthetic monitor health tile displays the Synthetic monitors table.
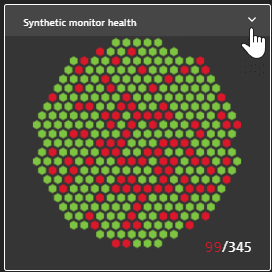 Health tile with its menu open in the upper-right corner
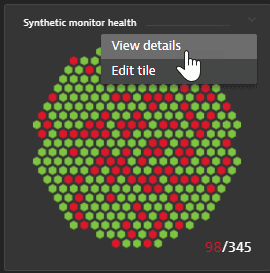 Select 'View details' from tile menu
Visualizations
Use visualization tiles to create visual representations of Data Explorer queries that you can pin to your dashboards.
Visualization types
Visualization tiles come in the following kinds. For how each one looks as a tile, see Visualizations, and for its settings, see Visualization settings.
- Graph
- Stacked column
- Stacked area
- Pie
- Single value
- Table
- Top list
- Heatmap
- Honeycomb
Some visualizations, such as heatmaps, can display only one metric. Others, such as tables, can display more than one metric.
Interactivity
Interactivity of visualization tiles varies by visualization, but most tiles share these capabilities:
- Hover over an element, such as a line or a slice of pie, to see details in a tooltip.
- Select an element and then select a button in the tooltip to drill down for details. For example, in a visualization showing a line for each host, select a point on a line and then select View host to drill down to that host's page.
- Select a legend entry to show or hide the corresponding element on the visualization.
- Use the tile menu in the upper-right corner:
- Configure tile in Data Explorer opens the tile in Data Explorer, where you can configure the query and visualization.
- Edit tile, if you have edit rights, opens the dashboard in edit mode with the current tile selected.
Settings: tile title, custom timeframe, management zone, environment.
Context
Use the context tiles (Header, Markdown, and Image) to explain your dashboard contents and add graphics such as company logos. Context tiles are particularly important on dashboards you share with others.
Header
Puts a bold label over another tile.
Markdown
Customizes and describes your dashboard, such as what it does and how to use it. A markdown tile holds up to 1,000 characters.
| Element | Syntax | Notes |
|---|---|---|
Headings |
| All six heading levels |
Horizontal line |
| Separates sections of the tile |
Line break | Two spaces at the end of a line | Forces a line break |
Bold |
| Displays text in bold |
Lists |
| Numbered and bulleted lists can be mixed and nested |
Link to a URL |
| Label in square brackets, absolute URL in parentheses |
Link to a Dynatrace page |
| Target is the part of the browser address line after the domain and slash, and can be another dashboard |
Link to the Hosts table |
| Opens the Dynatrace Hosts table |
Image
Adds images to your dashboards to improve their appearance and customize them for presentations.
- Supported file types: JPG/JPEG, GIF, PNG, WEBP, TIFF, BMP, SVG
- Source: an uploaded image, or a URL that matches a rule in Settings > Dashboards > Allowed URL pattern rules
- Allowlist rules: Starts with allows any image whose URL starts with the pattern, and Exact allows only the image whose URL matches the pattern exactly
Unlike other tiles, an image tile isn't refreshed automatically. Refresh the dashboard manually to update its image tiles.
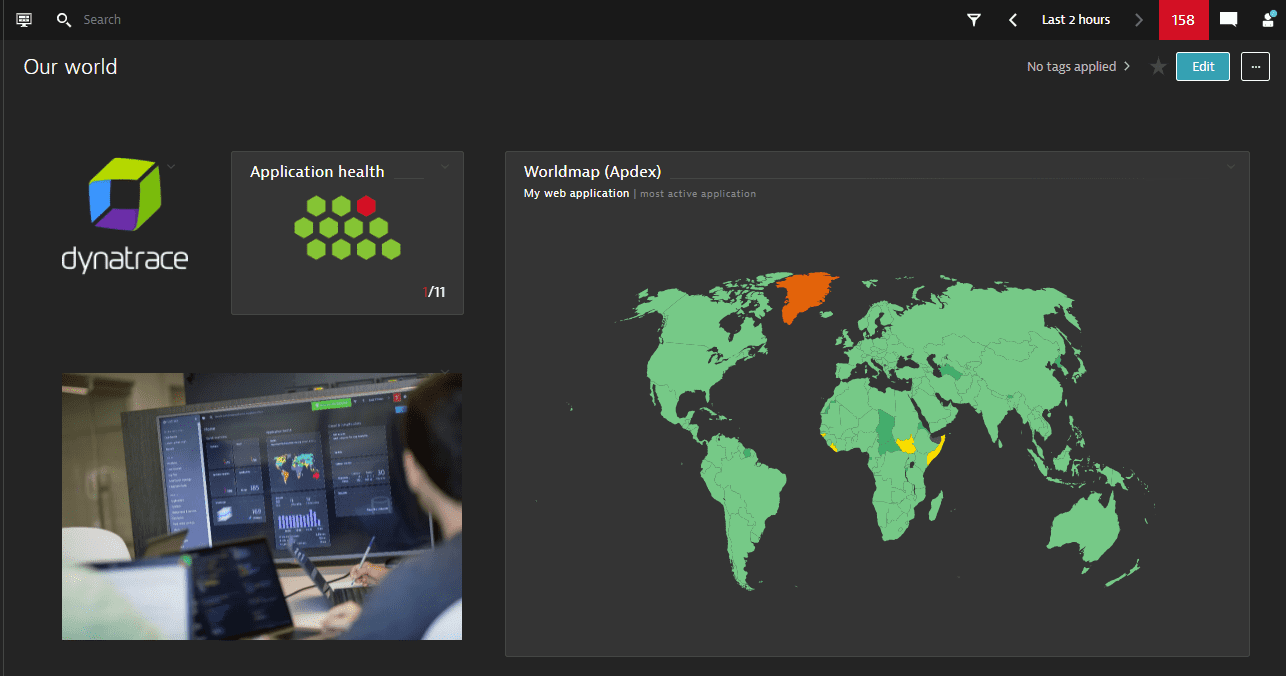
Infrastructure
Host health
Displays the number of hosts (operating system instances, whether physical or virtual) in your environment compared to the number of hosts that are currently affected by problems. Each host instance equates to a Dynatrace OneAgent installed in your environment.
Drilldowns: see Health tile drilldowns. Pinning from Hosts keeps the filters, and selecting the tile opens the Hosts page with them applied.
Settings: show visualization, custom timeframe, management zone, environment.
Network metrics
Displays network health metrics for traffic flowing through your monitored hosts: current traffic volume and the quality of communication of both new (Connectivity) and established sessions (Retransmissions).
Drilldowns: View details opens the Host networking page.
Settings: custom timeframe, management zone, environment.
Network status
Displays current network traffic flowing through your monitored hosts: traffic volume, number of nodes (Talkers) exchanging network traffic, and number of nodes experiencing performance problems (Processes and Hosts).
Drilldowns: View details opens the Host networking page.
Settings: show visualization, custom timeframe, management zone, environment.
Docker
Displays the current number of Docker containers and images compared to last week, plus the current number of Docker hosts.
Drilldowns: View details opens the Docker page.
Settings: custom timeframe, management zone, environment.
VMware
Displays basic indicators of the virtualized infrastructure in your environment, including the number of VMs, migration events, and their trends, and the number of ESXi hosts (standalone or managed by attached vCenter servers) against the number of ESXi hosts currently affected by problems. With multiple vCenter or ESXi hosts attached, the data can be aggregated or shown for a selected entity.
Drilldowns: View details opens the VMware page.
Settings: custom timeframe, environment.
AWS
Displays insights and health indicators of three services running under your AWS account: Elastic Compute Cloud (EC2) instances, Elastic Block Storage (EBS), and Classic Load Balancer (ELB).
Drilldowns: View details opens the AWS page.
Settings: AWS account (required), custom timeframe, environment.
Services
Service health
Displays an overview of all services monitored by Dynatrace, including the number of services experiencing performance degradation. The high-level view suits management dashboards. For a last X timeframe, the tile shows the most recent time slot of data. For other timeframe types, it shows the average value within the timeframe.
Drilldowns: see Health tile drilldowns. Pinning from Services keeps the filters, and selecting the tile opens the Services page with them applied.
Settings: show visualization, custom timeframe, management zone, environment.
Service or request
Displays current key performance indicators of the selected service or request (requests per minute, failure rate, and response time) in a resizable tile.
Drilldowns: View details opens the selected service or request details page.
Settings: service type, service, and key request (required), custom timeframe, environment.
Applications
Top web applications
Displays load details of up to three web applications in your environment that have the highest user action rate. Current values are compared against baseline measurements when available, and performance threshold violations are colored red.
Drilldowns: View details opens the Applications page filtered by web applications, plus any filters set on the tile when it was pinned from the Applications page.
Settings: management zone.
Application health
Displays the total number of applications in your environment versus the number of applications that are currently affected by problems.
Drilldowns: see Health tile drilldowns. Pinning from Custom Applications, Frontend, Mobile, or Web keeps the filters, and selecting the tile opens the Applications page with them applied.
Settings: show visualization, custom timeframe, management zone, environment.
User behavior
Displays key user behavior indicators of the selected application (active sessions per minute, actions per session, and session duration) over the timeframe.
Drilldowns: View details opens the selected application's user behavior section.
Settings: application (required), custom timeframe, environment.
User breakdown
Displays a user type breakdown (doughnut) by real users, robots, and monitors, and visualizes new versus returning users over the timeframe.
Drilldowns: View details opens the selected application's user behavior section.
Settings: application (required), custom timeframe, environment.
World map
Displays a geographic map of the selected metric for the selected application.
The timeframe of a world map tile is always Last 2 hours, regardless of the global or dashboard timeframe. To see a different timeframe, drill down to the full world map and change the timeframe there.
Drilldowns: select the tile or select View details to open the full-sized world map page for the selected metric and location.
Settings, all required:
- Application, or
Most active application - Geolocation
- One metric, either a performance metric based on user actions (Apdex, user actions, load actions, XHR actions, custom actions, or errors) or a behavior metric based on sessions or users (active sessions, active users, actions per session, bounce rate, or session duration)
If the world map shows no data, you might need to map your internal IP addresses to locations for your web, mobile, and custom applications.
Key user action overview
Displays an overview of the selected application's key user actions and any corresponding open problems.
Drilldowns: View details opens the user action analysis page for the selected application with a full list of key user actions.
Settings: application (required), custom timeframe, environment.
Bounce rate
Displays the current bounce rate compared with yesterday, and the number of entry actions.
Drilldowns: View details opens the selected application's bounce rate analysis.
Settings: application (required), custom timeframe, environment.
Top conversion goals
Displays the overall conversion rate and the top five goals of the selected application. The tile also serves as a direct link to the application's goals view.
Drilldowns: View details opens the selected application's Conversion page.
Settings: application (required), custom timeframe, environment.
Conversion goal
Displays the overall conversion rate and completions for the selected goal. The tile also serves as a direct link to the application's goals view.
Drilldowns: View details opens the selected application's goals view.
Settings: application and goal (required), custom timeframe, environment.
JavaScript errors
Displays JavaScript error indicators of the selected application (JavaScript errors per minute and percentage of affected user actions).
Drilldowns: View details opens Compare JavaScript errors for the selected application.
Settings: application (required), custom timeframe, environment.
Resources
Displays load details for application-specific resources, grouped by first-party, third-party, and CDN resources.
Drilldowns: View details opens the application details page with Resources selected.
Settings: application and metric, Count per minute or Load time (required), custom timeframe, environment.
Most used 3rd parties
Displays load details of the three third-party content providers that your application uses most frequently.
Drilldowns: View details opens the application details page with Resources selected.
Settings: application and metric, 3rd party, CDN, or 1st party (required), custom timeframe, environment.
Mobile app
Displays key performance indicators of the selected mobile app (users, crash-free user rate, and number of crashes).
Drilldowns: View details opens the selected mobile app page.
Settings: mobile app (required), custom timeframe, environment.
Custom application
Displays key performance indicators of the selected custom application (users, crash-free user rate, and number of crashes).
Drilldowns: View details opens the selected custom application page.
Settings: custom application (required), custom timeframe, environment.
Live user activity
Displays the number of current live users overall, and the applications with the most live users.
Drilldowns: View details opens User sessions filtered for Live: Yes and User type: Real users.
Settings: custom timeframe, management zone, environment.
Web application
Displays key performance indicators of the selected application: Apdex rating, user actions per minute, and number of JavaScript errors per minute.
Drilldowns: View details opens the selected application page.
Settings: application (required), custom timeframe, environment.
Key user action
Displays key performance indicators of the selected application and key user action: user action duration, user actions per minute, and number of errors per minute.
Drilldowns: View details opens the page of the selected key user action.
Settings: application and key user action (required), custom timeframe, environment.
User sessions query
Displays the result of an advanced query on completed user sessions, written in the user sessions query language.
Drilldowns: View details opens the user sessions query page for the query.
Settings: query (required), custom timeframe, management zone, environment.
Service-level objectives
Service-level objective
Displays the title, status, error budget, and target of the selected SLO. Status and error budget are numeric values shown in green (good), yellow (warning), red (bad), or gray (no data). For details, see Configure and monitor service-level objectives with Dynatrace.
Drilldowns: View details opens the Service-level objectives page filtered to the selected SLO.
Settings:
- SLO (required)
- Title
- Max shown decimals
- Show metric names
- Show legend
- Show problems indicator
- Colorize based on status
- Custom timeframe and environment
Synthetic
Browser monitor
Displays key performance indicators of the selected browser monitor (availability, duration, and location status).
Drilldowns: View details opens the selected browser monitor page.
Settings: browser monitor (required), exclusion of maintenance windows from availability calculations, custom timeframe, environment.
Synthetic monitor health
Displays the number of active synthetic monitors in your environment against the number of synthetic monitors that are currently affected by problems.
Drilldowns: see Health tile drilldowns. Pinning from Synthetic Classic keeps the filters, and selecting the tile opens the Synthetic page with them applied.
Settings: show visualization, custom timeframe, management zone, environment.
Third-party monitor
Displays key performance indicators of the selected third-party monitor (availability, duration, and location status).
Drilldowns: View details opens the selected third-party monitor page.
Settings: third-party monitor (required), custom timeframe, environment.
HTTP monitor
Displays key performance indicators of the selected HTTP monitor (availability and duration).
Drilldowns: View details opens the selected HTTP monitor page.
Settings: HTTP monitor (required), custom timeframe, environment.
Databases
Database health
Displays the number of databases in your environment against the number of databases that are currently affected by problems.
Drilldowns: see Health tile drilldowns.
Settings: show visualization, custom timeframe, management zone, environment.
Database performance
Displays key performance indicators of the selected database service (commits per hour, statements per minute, and response time).
Drilldowns: View details opens the selected database service page.
Settings: database service (required), custom timeframe, environment.
Integrations
Data center service health
Displays the total number of data center services in your environment against the number of data center services that are currently affected by problems.
Drilldowns: see Health tile drilldowns.
Settings: custom timeframe, management zone, environment.
Analysis
Problems
Displays the number of problems that are currently watched and active against the number of resolved problems in your environment. When a problem is active, the problem count is red.
Drilldowns: View details opens your Problems feed.
Settings: custom timeframe, management zone, environment.
Smartscape
Visualizes your environment components based on Smartscape analysis. The tile cycles through the five Smartscape layers: applications, services, OS processes, hosts, and data centers. For each layer, it shows the total number in your environment and, in red, the number currently affected by problems.
Drilldowns: View details opens the Smartscape topology view at the Services layer.
Settings: custom timeframe, management zone, environment.
Log query table
Displays log events matching a log data query. The table shows only the columns configured in Log Viewer with Table options for that query.
Settings: log query (required), table columns, custom timeframe, management zone, environment.