Create a dashboard
- How-to guide
- 8-min read
To build a dashboard, follow the steps below.
To edit an existing dashboard, go to Dashboards, select the name of the dashboard, select Edit in the upper-right corner, and continue with adding tiles; if you don't see an Edit option, you don't have permission to edit that dashboard. To delete a whole dashboard, see Organize dashboards.

Create the dashboard

Add tiles

Configure tiles

Set dashboard defaults

Edit the dashboard JSON

Print to PDF
Create the dashboard
Start with an empty dashboard, clone an existing one, or import a dashboard definition from a JSON file.
Create an empty dashboard
- Go to Dashboards.
- Select Create Dashboard.
- Enter a name for your dashboard and select Create.
The new dashboard opens in edit mode.
Clone an existing dashboard
You can't customize or share dashboards for which you have only viewing permission, but you can clone them and then modify and share the clones. You also can't edit preset dashboards directly. Clone one to start from a more elaborate example. The clone gets -cloned appended to the dashboard name.
- Go to Dashboards.
- Clone the dashboard in one of these ways:
- In the table of dashboards, select More (:more:) > Clone for the dashboard you want to copy.
- Open the dashboard, select More (:more:) in the upper-right of the dashboard, and select Clone.
The copy opens in edit mode, and the original dashboard stays unchanged.
Import a dashboard from a JSON file
Importing adds a new dashboard. To overwrite an existing dashboard instead, edit its JSON offline.
- Optional: To start from an existing dashboard definition, export it. Go to Dashboards and, in the table of dashboards, select More (:more:) > Export for the dashboard you want to export. The dashboard definition is exported as a JSON file to your computer.
- Optional: Edit the dashboard JSON in your preferred development environment. For JSON syntax details, see the Dashboards API documentation.
- Go to Dashboards and select Import dashboard.
- Select the JSON file for the dashboard you want to import.
The imported dashboard opens in edit mode.
Add tiles
With the dashboard in edit mode, use the Tiles tab to change its content. For the full list of tile types, see Available tiles. You can also pin tiles to the dashboard from other Dynatrace pages.
-
Drag a tile from the Tiles pane to your dashboard.
To see a description of a tile, drag it to your dashboard and then refer to the description on the tile configuration panel.
-
Optional: Add a header tile to put a bold label over other tiles.
- Drag a Header tile into position. For example, create a header above three related tiles.
- Select the edit control on the header tile and edit the header text.
- Size the header tile, and then select the check mark on the header tile.
The header tile remains independent. You can move and resize it to label more than one tile with a single header.
-
Optional: Add a Markdown tile to describe what the dashboard does and how to use it. Each Markdown tile holds up to 1,000 characters.
-
Optional: Add an image tile that shows an uploaded image.
- Drag an Image tile into position.
- On the Image panel, select the Upload an image tab.
- Select Upload image, then browse for and select the image file you want to display in the tile.
- Size and position the tile as needed.
Supported image file types are JPG/JPEG, GIF, PNG, WEBP, TIFF, BMP, and SVG. Unlike other tile types, an image tile isn't refreshed automatically. Refresh the dashboard manually to update its image tiles.
-
Optional: Add an image tile that points to an image URL.
Before you can add an image by URL, you need to add the URL to the allowlist.
- Go to Settings and select Dashboards > Allowed URL pattern rules.
- Select Add item.
- Set Rule, which specifies how to process this allowlist entry.
- Starts with: allow any image whose URL starts with the contents of Pattern.
- Exact: allow the specific image whose URL matches the contents of Pattern exactly.
- Set Pattern.
- To specify a URL start, enter enough of the URL to make sure any matching image URLs are suitable for your dashboards. For example, enter
https://example.com/images/to allowhttps://example.com/images/image-x.jpgandhttps://example.com/images/my-picture.svg. - To specify an exact URL, enter the entire URL of the image. For example, enter
https://example.com/images/my-image-file-name.jpgto allow only that image.
- To specify a URL start, enter enough of the URL to make sure any matching image URLs are suitable for your dashboards. For example, enter
- Select Save changes to add the rule to the allowlist.
- On the dashboard in edit mode, drag an Image tile into position.
- On the Image panel, select the Add image URL tab.
- Enter the URL of the image file you want to display in the tile. The URL needs to match one of the rules on the allowlist.
- Size and position the tile as needed.
Configure tiles
With the dashboard in edit mode, select a tile to configure it. Changes to the tile configuration are reflected in the tile in real time.
-
Edit a tile's configuration. Hover over the tile, select the tile menu in the upper-right corner, and select Edit tile. Change the configuration as needed, and select Done.
-
Change the tile title. Select the tile, edit the title under Title, and select Done.
-
Override the dashboard timeframe for one tile. Select the tile, turn on Custom timeframe, select the timeframe you want to be the default for this tile, and select Done.
A filter is displayed in the upper-right of the tile. Hover over it to see the setting.
-
Override the dashboard management zone for one tile. Select the tile, turn on Custom management zone, select the management zone you want to be the default for this tile, and select Done.
A filter is displayed in the upper-right of the tile. Hover over it to see the setting.
-
Override the dashboard environment for one tile. Select the tile, select the environment for this tile under Environment, and select Done. For details on remote environments, see Create multi-environment dashboards.
A filter is displayed in the upper-right of the tile. Hover over it to see the setting.
-
Clone tiles within the dashboard. Select the tile, and then select Clone. To clone several tiles, drag a selection rectangle around them, and then select Clone x tiles. Edit the cloned tiles as needed.
-
Move tiles. Select and drag the tile to a new location. To move several tiles, drag a selection rectangle around them, and then drag the selected tiles together to a new location.
-
Resize tiles. Select the tile, and then drag its lower-right corner until the tile has the size you want. Tiles snap to the dashboard grid.
-
Delete tiles. Select the unwanted tile, select Delete, and confirm. To delete several tiles, drag a selection rectangle around them, select Delete x tiles, and confirm.
Set dashboard defaults
On the Edit dashboard pane, select the Settings tab. For the full list of settings, see Dashboard settings.
-
Set the default timeframe and default management zone for the dashboard. For how they interact with tile settings, see How dashboards scope and refresh data.
-
Set the title size to small, medium, or large for all tiles on the dashboard.
-
Use the Consistent entity colors switch to show the same entity in the same color on every tile where it appears. The switch applies only to tiles created with Data Explorer.
For example, with Consistent entity colors turned off, host A can have one color on one chart and another color on a second chart.
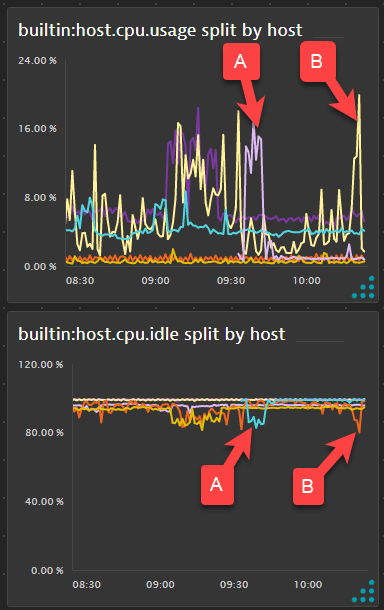 Consistent entity colors turned off
With it turned on, host A has the same color on both charts, and so does host B.
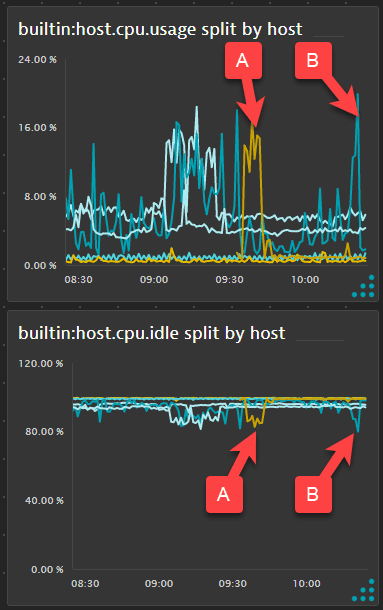 Consistent entity colors turned on
 -
Select Done.
The dashboard is displayed as it appears to you and to people you share it with. People without edit permission don't see the Edit button.
Edit the dashboard JSON
To manage dashboard JSON at scale, use the Dashboards API. For JSON syntax details, see the same documentation.
Edit offline
Uploading the edited file overwrites the dashboard whose definition you downloaded. To add the definition as a new dashboard, import it instead.
- Display the dashboard and select Edit.
- Switch to the Settings tab, select Configure more, and select Dashboard JSON.
- On the Dashboard JSON page, select Download. A JSON file with the dashboard's name is downloaded to your local machine.
- Edit the JSON in your preferred development environment.
- On the Dashboard JSON page, select Upload, and browse for and upload the edited JSON file. The uploaded JSON is displayed on the Dashboard JSON page.
- Select Save changes to replace the old JSON with your edited JSON.
- Display the dashboard to verify your changes.
Edit in place
- Display the dashboard and select Edit.
- Switch to the Settings tab, select Configure more, and select Dashboard JSON. The dashboard JSON is displayed in an edit window.
- Edit the JSON directly in the edit window, or copy and paste between it and another editor.
- The You have unsaved changes message in the lower left of the page reminds you of work in progress. Save before you navigate away from the page.
- Syntax is checked each time you save, so you can work incrementally and use Save changes to verify that the JSON still parses.
- When you're finished, display the dashboard to verify your changes.
Print to PDF
Printing a dashboard to a PDF file is supported in Chromium-based browsers (Chrome, Edge, and Opera) and Safari. Printing from Firefox isn't supported.
- Go to Dashboards and select the name of the dashboard you want to print.
- Select > Print PDF in the upper-right corner of the dashboard.
- Adjust the settings as needed.
- Destination: select Save as PDF.
- Options: select Background graphics.
- Pages: if an empty page is generated, set Pages to
Custom, and then enter1as the page range.
- Select Save, and then select a name and destination for the PDF file.
The dashboard is saved as a PDF file in the destination you selected.