Add dynamic filters to a dashboard
- How-to guide
- 4-min read
To give a dashboard a filter bar that filters all its tiles, follow the steps below.
You can add multiple dynamic filters to a dashboard. They're all displayed as filter options in the dashboard filter bar. For how several filters combine, see Filter evaluation.
If a metric has multiple entity types, management-zone filtering isn't applied. The limitation affects metrics with the dimensions dt.entity.monitored_entity or dt.entity.device_application. For details, see Filter metrics by management zone.
 Open the Dynamic filters tab
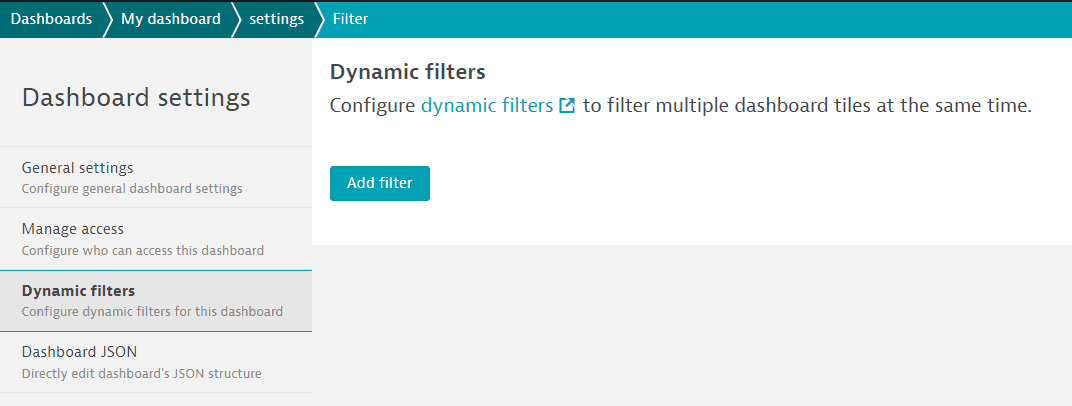
The Dynamic filters tab of the Dashboard settings page is where you define and manage filters for a dashboard. You can open it from the Dashboards table or from the dashboard itself.
From the Dashboards table
- Go to Dashboards.
- In the Dashboards table, find the dashboard you want to edit.
- Select More (…) > Configure to open Dashboard settings for that dashboard.
If you don't see a Configure entry in the menu, you don't have edit rights for the selected dashboard. - Select the Dynamic filters tab.
From the dashboard
If the dashboard has no filters yet, it displays the notice "No dynamic filters have been defined for this dashboard. Add dynamic filters or learn more." Select Add dynamic filters to go directly to the Dynamic filters tab.
If the dashboard already has filters, there's no such notice.
- Select Edit in the upper-right corner of the dashboard.
If you don't see an Edit button, you don't have edit rights for the selected dashboard. - Select the Settings tab.
- Select Configure more.
- Select Dynamic filters.
 Add filters
Custom dimension filters and generic tag filters apply only to tiles that you create in Data Explorer and pin to the dashboard. They don't apply to standard tiles that you drag to the dashboard from the Tiles pane in the dashboard editor, or that you pin to the dashboard from another page such as Hosts.
- On the Dynamic filters tab, select Add filter.
- Select a filter from the Filter criteria list.
Some filters require an additional value. When you make a selection in the Filter criteria list, Dynatrace displays an additional entry field. The sections below describe the values for each such filter. - Repeat these steps for each filter you want to add to the dashboard.
Filter by operating system
Select OS type from the Filter criteria list. The operating system filter requires no additional value.
Filter by application tag key
To filter a dashboard by tags, first tag the components in your environment to which your dashboard applies, such as applications, hosts, services, process groups, or process group instances.
-
Go to Settings and select Tags > Manually applied tags.
-
Enter key/value pairs and apply them to each application to which your dashboard applies, for example, the key
demo-key-01with the valuesdemo-value-01,demo-value-02, anddemo-value-03.Show me
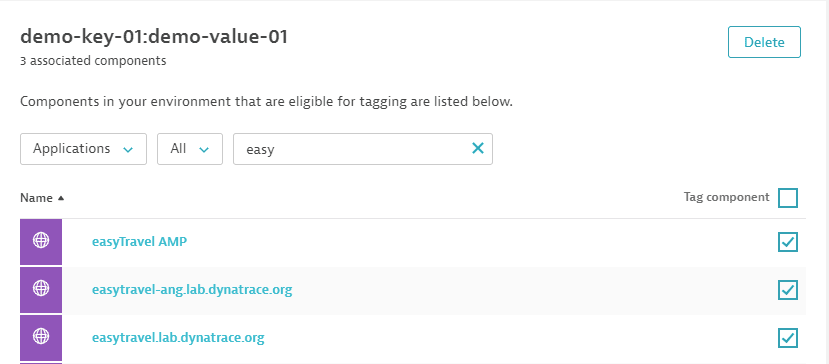 Dashboard filtering: apply demo-key-01/demo-value-01
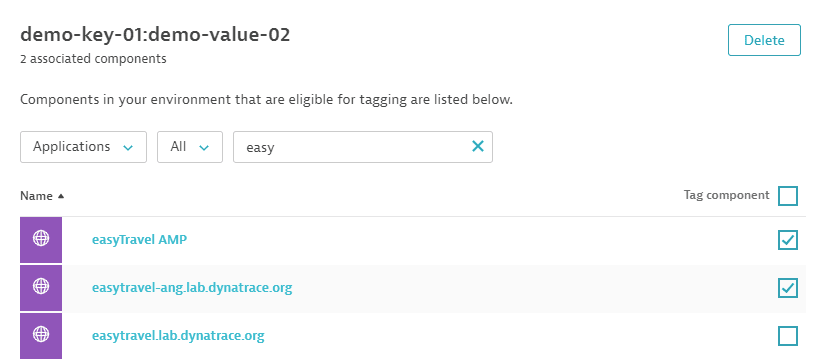 Dashboard filtering: apply demo-key-01/demo-value-02
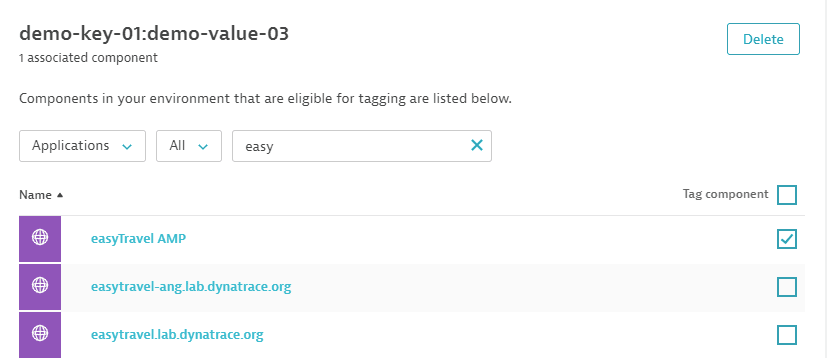 Dashboard filtering: apply demo-key-01/demo-value-03
 -
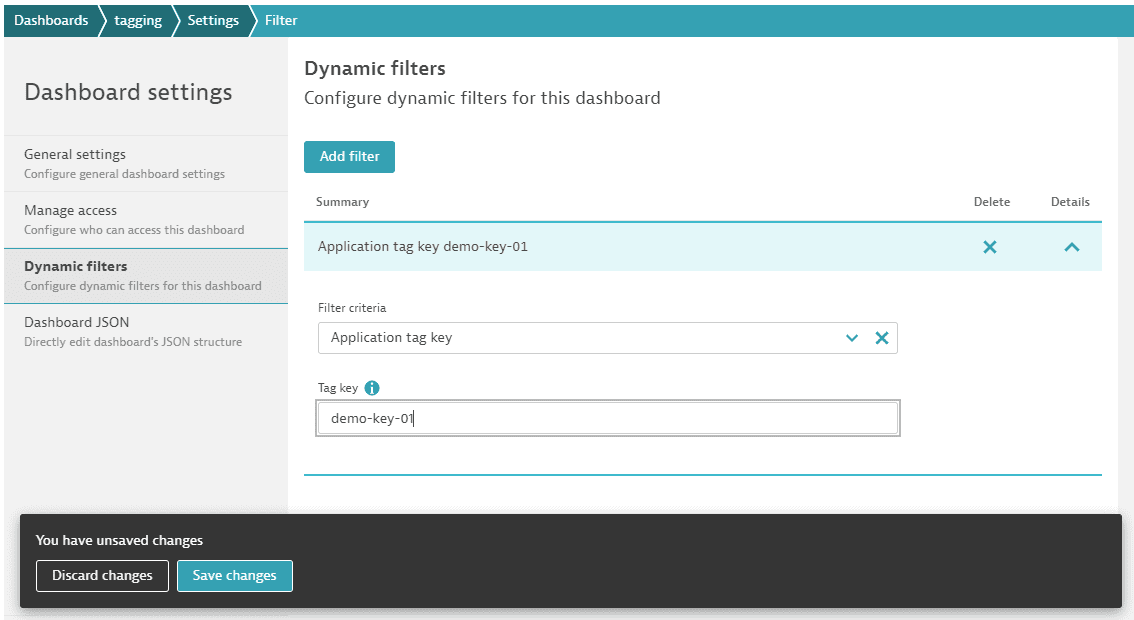
On the Dynamic filters tab, select Add filter.
-
From the Filter criteria list, select
Application tag key. -
In Tag key, enter the key you applied to your applications, for example,
demo-key-01.
Filter by custom dimension
- From the Filter criteria list, select
Custom dimension.
Dynatrace displays the Dimension key list. - Select or enter a value for Dimension key.
Filter by generic tag key
- From the Filter criteria list, select
Generic tag key. - Set Display name to a unique name that identifies this generic filter, for example,
Application name. - Set Tag key, for example,
appName. - Set Get suggestions from to define where to get tag suggestions, for example,
Host. - Under Entity types affected by tag, select Add entity type once for each kind of entity that this tag affects.
 Save and apply the filters
-
Select Save changes.
-
Display the dashboard.
The dashboard displays a filter bar under its name. With no filter set, the tiles display data for your whole environment. -
In the filter bar, select a filter, and then select a value.
For an application tag filter, select the filter, the tag key, and then a value. You can add other key/value pairs to the same filter, and you can apply a generic tag filter more than once under the same generic tag.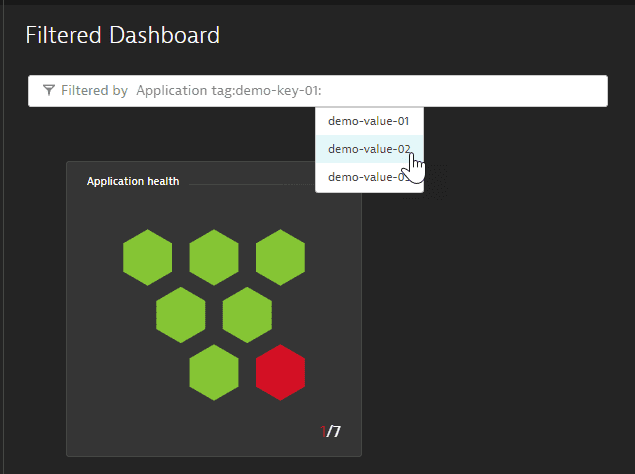 Dashboard filtering: select application tag value in dashboard
Your selection filters the dashboard tiles. For example, an operating system filter set to Windows makes the Host health tile display only the Windows hosts in the environment. If you drill down from a tile, the target page, such as Applications, opens with the selected filter applied.
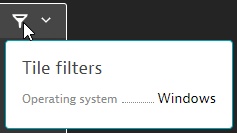
To check which filters are applied to a tile, hover over the filter icon in the upper-right corner of the tile. The tooltip lists the applied filters, such as Operating system: Windows.
What's next
- Learn how dashboard filters combine with each other and with Data Explorer filters in How dashboards scope and refresh data.
- Organize dashboards with tags, favorites, and management zones.