What's new in Dynatrace SaaS 1.347
- Release notes
- 16-min read
- Rollout start on Sep 08, 2026 (planned)
This is an ongoing summary of changes in this planned release. Check back here at GA for the final version.
This page showcases new features, changes, and bug fixes in Dynatrace SaaS version 1.347. It contains:
Application Observability | Distributed Tracing
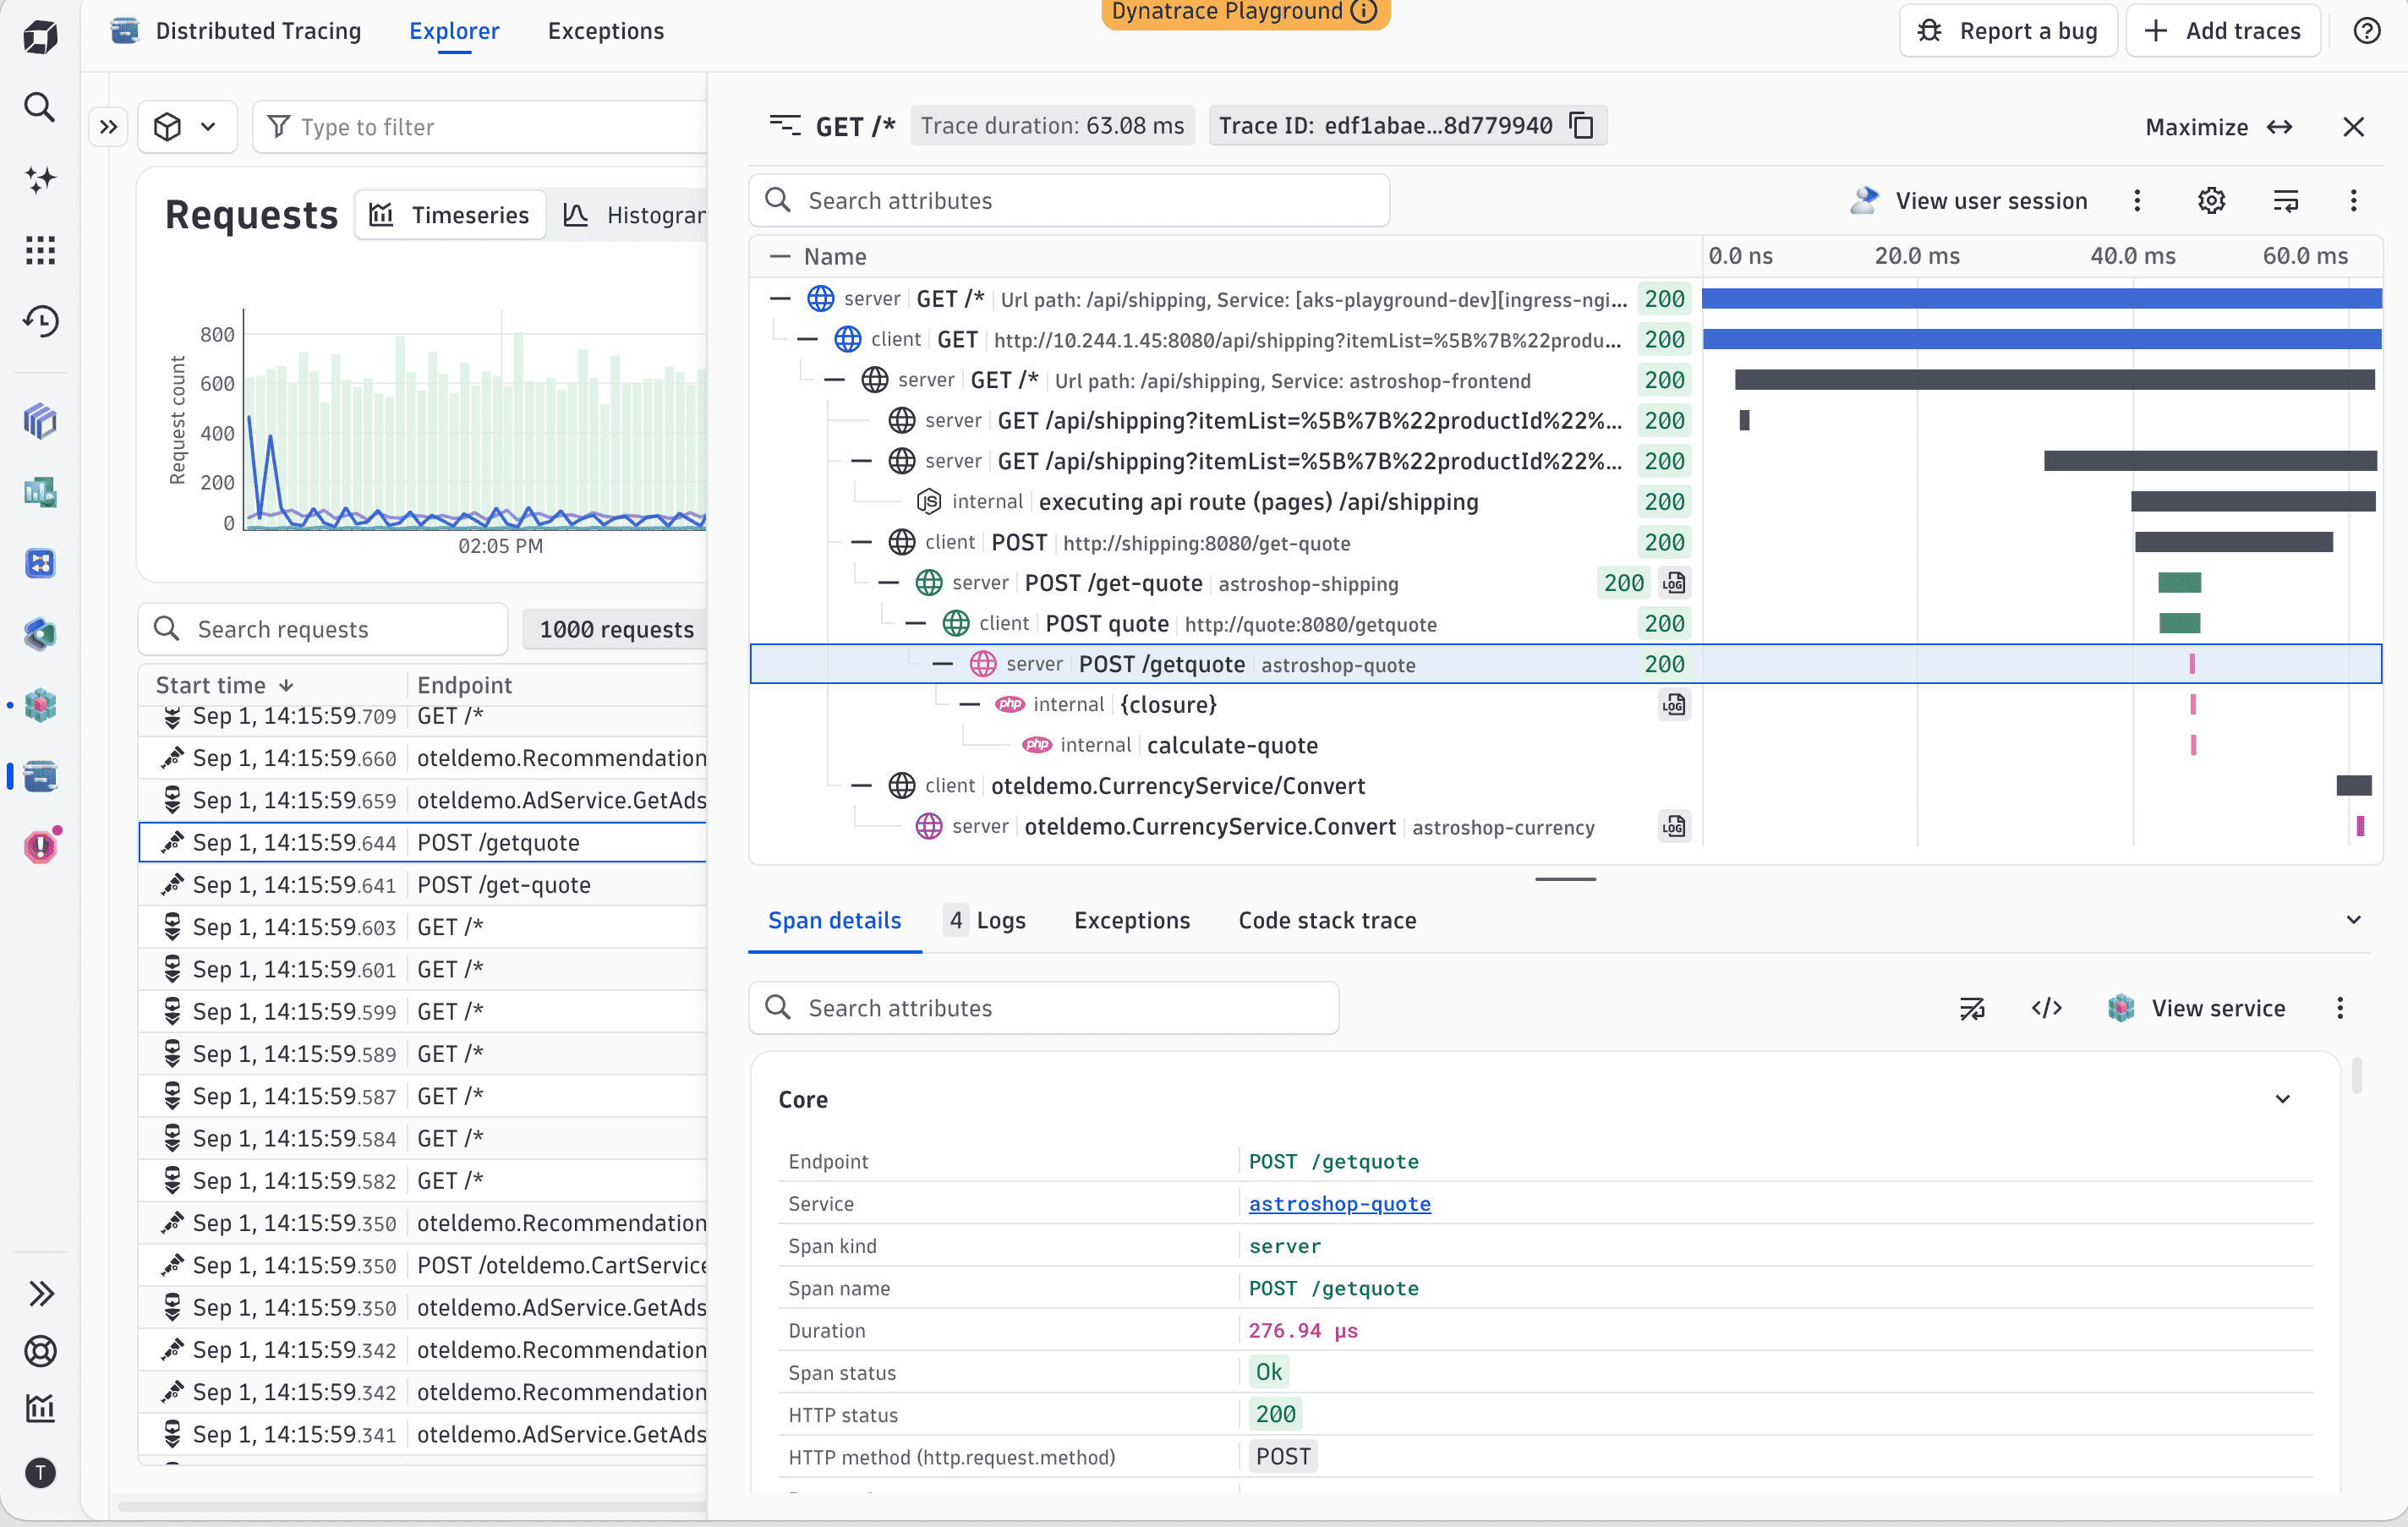
Investigate traces in a side overlay without changing or modifying your current view in  Distributed Tracing
The trace waterfall now opens as a focused side overlay directly in Distributed Tracing, so you can inspect a trace without changing or modifying your current view. The underlying view stays visible and interactive, giving you a cleaner investigation surface, and keeping your chart, filters, selection, and context visible throughout.
Feature updates
Account Management | Cost Management
Billing report no longer shows the current day in the booked-costs chart
The Billing report no longer displays the current day in the booked costs to date chart. Previously, today's cumulative cost appeared identical to yesterday's because no costs had been booked yet for the current day, which could suggest that monitoring had stopped. The chart now ends at the previous day, showing only complete, accurate data.
Account Management | Subscriptions and Licensing
Delegate Dynatrace account setup after an AWS Marketplace private offer
After accepting a private offer on AWS Marketplace, you can now delegate the Dynatrace account setup and linking process to the appropriate team member, better aligning responsibilities with customer personas and reducing onboarding friction.
Application Observability
Enhanced  QuickStart data onboarding choices and guidance
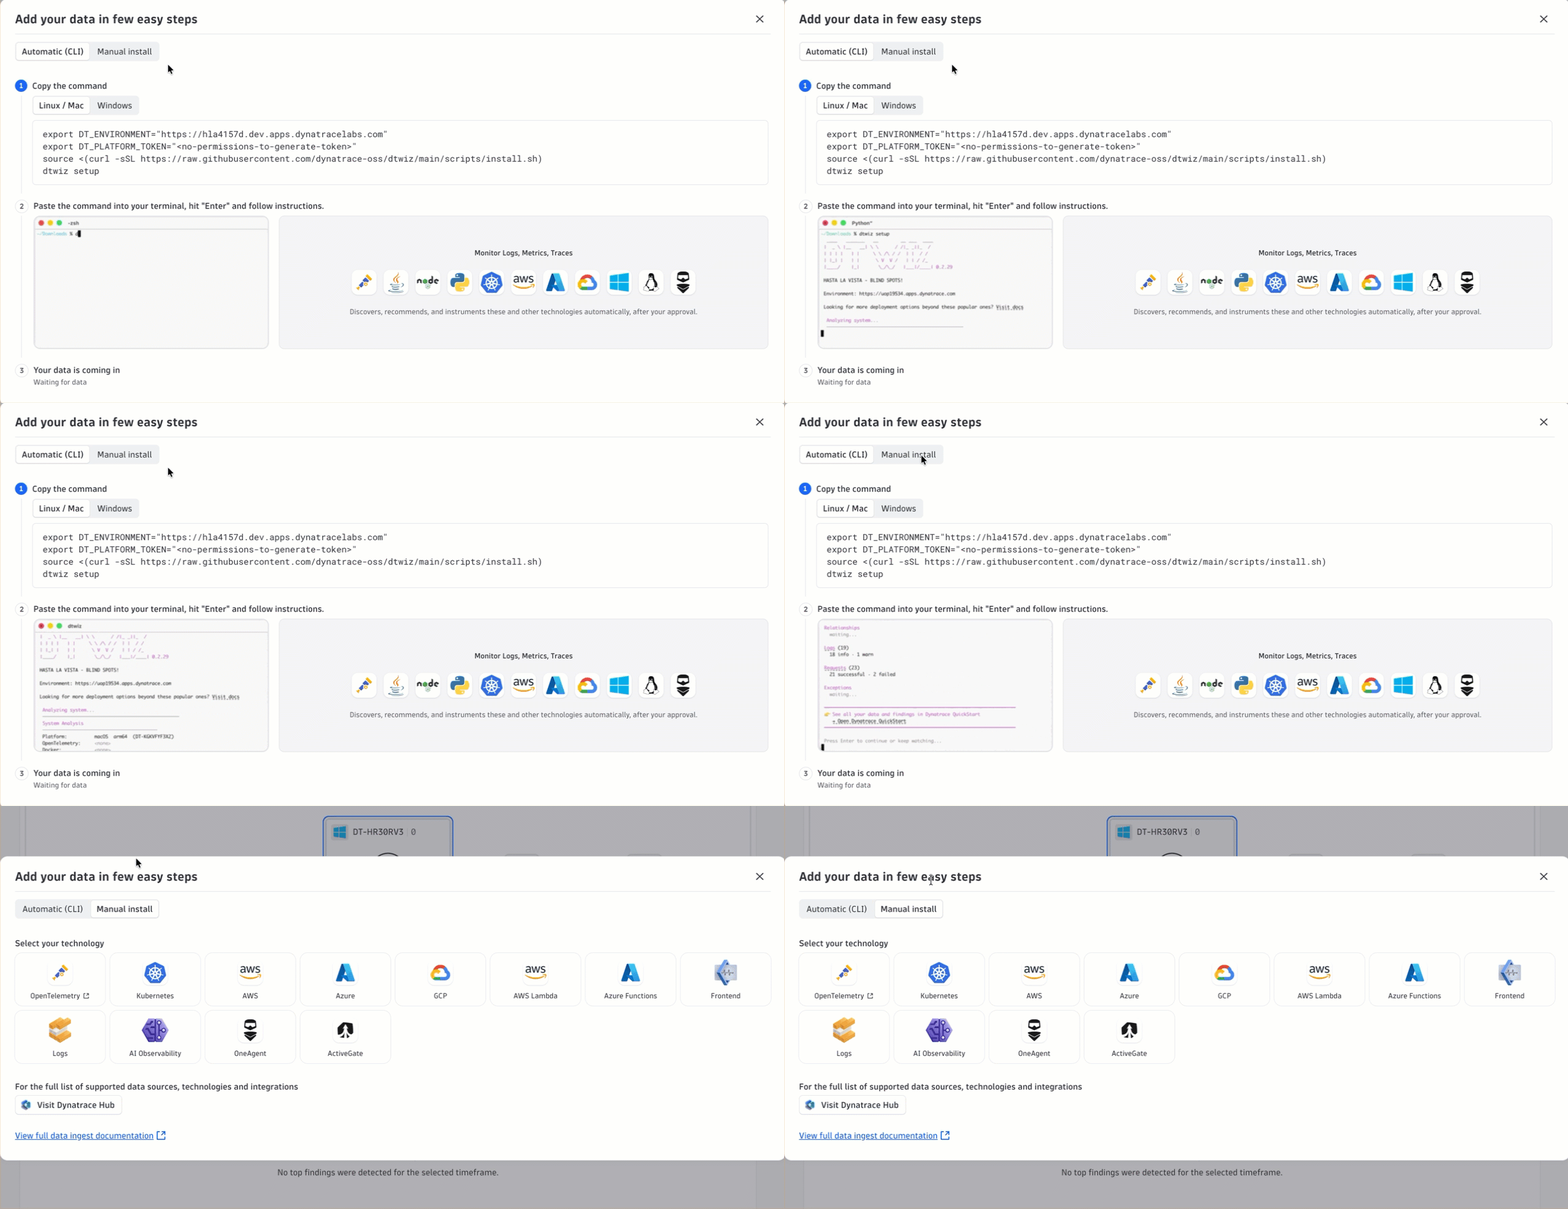
QuickStart now includes an updated guided dtwiz flow and centralized access to manual install options.
- Follow the
dtwizCLI automatic onboarding, now with a clearer explanation of the outcome. - Do you like it step by step? Find all manual data-onboarding wizards under Manual install.
- Don’t have an app at hand? Instrument the Schnitzel demo app in the
dtwiz setupto get example data flowing.
For more information, see Get started with Dynatrace QuickStart.
Application Observability
Explain findings with AI and search your services in QuickStart
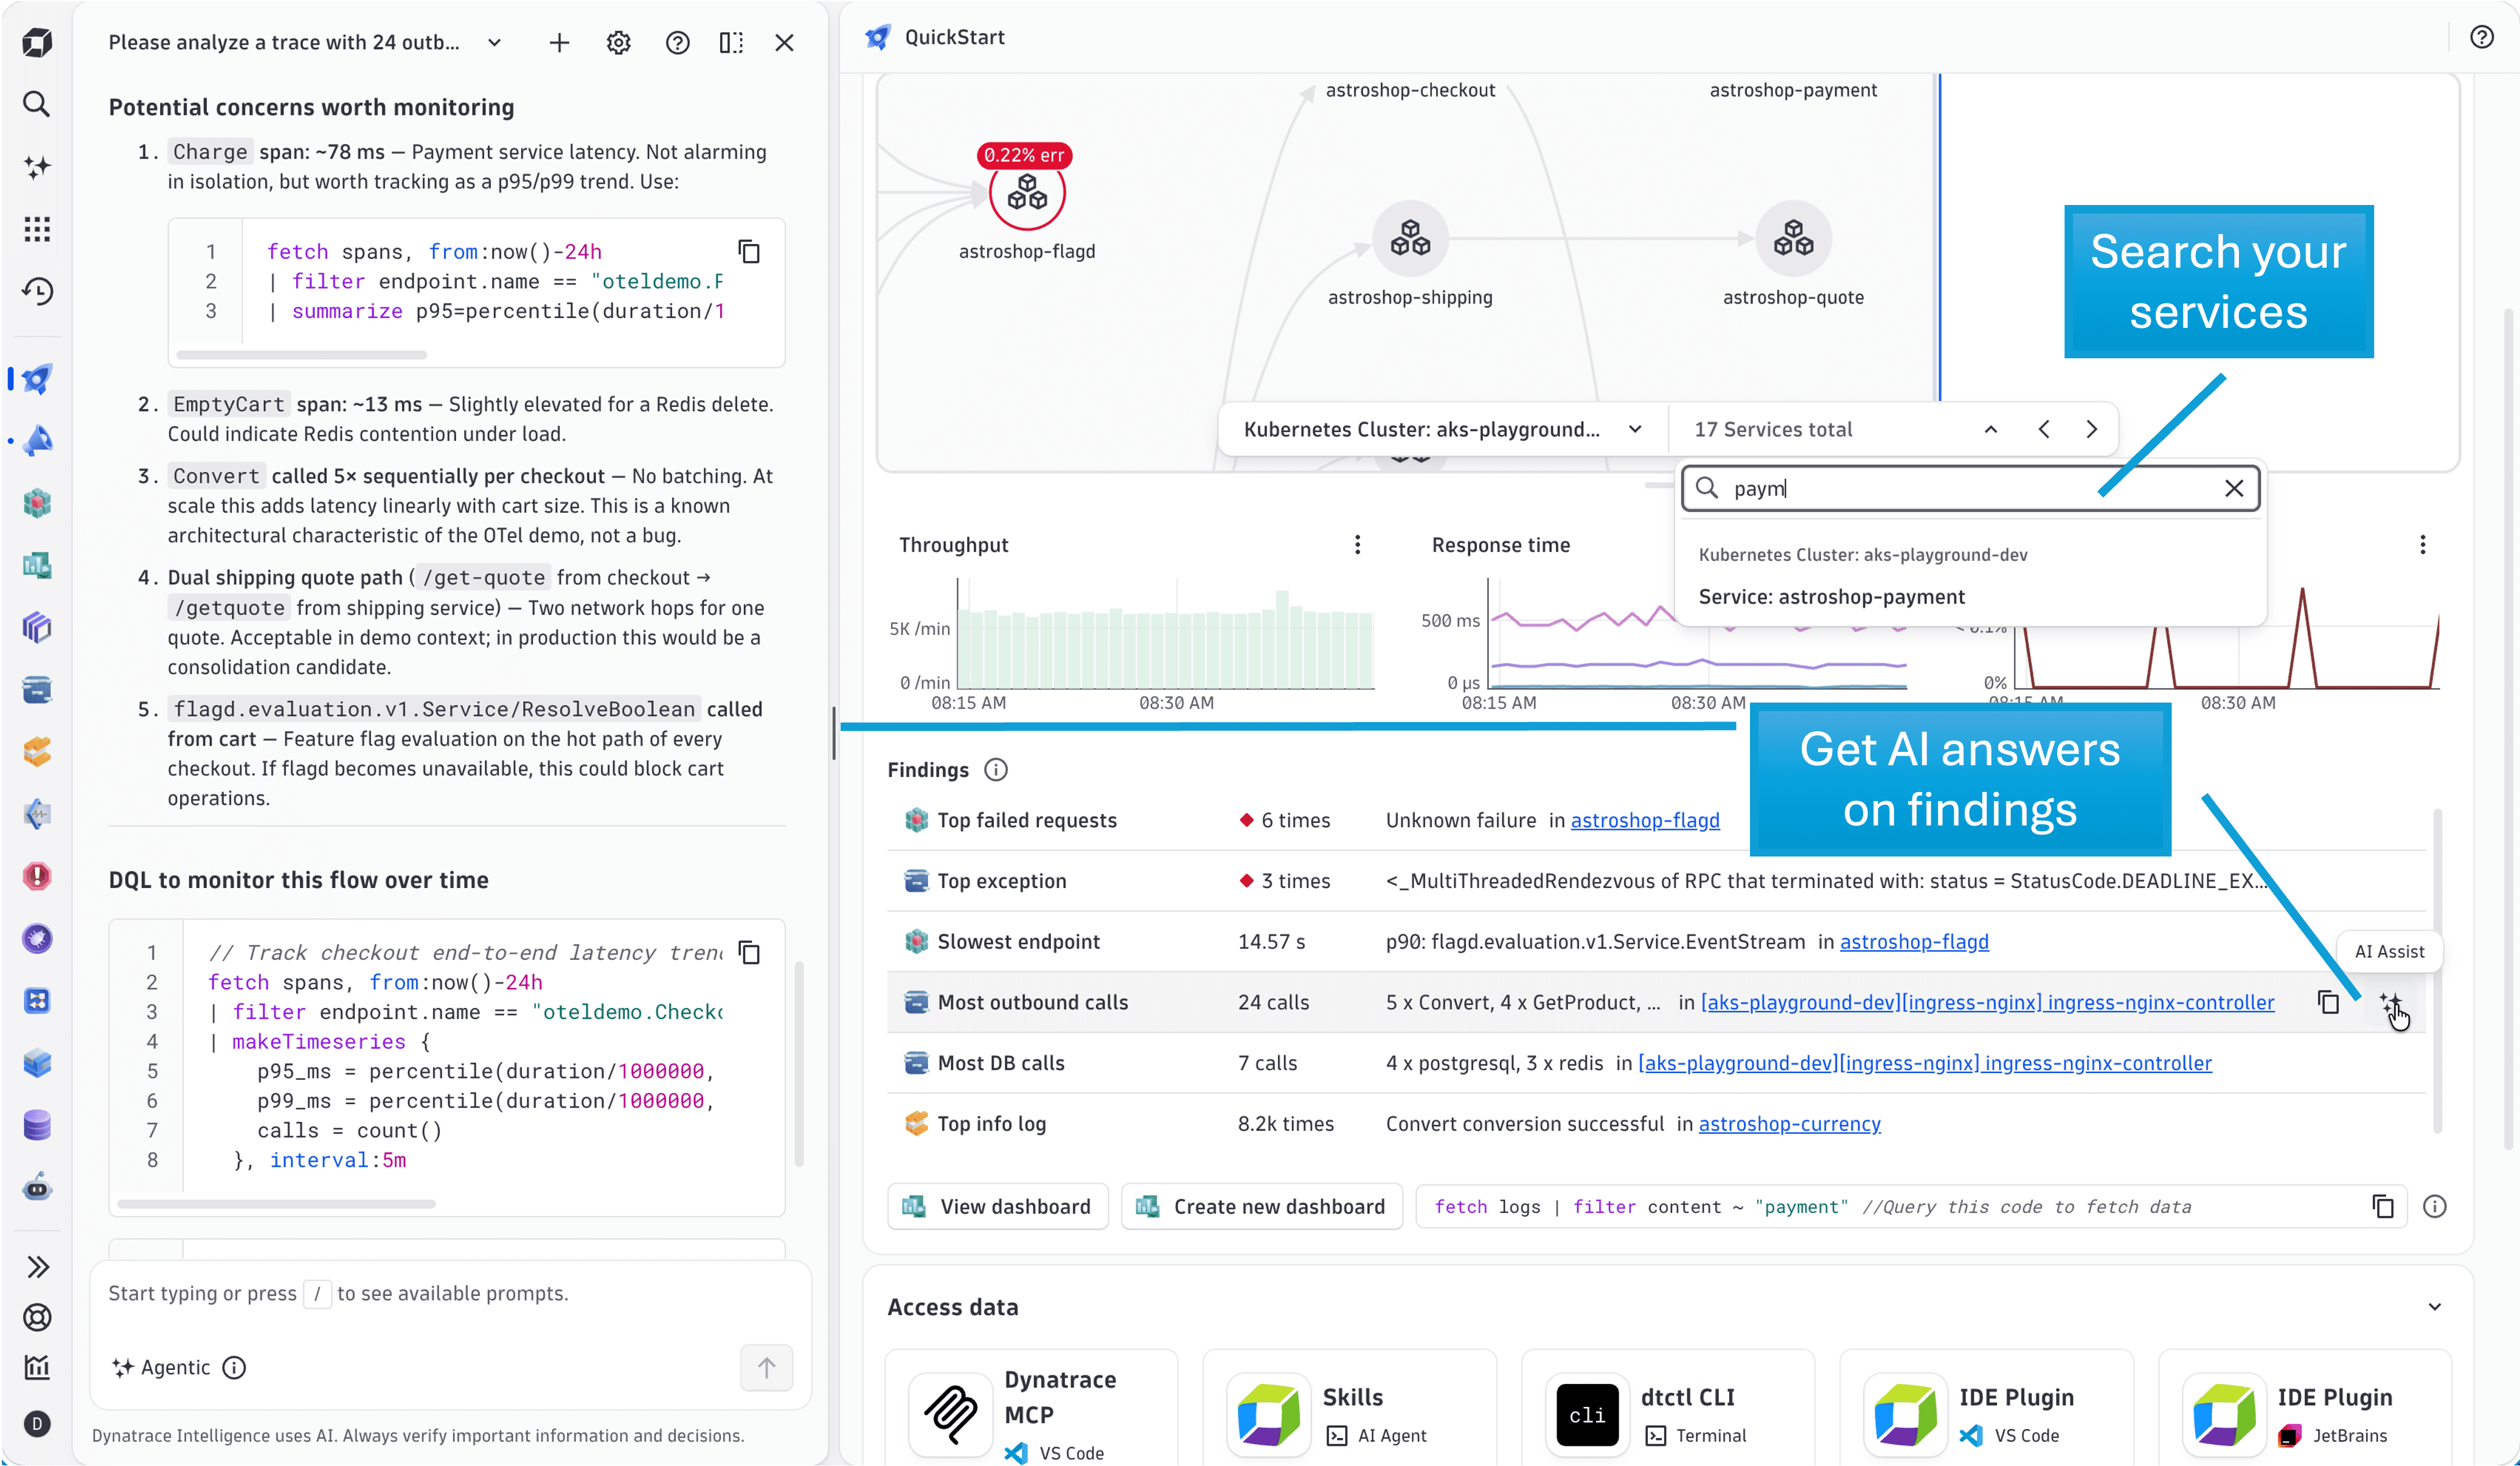
QuickStart now brings AI answers and topology search closer together:
- Select Dynatrace Assist on any of the findings to get deep insights and answers.
- Search your topology to have a quick look at the service findings of your interest.
- Experience enhancements with quicker topology loading and smoother chart refresh.
Application Observability | Live Debugger
GitLab, Bitbucket, and Azure DevOps Live Debugger integration migrated to Dynatrace Integrations organization
The GitLab, Bitbucket, and Azure DevOps OAuth applications used by Live Debugger integrations have moved from legacy Rookout organizations to official Dynatrace-owned organizations, so you now authenticate against a Dynatrace-owned OAuth application.
Application Observability | Services
Trace database statements back to their callers with  Services backtrace
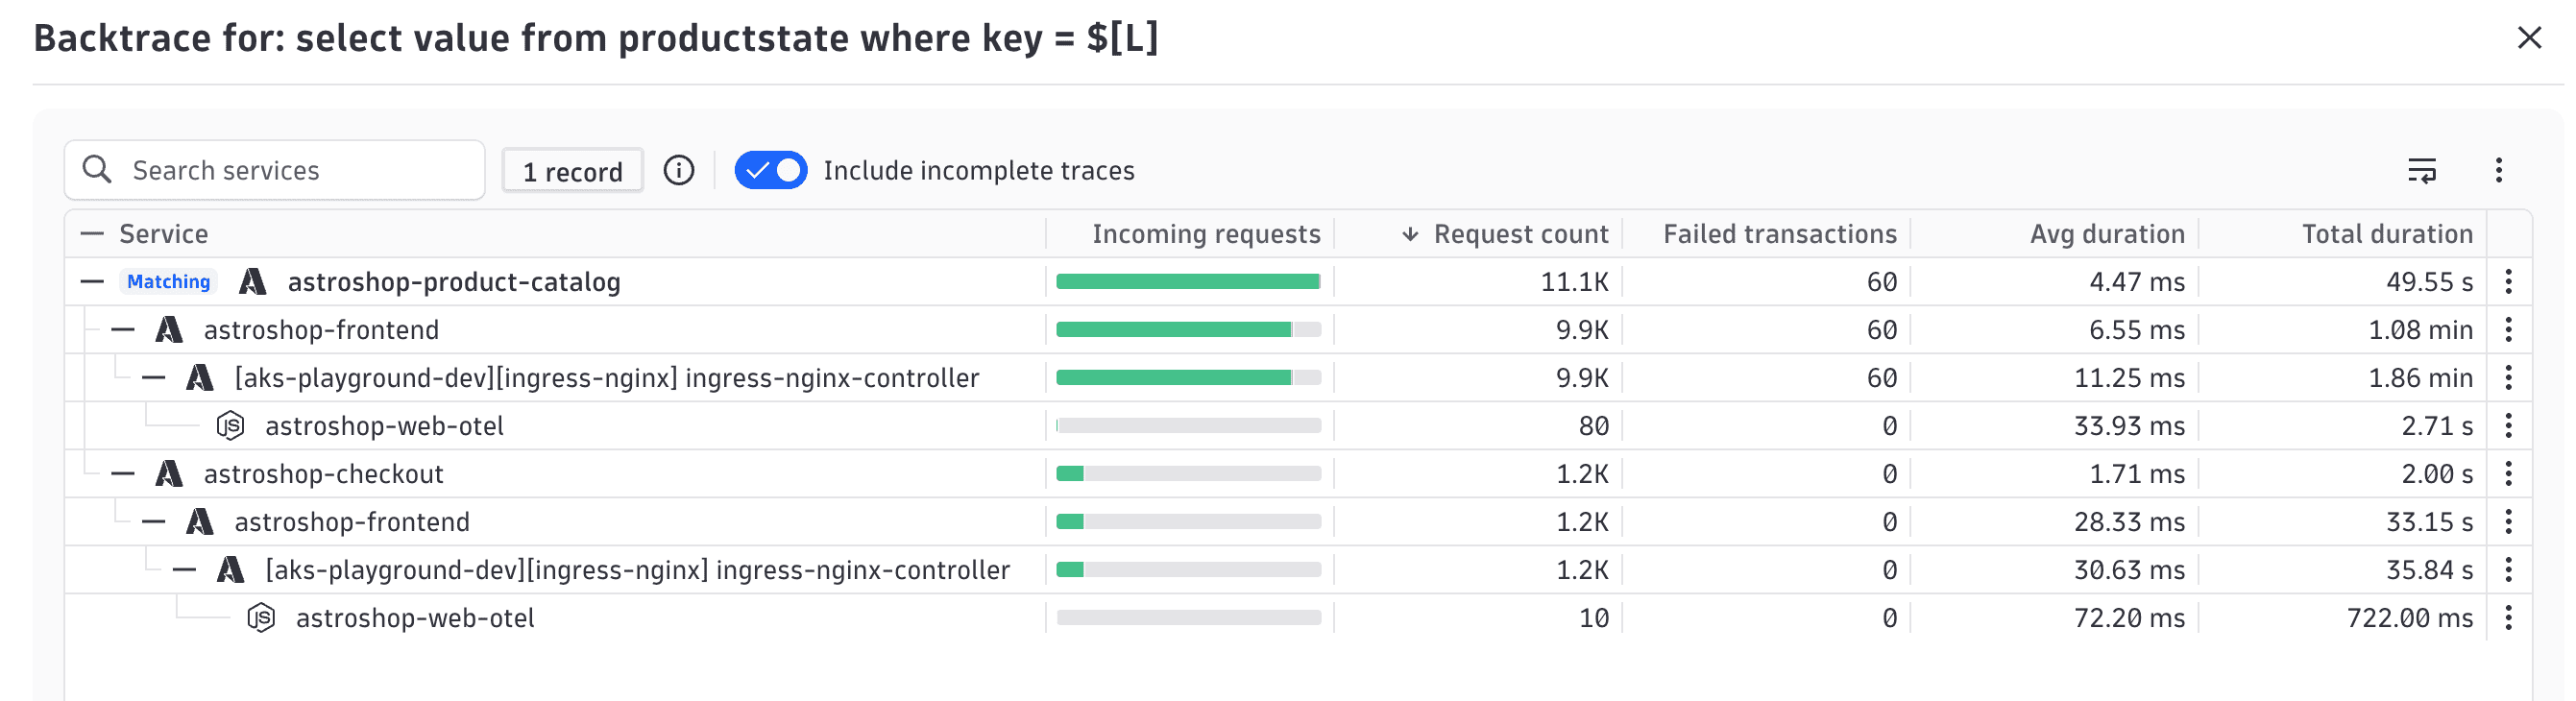
From any database statement in the Database queries view of Services, you can now open a Service backtrace to understand the upstream call chain. This allows you to see from where specific statements are triggered, how load is distributed across callers, and whether any callers carry errors.
- See which call a specific database statement a specific database statement and how the load is distributed across them.
- Spot 1:n fan-out patterns where a single upstream call triggers multiple database executions.
- Identify which upstream callers carry errors to gauge the blast radius of a failing query.
Application Security | Security Posture Management
Upgraded golang library to version 1.26.5 in Kubernetes Node Configuration Collector (NCC)
The Node Configuration Collector image now builds on Go 1.26.5 (up from 1.26.4) and upgrades golang.org/x/sys to v0.46.01. This is a maintenance update that incorporates upstream bug fixes and security patches in the Go toolchain and standard library, with no change to Collector behavior.
Infrastructure Observability
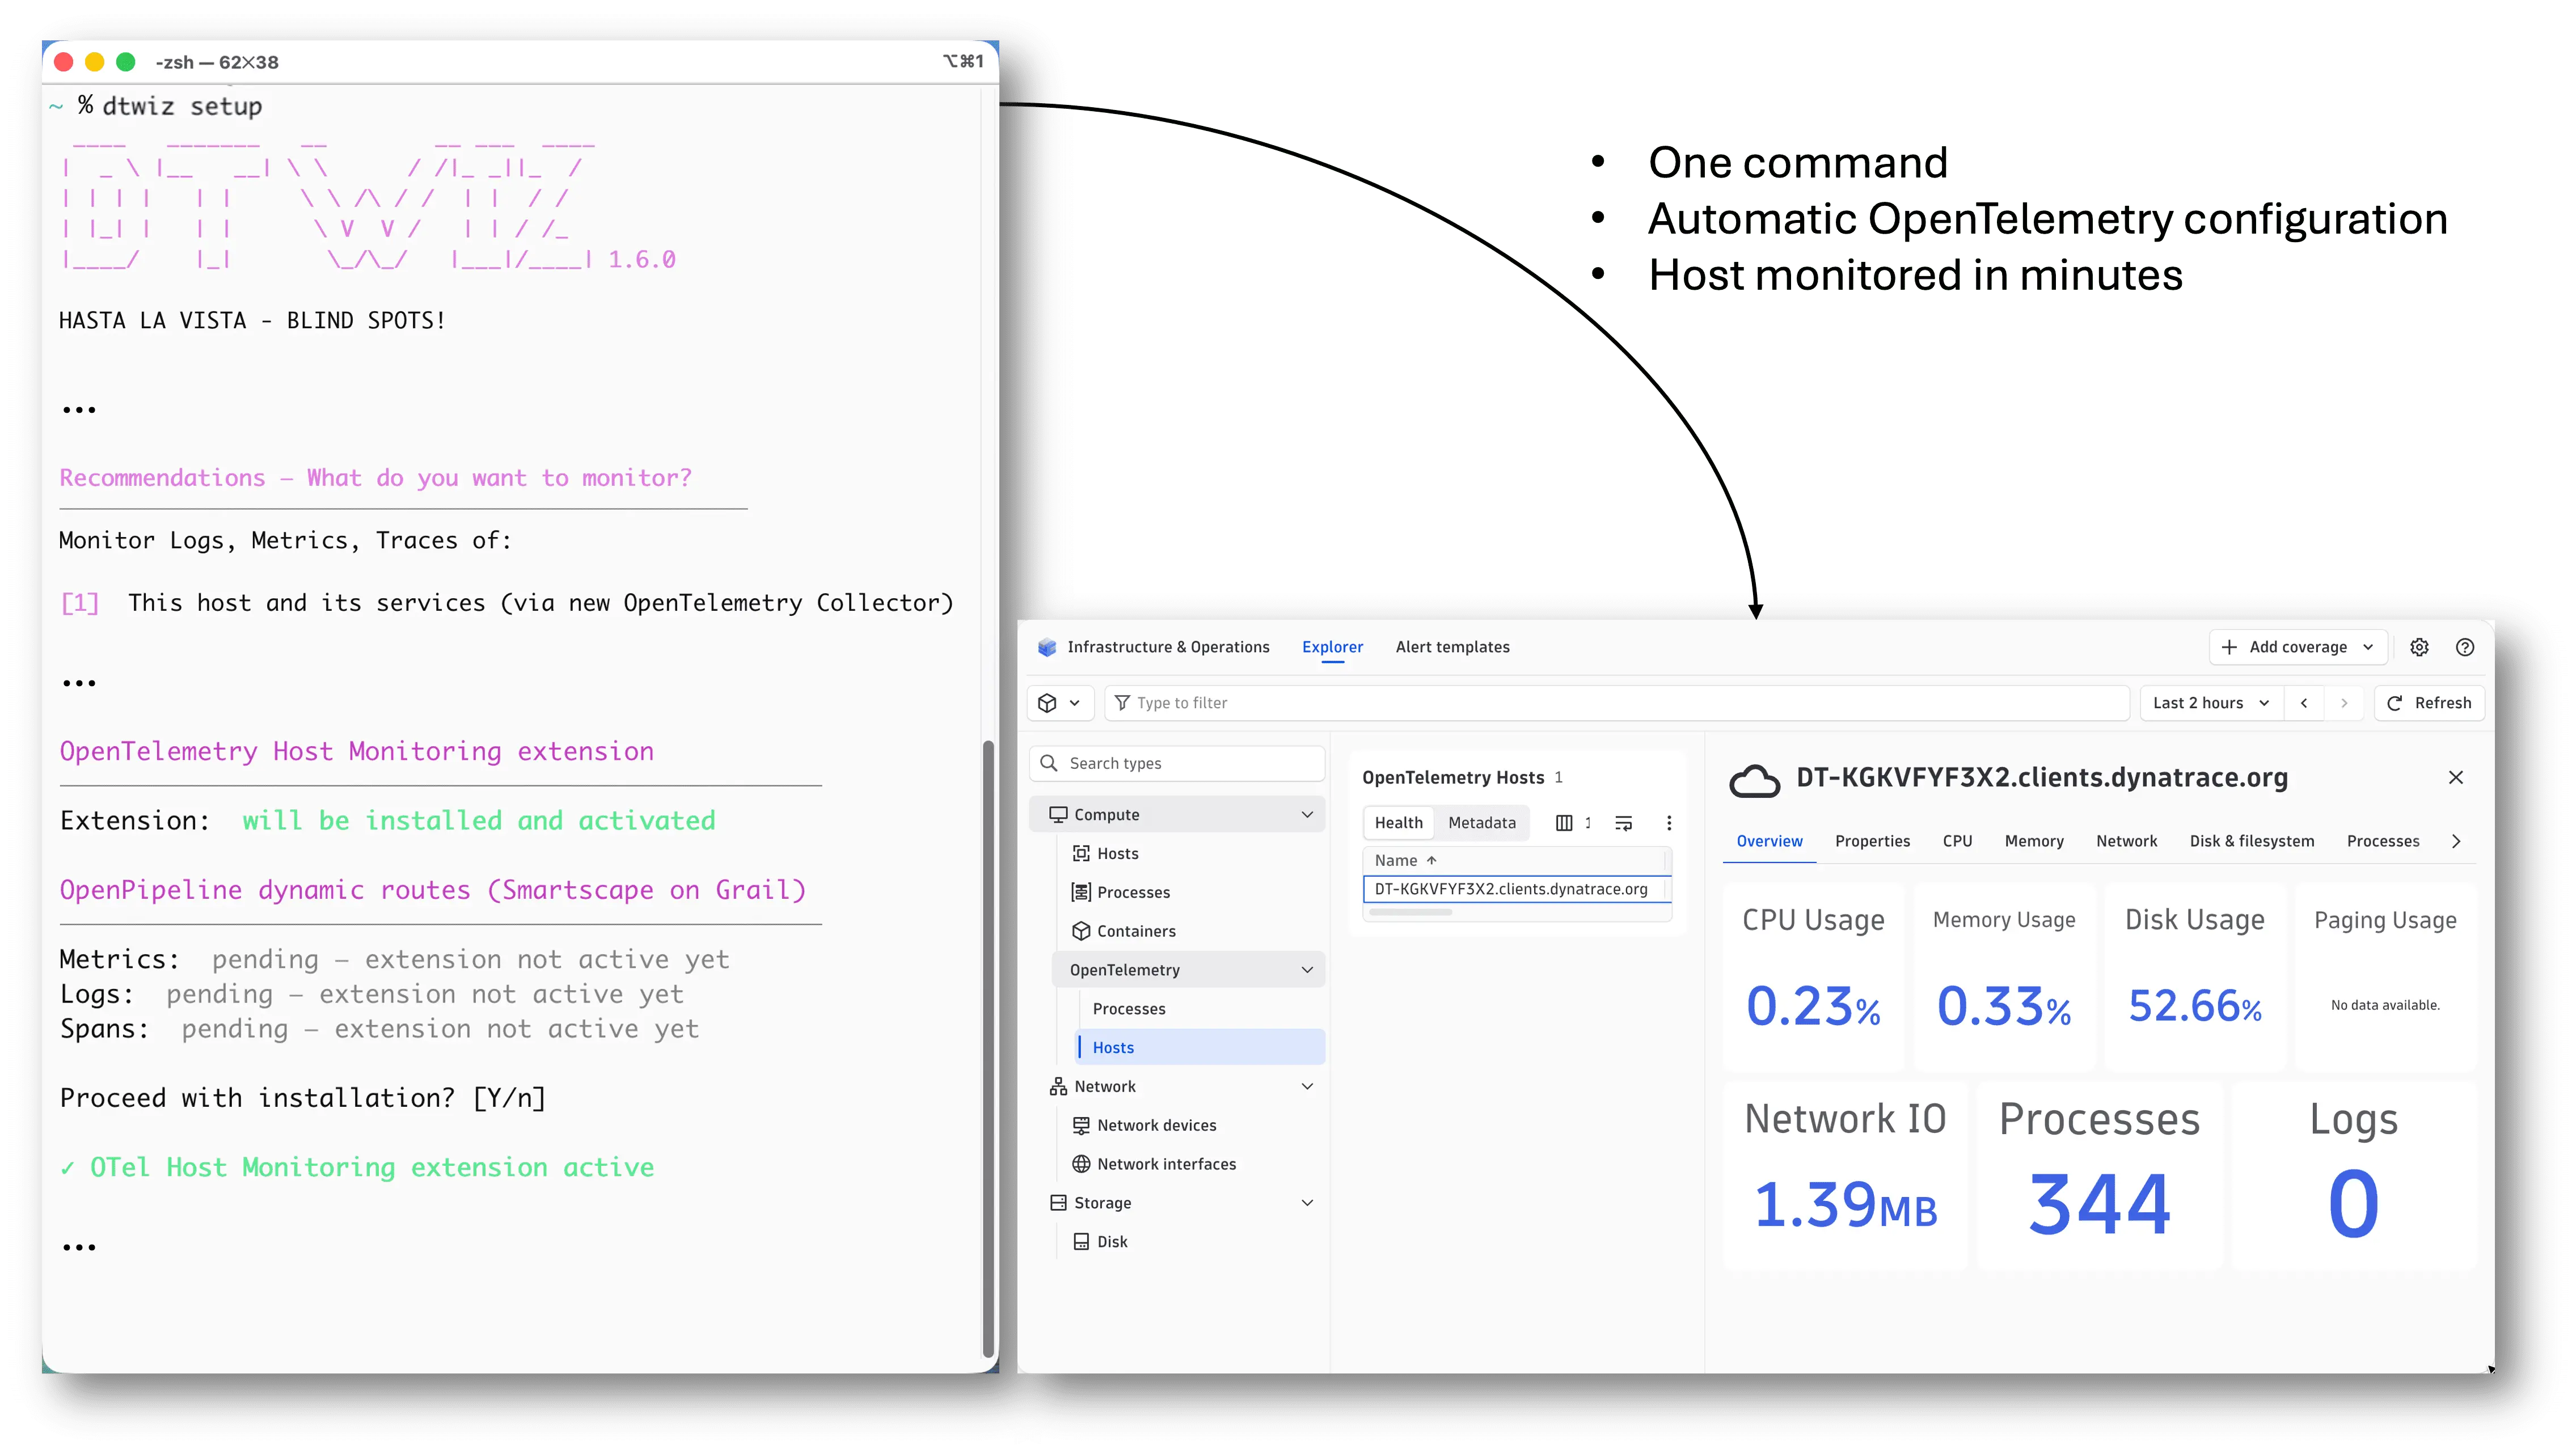
Onboard host monitoring in minutes with dtwiz
Use dtwiz to automatically onboard host monitoring as part of the OpenTelemetry collector installation.
- Run it directly through the
dtwizsetup command. - Get automatic setup of the required OpenTelemetry extension and OpenPipeline dynamic routes.
- See your host metrics in
 Infrastructure & Operations within minutes.
Open QuickStart and select Add more data to try out the updated dtwiz command.
Infrastructure Observability
Automatically create Dynatrace Problems for Data pipeline failures and degradations detected by definity Data Observability extension
Data pipeline failures and degradations detected by definity | Agentic Data Engineering for the Lakehouse & Spark now automatically create Dynatrace Problems with enriched metadata, bringing pipeline incidents into the unified Dynatrace incident feed alongside application and infrastructure alerts.
Infrastructure Observability | Infrastructure & Operations
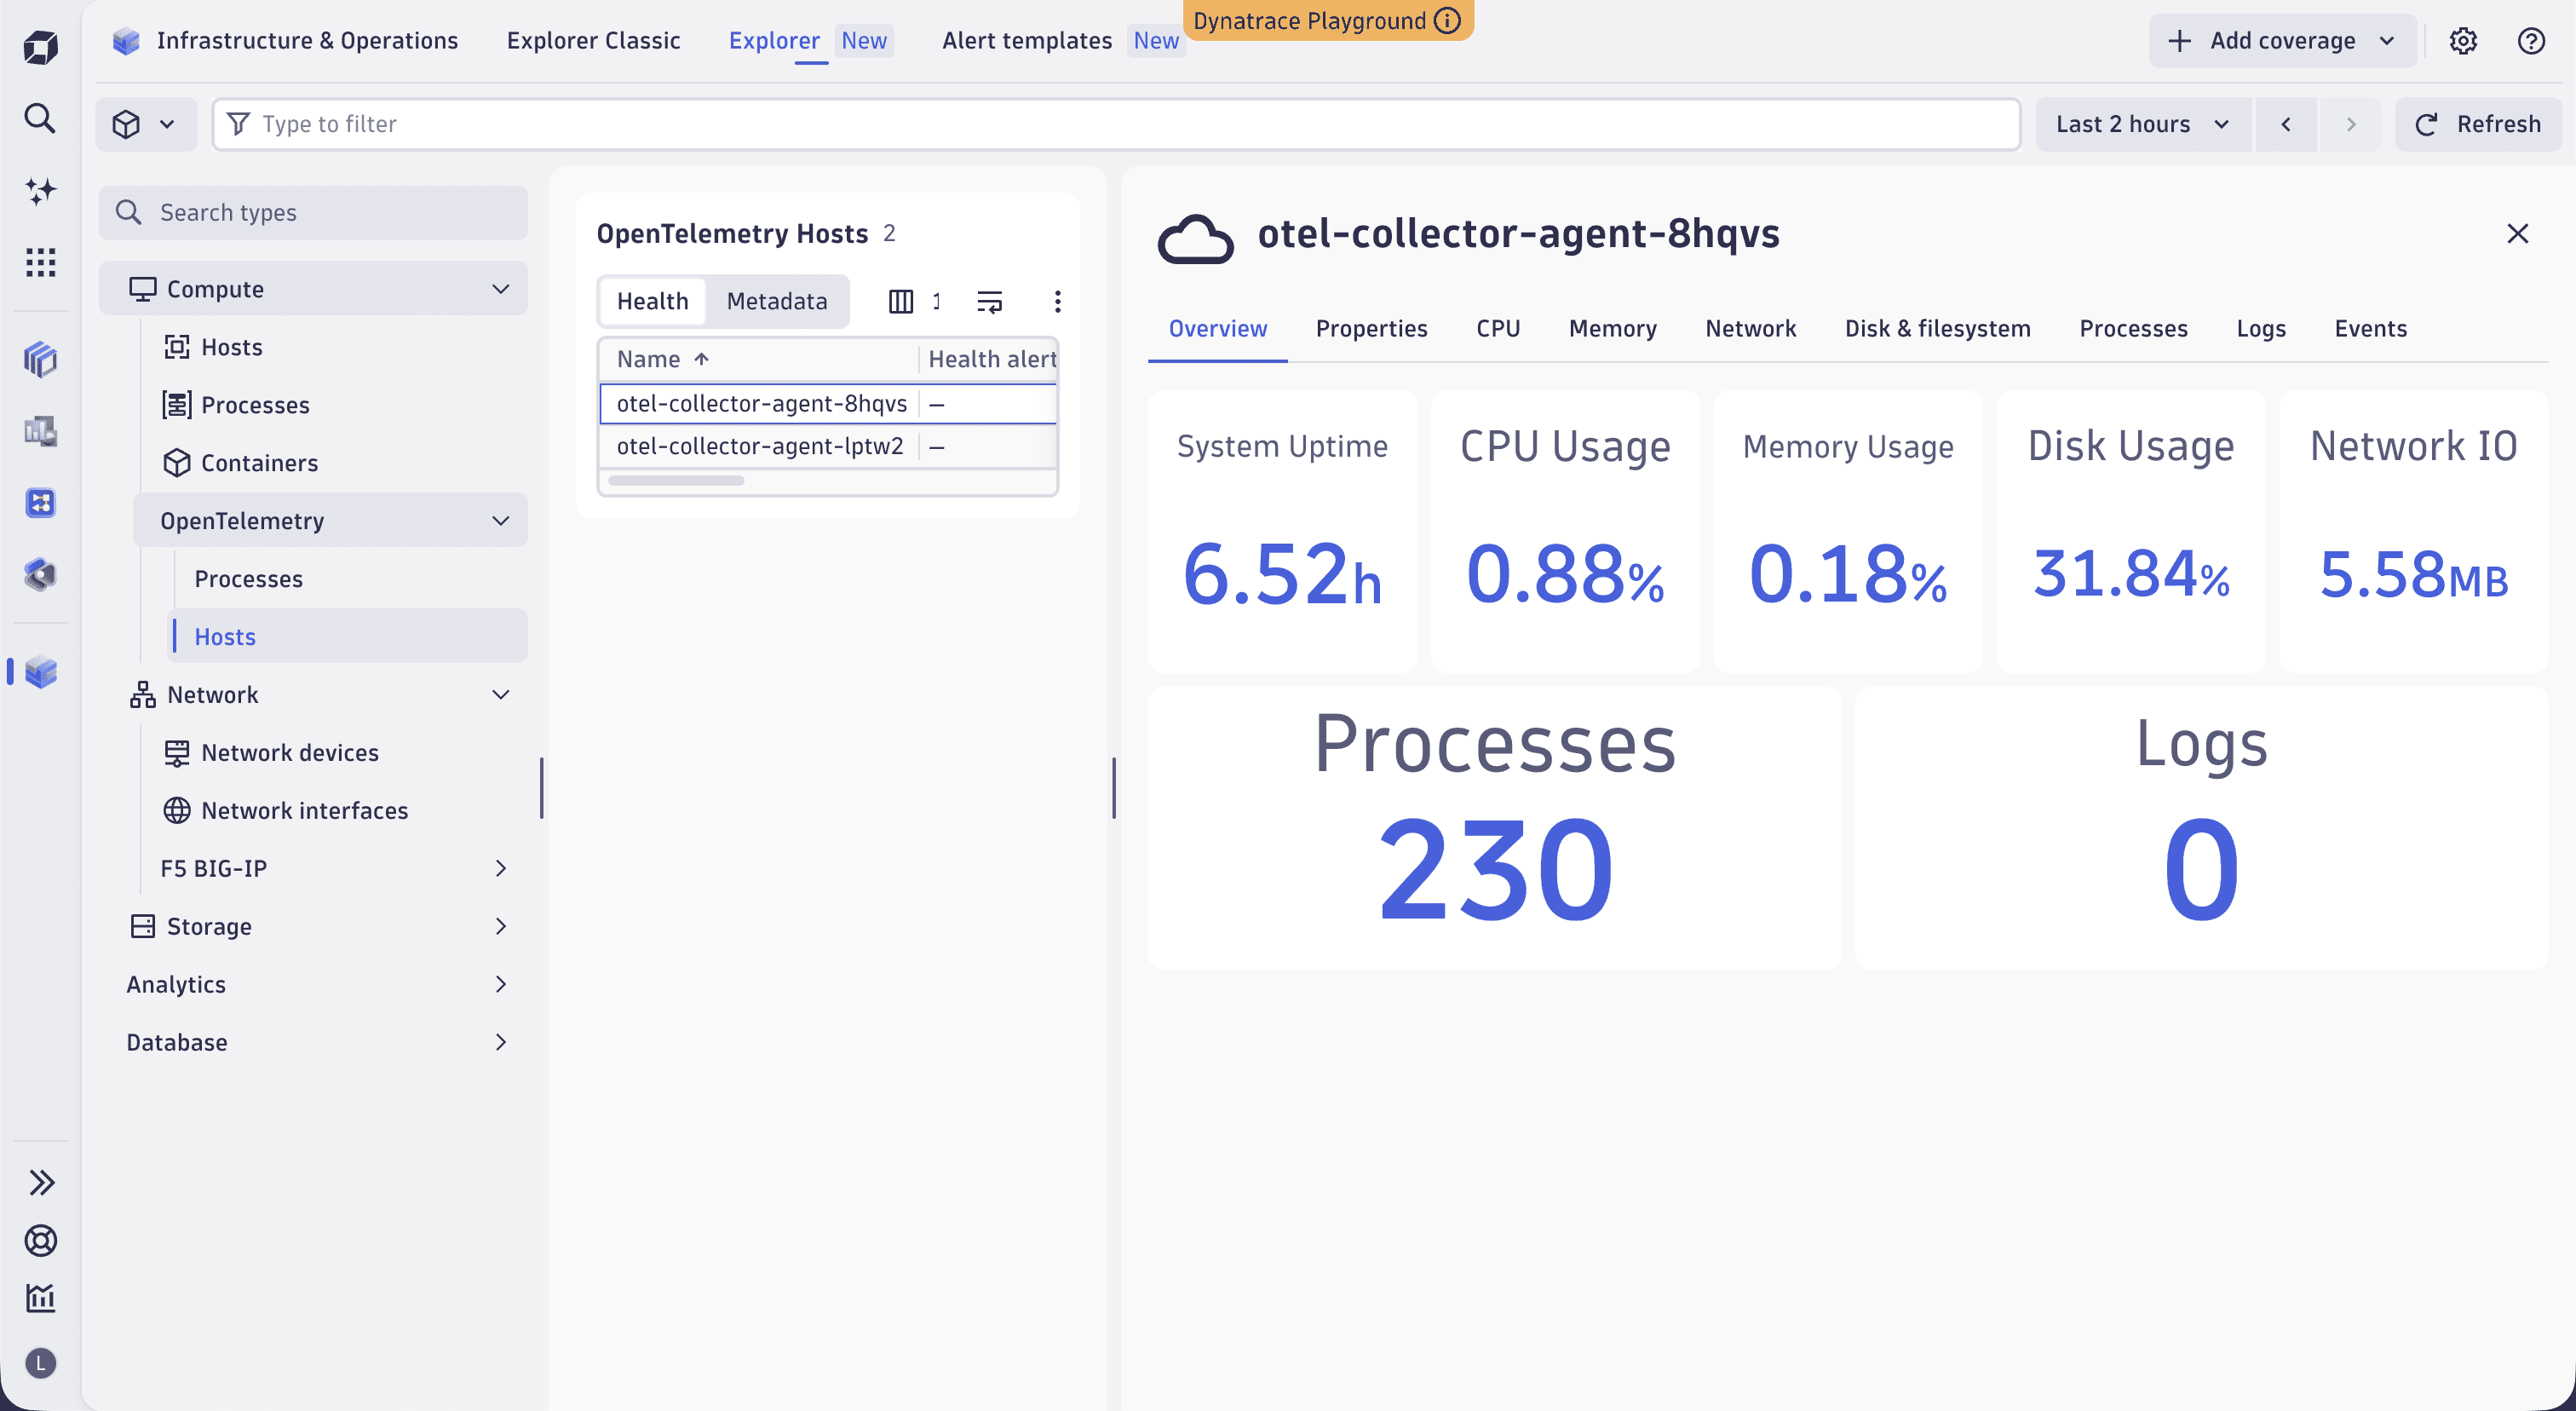
OpenTelemetry host monitoring in Infrastructure & Operations
OpenTelemetry host monitoring is now GA and shown in the Infrastructure & Operations Compute menu, so you now have an equally great experience, whether you choose Dynatrace OneAgent or OpenTelemetry.
Additionally, all extension-monitored technologies are merged into the main Explorer, so you can quickly find all of your monitored technologies across diverse IT ecosystems.
Note that the prior Datacenter concept has been removed from the app in favor of using Primary Tags, which gives you more flexibility in host grouping.
Infrastructure Observability | Kubernetes
Improved accessibility in the Kubernetes app
Starting with  Kubernetes version 1.44, accessibility has been significantly improved based on findings from a full external WCAG 2.1 audit.
These improvements make Kubernetes more usable for people relying on assistive technologies such as screen readers and keyboard-only navigation.
What's improved:
- Screen readers correctly identify interactive controls, buttons, and links.
- Tooltip and popover content can be dismissed without a mouse.
- Page content reflows correctly at high zoom levels without requiring horizontal scrolling.
- Heading structure is semantically correct, enabling screen reader users to navigate the page efficiently.
Platform
Deprecation of Extension Framework 1.0 JMX & PMI extensions (plugins)
JMX/PMI Extensions Framework 1 (EF1) is now deprecated for Dynatrace SaaS deployments.
- A new in-product banner in
 Settings informs you that JMX/PMI EF1 will be deprecated in SaaS deployments.
 - The deprecation notice for JMX/PMI EF1 no longer applies to Dynatrace Managed and has been removed.
- A new documentation section describes the deprecation of JMX/PMI EF1.
Platform | DQL
New record-handling functions and fieldsMove command in DQL
DQL introduces a new family of record-handling functions and a new command to group root-level fields into nested records.
New family of record functions
The functions make it easier to inspect, decompose, and reconstruct record-typed values in DQL:
recordField(record, name): Retrieves a single field value from a record by name. Unlike bracket notation (record[fieldName]), the field name can be a dynamic string expression, enabling conditional and computed field access.recordFields(record): Decomposes a record into an array of {key, value} pairs. Useful for iterating over all fields of a record using array processing such asiCollectArray()orexpand.recordFromFields(fields): The inverse ofrecordFields(). Constructs a record from an array of {key, value} pairs. Enables round-tripping a record through array transformations and back.recordKeys(record): Returns an array of the top-level field names of a record. Useful for counting fields, checking for field existence, or driving dynamic logic.recordValues(record): Returns an array of the top-level field values of a record. The order of values matches the order returned byrecordKeys()andrecordFields().
New fieldsMove command
The fieldsMove command moves root-level fields matching an include pattern (minus any excluded fields) into a new nested record field, removing them from the root level:
| fieldsMove fieldName [, include: {pattern1 [, pattern2, ...]}] [, exclude: {pattern1 [, pattern2, ...]}]
At least one of include: or exclude: must be specified to prevent accidentally moving all fields. This command is the natural counterpart to fieldsFlatten—one gathers fields into a record, the other spreads them back out. It extends the family of fields commands such as fieldsRemove, fieldsRename, and fieldsKeep.
Platform | DQL
Extract and flatten JSON fields with the new jsonExtract DQL command
The new jsonExtract command in DQL enables you to parse JSON strings and automatically extract root-level keys as record fields. It's perfect for flattening complex JSON log data for easier analysis and querying.
Key capabilities:
- Preserve existing data: The command never overwrites existing fields, ensuring your data integrity remains intact.
- Smart conflict handling: When JSON keys collide with existing field names, optionally collect them in a dedicated field for full visibility.
- Type-aware extraction: JSON data types automatically map to DQL types (numbers, booleans, arrays, and nested records).
- Streamlined log analysis: Quickly transform nested JSON logs into queryable root-level fields without manual parsing.
For details, see DQL extraction and parsing commands.
Platform | OpenPipeline
Use new Dynatrace platform features with your OpenTelemetry data
OpenTelemetry attributes are now automatically normalized to Dynatrace Semantic Dictionary fields on ingestion across logs, spans, and metrics. This means log facets, quick filters, segments, and permission models built on Semantic Dictionary fields work with your OTel data out of the box. Original OTel attributes are preserved alongside mapped fields, so your existing DQL queries remain unaffected.
Platform | Smartscape
Explore call chains and linked problems from any Smartscape node
Follow a Smartscape node's call chain across multiple hops, not just its direct neighbors. New downstream and upstream views show every node the focused entity calls and every node that calls it, level after level, from any node, not only services.
Chains load progressively: the first levels render immediately, and a + node at the graph’s frontier pulls in more on demand.
It turns reachability questions, like "Does this eventually call that database?", into something you answer at a glance. Chains are scoped to a single entity, so you don't need to click through the chain node-by-node or scan the whole graph. The chains are built on Smartscape topology rather than sampled trace data, so they show every possible path through your dependencies. This helps you weigh the downstream blast radius before a change or the upstream risk during an incident.
A new problem view does the same for Dynatrace Problems. It shows all active problems the focused node is tied to: the ones it's the root cause of, the ones affecting it, and the ones related to it. Where a node's badge only counts the problems affecting it, this view labels each relationship, so you can see whether the node is a cause or just caught up in a problem. It complements the environment-wide Problem graph, which maps your whole environment, while this stays scoped to the entity you're on. It also lives in the same menu as the call-chain and hierarchy view modes, so you move between them without switching context or apps.
Platform | SSO
JWT scope compression improvements
JWT scope compression has been improved to reduce the token size, preventing incidents caused by tokens exceeding the HTTP header size limit as the permission model grows.
Threat Observability | Security events
Hunt emerging threats across your environment with the Threat Hunting agent
The Dynatrace Threat Hunting agent searches your logs, spans, and security detections for the indicators of compromise in a threat report, then scores how exposed you are. Hand it a report URL, pasted text, a STIX feed, or a list of indicators.
Hunts cover recent log, span, and detection telemetry and report how far back they looked, so a result showing no exposure is a real answer rather than a gap in the search. Start one from the threat intelligence ready-made dashboards, via Assist or in agentic workflows.
Threat Observability | Security events
Stay ahead of emerging threats with STIX/TAXII integration
You can now pull threat reports and their indicators of compromise from any STIX/TAXII 2-compatible feed. This helps your team assess exposure across a broad range of intelligence sources and act before attackers do.
For setup instructions, see Ingest STIX/TAXII threat reports.
Threat Observability | Security events
Stay ahead of emerging threats with Recorded Future
You can now pull Recorded Future Analyst Notes and their indicators of compromise into Dynatrace as threat reports. This lets your team leverage curated, expert-sourced intelligence to assess exposure and act before attackers do.
For setup instructions, see Ingest Recorded Future threat reports.
Breaking changes
Application Observability
OneAgent end-of-life version connection enforcement
Starting with this release, Dynatrace rejects connections from OneAgent versions 1.241 and earlier.
Action plan: If you’re running OneAgent versions 1.241 or earlier, upgrade to a supported OneAgent version to avoid data loss and connectivity issues, and to benefit from enhanced security and features unavailable in earlier OneAgent versions.
For details, see End-of-life announcements.
Application Observability
URL path pattern matching conditions now consider calculated http.route values
URL path pattern matching conditions now also consider calculated HTTP.route values, correcting a previous inconsistency where these values were ignored.
Because the matching behavior changes, rules that relied on the previous behavior might match differently.
Action plan: Review your URL path pattern conditions and confirm they still match as intended now that calculated HTTP.route values are included.
Application Observability | Services
Improved Endpoint Naming Pattern for SDv1 and SDv2 and {URL:Path-Clean}
For customers using URL truncation (Service Detection v2, or Service Detection v1 with enhanced endpoint naming enabled), volatile path segments are now handled differently.
Previously, when a volatile path segment (numeric ID, UUID, IP address, IBAN, hex token) was detected, the derived HTTP route was truncated at that point. With this change, volatile segments are no longer dropped. Instead, they’re replaced with typed placeholders, and path processing continues for the full path:
- Segments matching a numeric/ID rule are replaced with
{id} - Segments matching a hex/token rule are replaced with
{token}. The{URL:Path-Clean}placeholder is also affected: instead of stopping at the first volatile segment, it now processes the full path and replaces each volatile segment with{id}or{token}accordingly.
Action plan: Review any endpoint naming rules, dashboards, or alerts that depend on truncated HTTP routes, as volatile path segments are now replaced with id or token placeholders rather than being dropped. If the naming changes disrupt your setup, request a temporary disablement of the sdv1-sdv2-improved-route-and-clean-path feature flag.
Cost Intelligence
Billing usage events moving from entity IDs to Smartscape IDs for Application and Infrastructure Observability, Container Observability, and Application Security
Dynatrace is transitioning customers from the Dynatrace Classic Monitored Entity (ME) model to the latest Dynatrace Smartscape IDs. The following table maps the legacy entity IDs to their new Smartscape node equivalents for each affected monitoring area. You identify which identifiers in your custom DQL queries need to be updated.
| Monitoring Area | Entity ID | Smartscape node |
|---|---|---|
Full-Stack Monitoring |
|
|
Infrastructure Monitoring |
|
|
Mainframe Monitoring |
|
|
Foundation & Discovery |
|
|
Code Monitoring |
|
|
Runtime Vulnerability Analytics |
|
|
Runtime Application Protection |
|
|
Kubernetes Platform Monitoring |
|
|
Security Posture Management |
|
Action plan: If you have custom DQL queries referencing dt.entity.host, dt.entity.kubernetes_cluster or dt.entity.cloud_application_namespace, update them to use dt.smartscape.host, dt.smartscape.k8s_cluster and dt.smartscape.k8s_namespace respectively. The ready-made usage dashboards are updated automatically on the latest Dynatrace.
Platform | Segments
Segment variable queries now run in the  Segments context
Segment variable queries now run in the context of the Segments instead of the consuming app (for example, Kubernetes, Business Analytics). As a result, variable queries succeed even when the consuming app lacks the required data scopes, such as reading business events. Previously, variable selectors could silently fail in apps that didn't have all the scopes needed by the segment's variable query. Variables now resolve reliably wherever segments are embedded.
Action plan: If you run Segments, you must have the following IAM permissions granted, or variable queries will fall back to the old behavior:
ALLOW app-engine:apps:run WHERE shared:app-id = 'dynatrace.segments.management';ALLOW app-engine:functions:run
Platform | SSO
SCIM user pagination now follows RFC 7644 startIndex semantics
The SCIM GET /Users endpoint now interprets startIndex as the absolute, 1-based index of the first result, per RFC 7644, and computes the offset as startIndex-1. Previously, it treated startIndex as a page number, causing records to be skipped on the second and later pages. If your SCIM client relied on the old page-number behavior, update it to pass absolute record indexes.
Action plan: If your SCIM client relied on the previous page-number behavior of startIndex, update it to pass absolute record indexes.
Fixes and maintenance
Resolved issues in this release (SaaS)
- Fixed an issue where the Instant Messaging Service (IMS) failed to recover from expired vault database credential leases, causing a permanent authentication failure loop until the pod was manually restarted. (PS-49512)
- Fixed an issue where inline Markdown elements were not converted correctly to adaptive cards in the Microsoft Teams action. (PS-49388)
- Fixed an
ExpressionChangedAfterItHasBeenChecked(NG0100) error in Angular charts by injectingDtChartvia DI. (PRISM-14616) - Fixed two issues on Dynatrace Classic dashboards supporting remote environments. Management zones for cluster-local tenants are now resolved in-process instead of calling the disabled loopback HTTP port, and global and default dashboard aliases are now replaced with the resolved dashboard UUID before requesting remote tile data, preventing the initial 403 response. (PRISM-14154)
- Fixed an issue where Dashboards Classic dynamic filters did not suggest custom dimension names for ordinary metric string dimensions (like
thread_pool_namein the original finding), returning an empty suggestion list. Now the suggestion list is correctly resolved for the given metric's custom dimension. (PRISM-13961) - Fixed an unhandled error on Dashboards Classic when a remote-link tile configuration could not be parsed; the tile now shows the setup error message instead of failing silently. Added a null guard after deserialization in
generateUrlAndOpenDexpRemoteLinkmethod. If the config can't be parsed, fireTileSetupErrorEventwith the existing clipboard error message and return early. (PRISM-13086) - Fixed an issue where the Cloud Object Cache eviction pass aborted if a temporary file was deleted by a concurrent download during the directory scan, leaving the cache unable to evict. In
FileSystemAccessImpl.getFilesSortedByAccessTime(),Files.walk(basePath, 1)read attributes for every directory entry viaFileTreeWalkerto distinguish files from directories, so if a.tmpfile was deleted between the directory read and the attribute read by a concurrent download, the stream threw anUncheckedIOException(NoSuchFileException) and tore down the entire file list. ReplacingFiles.walk(basePath, 1)withFiles.list(basePath)prevents this, so the eviction pass no longer aborts when a file disappears during the directory scan. (PPX-14691) - Fixed an issue where uploading a notebook that triggered validation errors left a dangling, never-ending progress indicator that persisted across notebooks. (PAPA-35496)
- Migrated
 Clouds off the deprecated
 smartscape.affected_entity.*/related_entity.*Davis problem fields to the currentsmartscape.affected_entities/related_entitiesfields, ensuring continued functionality for tenants where the deprecated fields are no longer written. (INFOBS-12323) - Fixed an issue where users with conditional permissions were incorrectly blocked from
 Fleet Management. Conditional grants now allow access to the app. (ICP-8665)
 - Improved logging on the task's current status during tombstoning to reduce misleading warnings. (GRAIL-55801)
- Fixed an issue where the
listed_objectsandscanned_objectsvalues for external data queries were swapped indt.system.query_executions. This can be verified with the corresponding Notebook. (GRAIL-55658) - Fixed a misleading error in Dynatrace Assist where a WebSocket message exceeding the size limit reported
connection closed before the message was sent,instead of the actual cause. The limit on WebSocket connections has now been increased. (DI-30833) - Fixed an issue where large Session Replay sessions took a long time to become playable when played from the beginning. (DEM-32116)
- Fixed an issue where Session Replay shows
Safe masking appliedafter migrating from Classic RUM (Dynatrace Classic) to the latest Dynatrace frontend, regardless of the configured masking settings. Masking settings are now retrieved through the new API. (DEM-31697) - Fixed a case when the play button was not showing the correct icon after reaching the end of a session and selecting the Back 10s button. (DEM-31560)
- Fixed two issues where certain latest Dynatrace synthetic step summaries reported
dt.entity.synthetic_test_stepasUNKNOWN(resulting in null values in Grail), and a related race condition where 401 authentication failures were sometimes attributed to the wrong step. As a result, step summaries now preserve the correct step entity ID and a valid timestamp even when execution is canceled early, and authentication failures are now consistently attributed to the correct owning Navigate step rather than sometimes being incorrectly reported on a later step. (DEM-31197) - Fixed an issue where a malfunctioning primary tags selection was shown when creating or modifying the monitoring configuration of a JMX or PMI-based extension. The selection is now hidden. (DAQ-28744)
- Fixed an issue where, on very large traces, a node arriving after its call had already been sent could be linked to itself, creating a cycle in the trace tree and a misleading warning attributing the problem to OneAgent data. This corrupted the trace tree with a cycle and produced a misleading warning that attributed the problem to OneAgent data. (APPOBS-38723)
- Fixed an issue where span links sent without a trace ID or span ID were processed as valid links with all-zero IDs. These links are now discarded. (APPOBS-38649)
- Fixed rendering issues that caused XYChart
AreaSeriesto not work properly in some cases, with zero values and shared tooltips with long value names. (APPDEV-19590) - Fixed an issue that caused the text inside bars in the
ToplistandXYChartcomponents to appear bold and washed out on Windows. (APPDEV-19526) - Fixed a deprecation warning ("The
envFileoption is deprecated, please useenvDir: falseinstead") when starting the app dev server with--hmr. Now the dev server with--hmrshould start without any warnings or errors. (APPDEV-19420) - Fixed a permission check in
 AI Observability so that a
 conditiongrant is treated as granted for all scopes, preventing users with conditional scope access from being incorrectly blocked from features they’re allowed to use. Now users with conditional scope access are not incorrectly blocked from features they’re allowed to use. (AI-444) - Fixed an issue where clicking Test on a saved LLM provider connection in AI Observability settings returned a 401 error even when the credentials were valid. (AI-432)