Get started with Dynatrace QuickStart
- Latest Dynatrace
- How-to guide
- 5-min read
- Published May 12, 2026
This guide explains how to use  QuickStart to quickly get value from Dynatrace.
First, you'll get data flowing into Dynatrace—this is the foundation that makes everything else possible. Next, you'll learn what Dynatrace automatically discovered about your environment and what those findings mean for you. Finally, you'll explore how to dig deeper into your data independently using dashboards and queries.
By the end of this guide, you'll have:
- Data successfully ingested from your infrastructure or applications
- An understanding of how to interpret the findings Dynatrace surfaces
- The ability to explore your environment and discover insights on your own
Each step takes a few minutes, so you can complete the entire journey in almost no time.
If you aren't a Dynatrace customer yet, now is the time to sign up for a free trial account.
Get data flowing in minutes
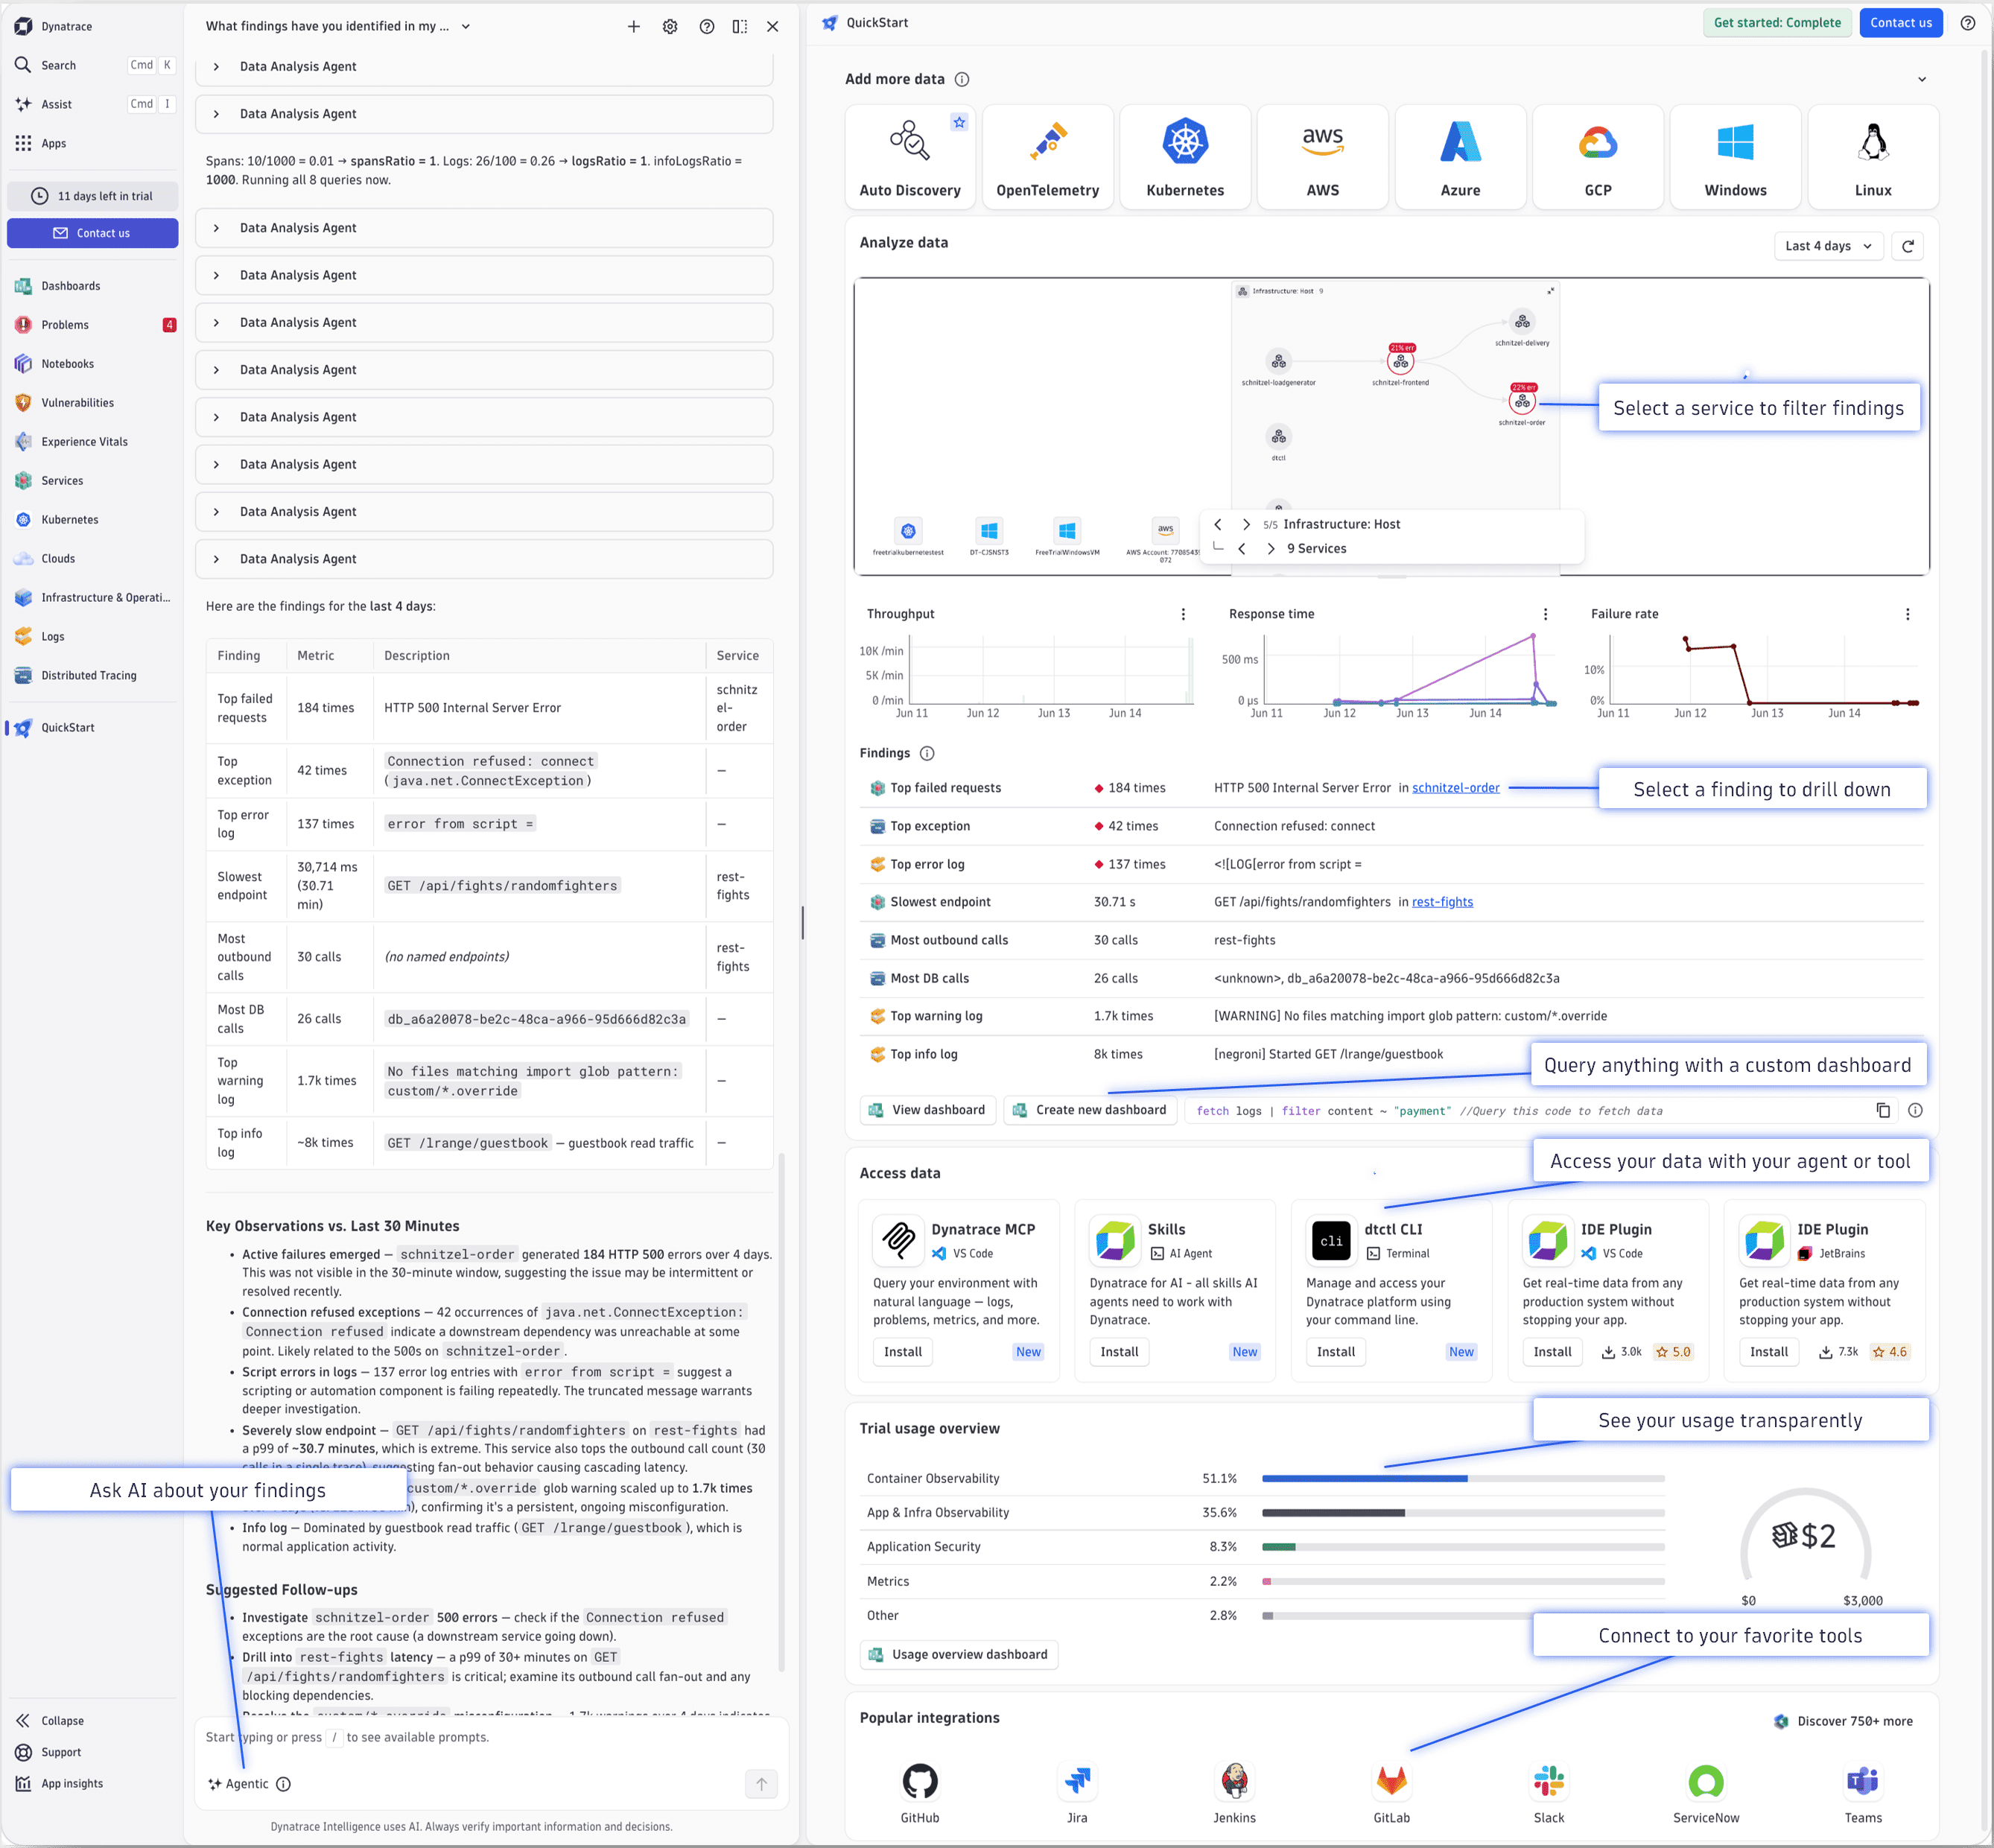
When you go to QuickStart (it opens automatically if you're in a free trial), you'll see this page.
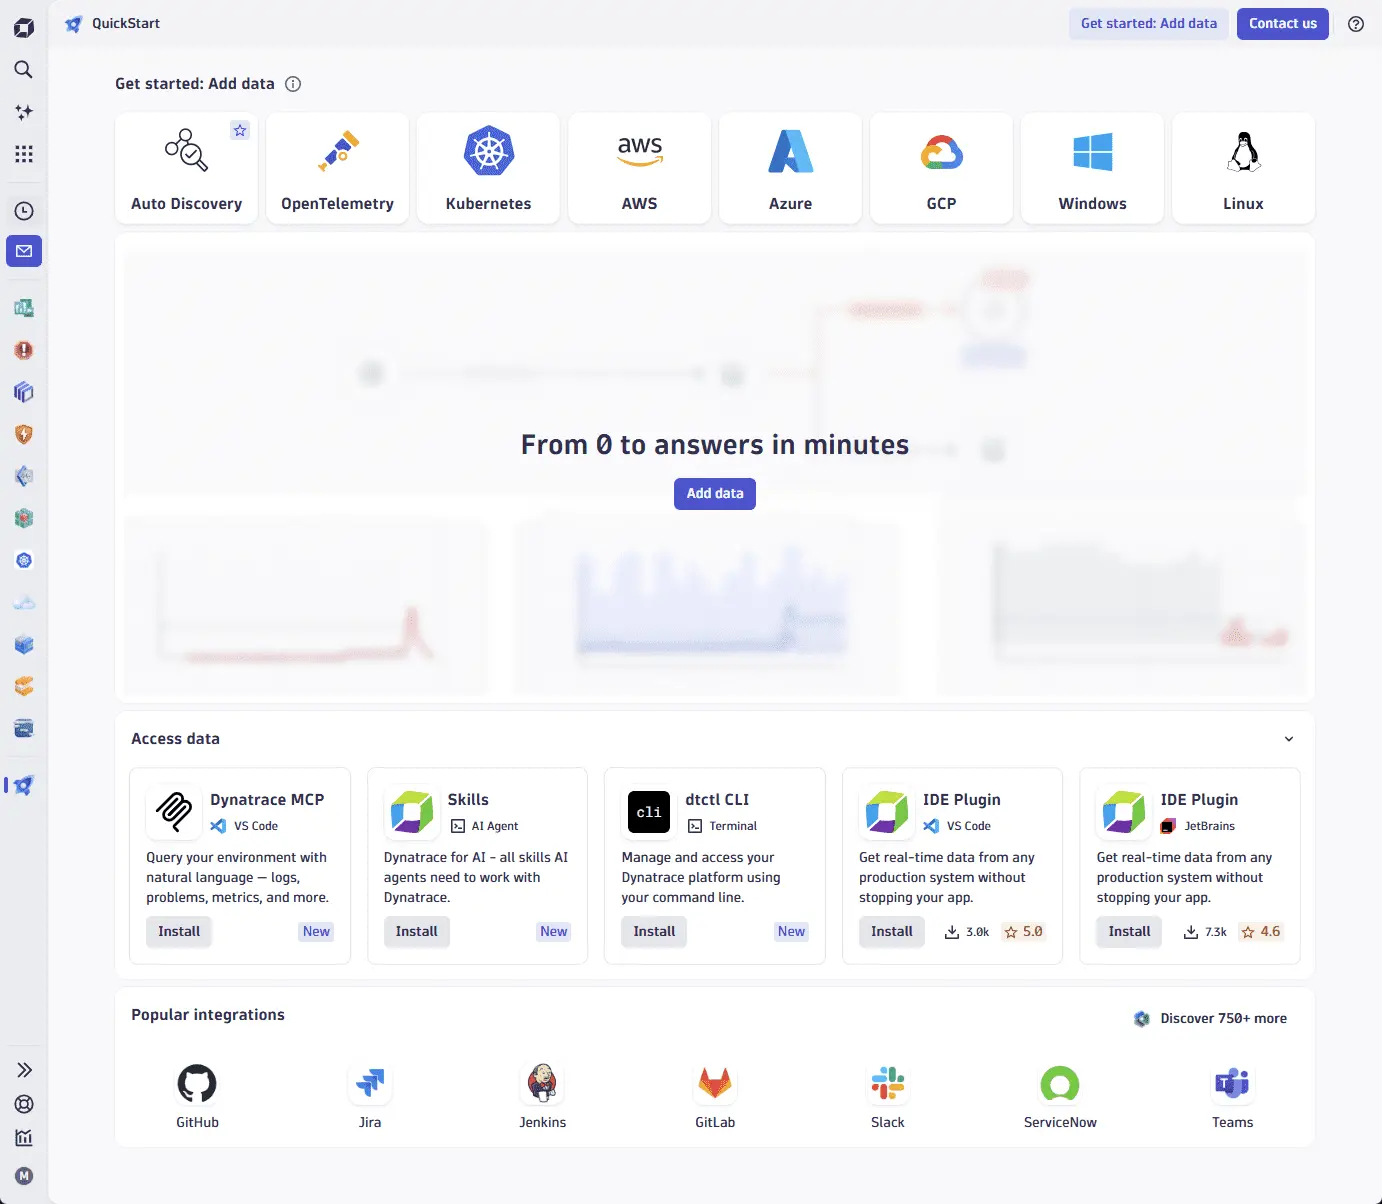
To get data flowing into Dynatrace in a couple of minutes
-
Select Add data. The Auto Discovery window is displayed.
Other optionsWe recommend Auto Discovery, the default when you select Add data, but you can instead close the Auto Discovery window and select a technology-specific tile (OpenTelemetry, Kubernetes, AWS, Azure, GCP, Windows, or Linux) if you want to focus on just that technology.
If you're unsure, start with Auto Discovery:
- It automatically detects your infrastructure and starts monitoring without manual configuration.
- It scans your environment, identifies running technologies (Kubernetes clusters, applications, databases), and begins data ingestion immediately.
-
Verify Mac/Linux or Windows. That's your machine's OS.
-
Select Copy to copy the OS-specific command.
-
Open a terminal (use PowerShell for Windows) on your machine and run the command.
A CLI (Dynatrace dtwiz) analyzes your system and deploys the best Dynatrace observability method automatically.
Read along with the CLI. It displays messages and asks you relevant questions.
-
Return to Dynatrace to verify ingestion.
You'll know data ingestion is successful when your infrastructure appears in the map that follows the technology selector.
The Dynatrace Ingest CLI:
- Analyzes your environment and connected infrastructure—detects platform type, containers, Kubernetes, existing agents, cloud providers, and services
- Recommends the optimal ingestion method for your environment (ranked suggestions)
- Deploys automatically—supports OpenTelemetry, Kubernetes, AWS (and Lambda), GCP, Azure, and OneAgent
For details on installation and uninstallation, see the dtwiz documentation on GitHub.
For production deployments, scaling configurations, or integrations unavailable in QuickStart, use the comprehensive data ingestion guides. These cover specific integration instructions, configuration options, multi-host deployments, and advanced setups. You can always add more data sources later by returning to this step.
- Need help with data ingestion? Ask the Dynatrace Community
What are your findings telling you?
Now that data is flowing, Dynatrace has automatically analyzed it and surfaced findings—issues and insights about your environment.
Findings are Dynatrace's intelligent analysis of your data. Dynatrace continuously monitors metrics, logs, and traces. You don't have to search through data manually; Dynatrace surfaces what matters.
Explore findings with Smartscape
Each finding is connected to your environment topology through Smartscape, Dynatrace's dependency map.
The map at the top of this section shows your infrastructure and services visually—select any item to see related performance charts (throughput, response time, failure rate) and the findings list automatically focuses on that selection. Use Smartscape to see which services are affected, understand dependencies, and trace the chain of cause and effect across your infrastructure and services.
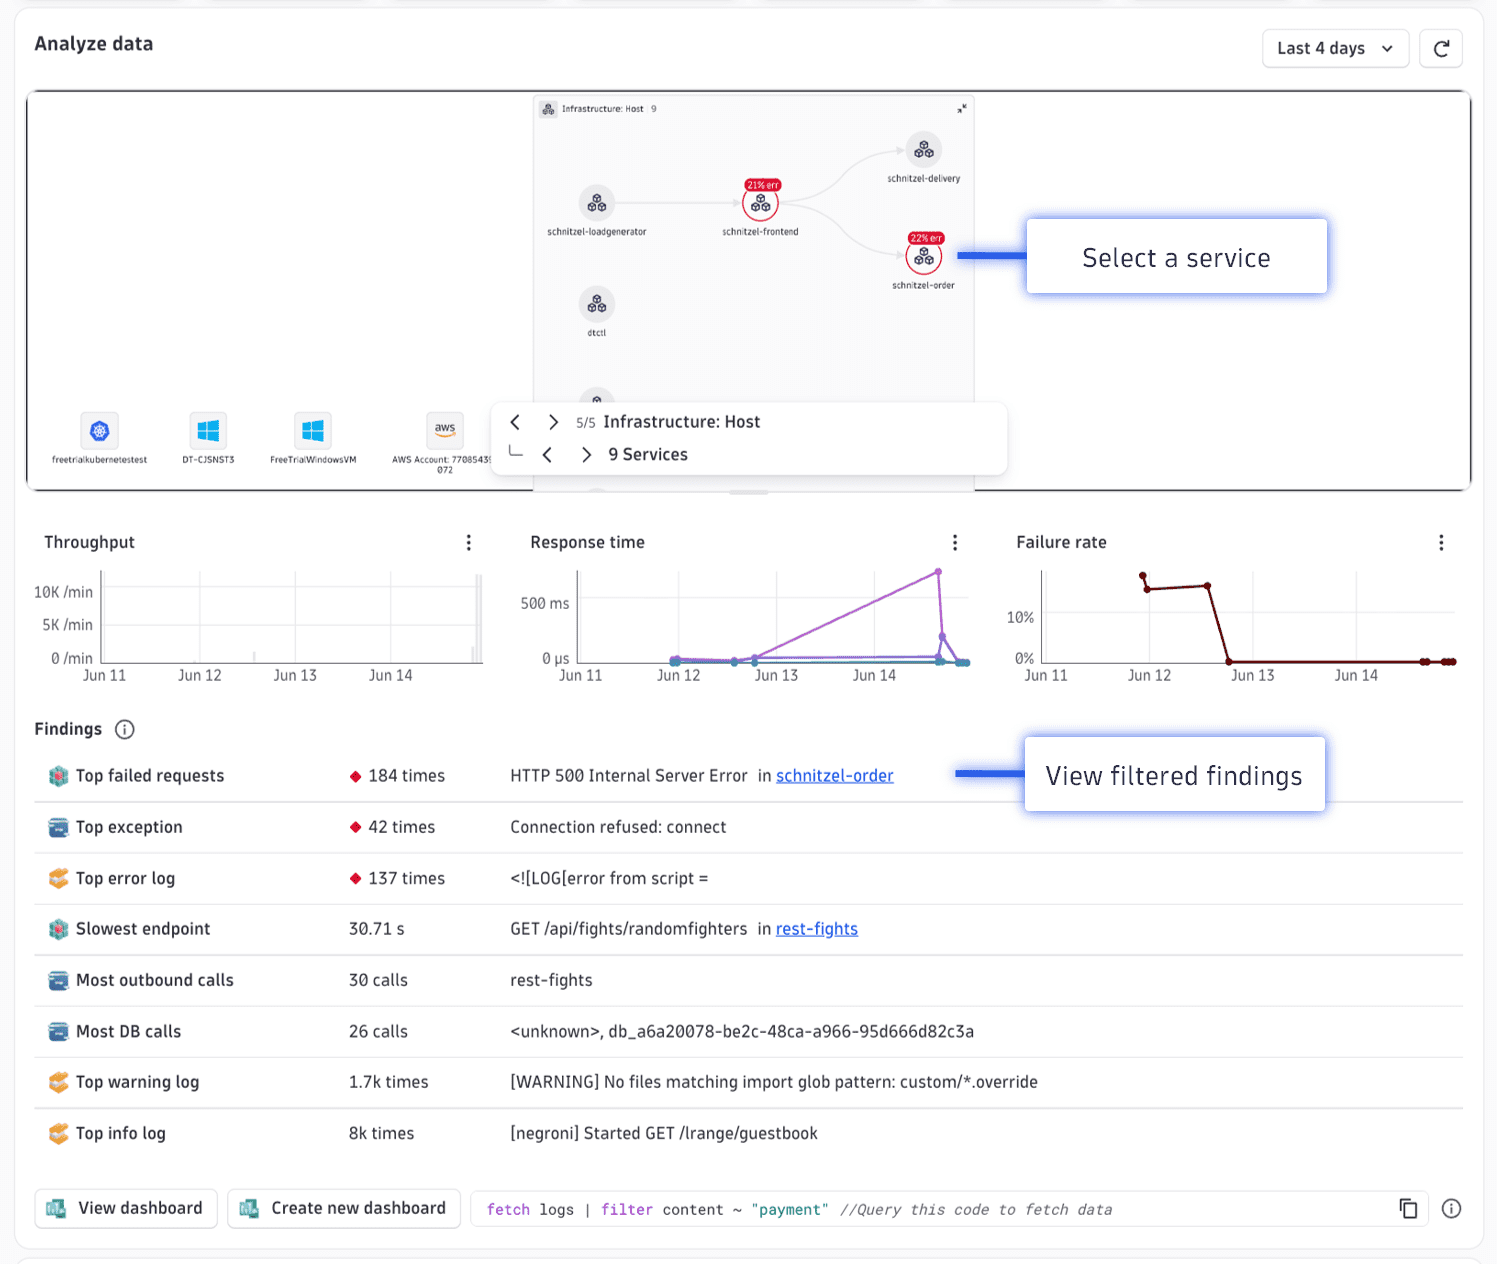
What each finding type means
Findings appear in two types, each with a different priority level.
- Issues—Identify active problems requiring investigation (for example, service response time degraded, application crashes, database timeouts). These are high priority.
- Insights—Identify places where performance can be improved, and look into info and warning logs.
Start with issues to resolve active problems, then review insights when you're ready to optimize.
Explain findings with AI
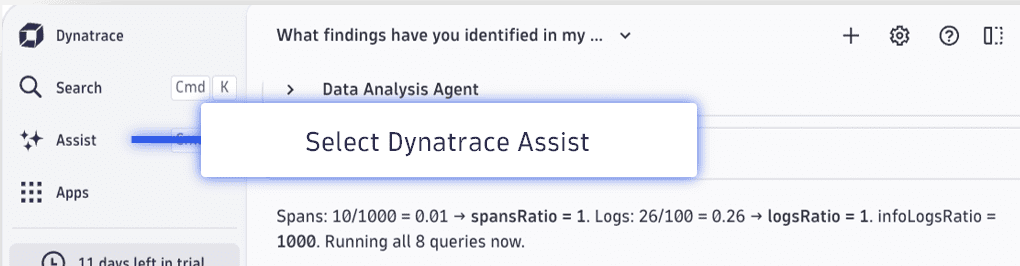
To have AI explain your findings
- Select (Assist) in the dock on the left. This opens an Assist panel.
- Select Show findings and then to issue the suggested AI prompt.
- Explore the results.
Explore your data independently
With data flowing and findings understood, you're ready to explore your environment independently using dashboards and queries.
- View dashboard displays a pre-built dashboard that shows you metrics, health, problems, traces, and logs at a glance.
- Create new dashboard automatically generates and displays a service dashboard with sample dashboard tiles that visualize your service data.
- copies the displayed DQL sample to your clipboard. Use it to add a DQL query to a dashboard.

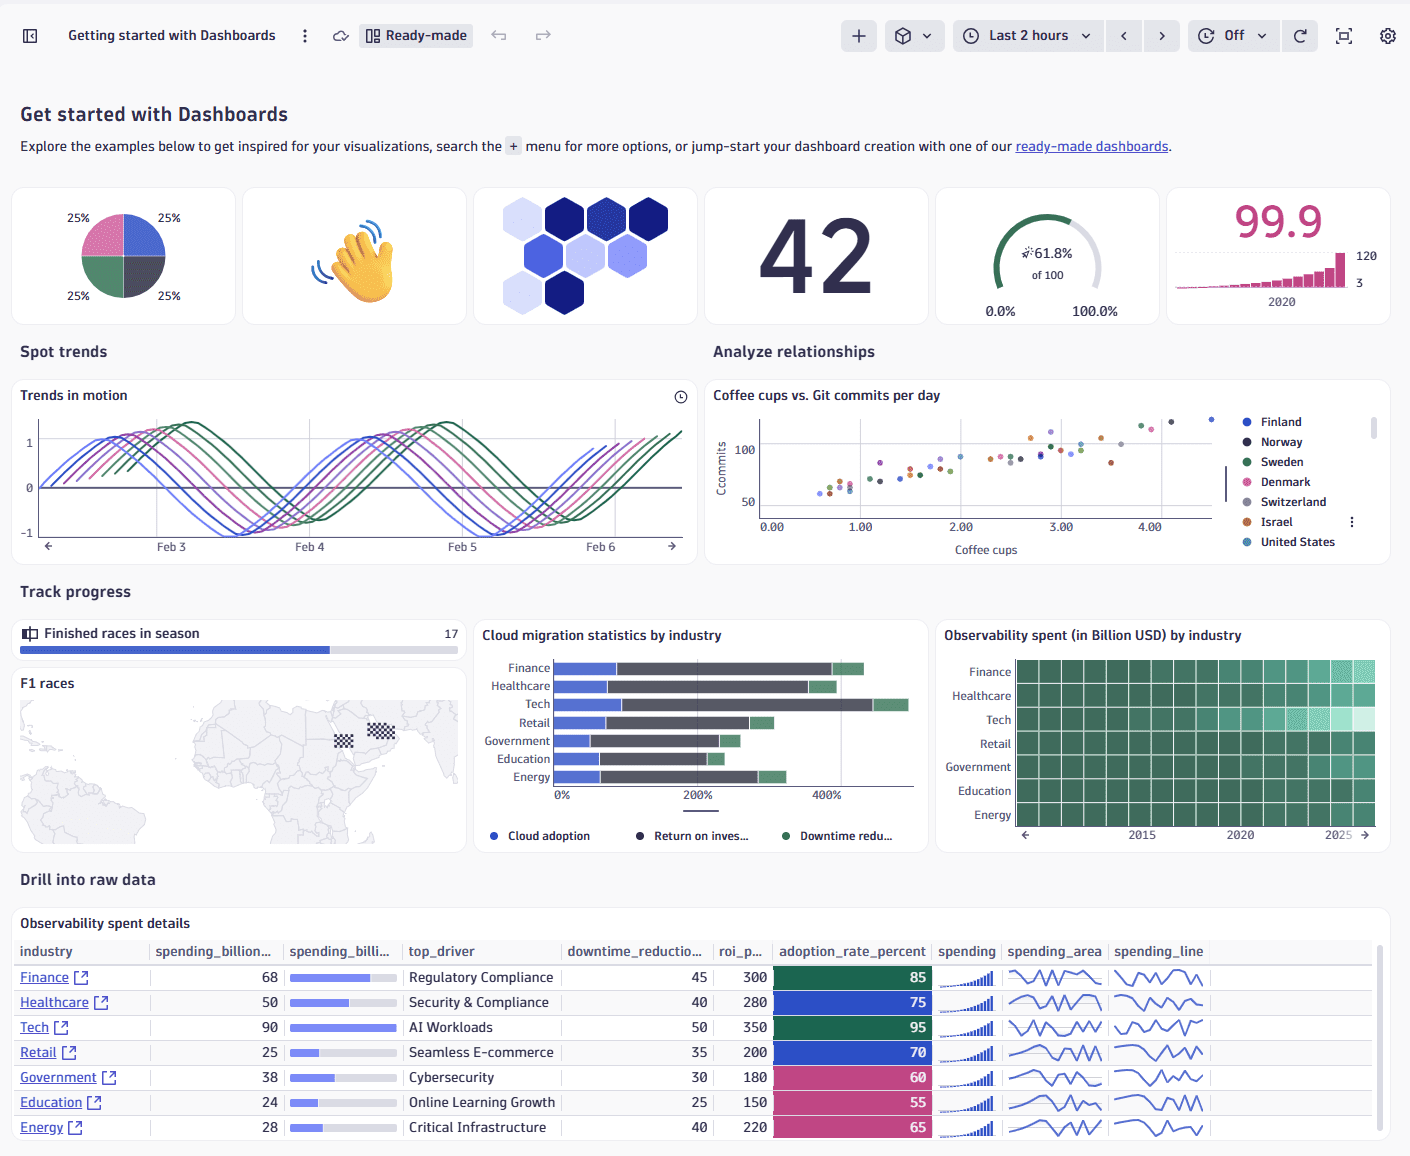
Visualize with dashboards
Dashboards visualize performance patterns, surface issues, and track trends across your services, infrastructure, and applications.
- Start with pre-built dashboards to see response times, error rates, resource consumption, and database performance at a glance.
- Customize them by adding tiles, filtering by service or environment, and rearranging layouts to match your workflow.
- When you're ready, create custom dashboards to track specific business or technical metrics.
Query your data
Beyond dashboards, you can query raw data to discover insights.
-
Use Dynatrace Query Language (DQL) to pull specific metrics, traces, or logs. DQL lets you write precise queries for custom analysis and reporting. Combine it with dashboards to create tailored visualizations.
-
Dynatrace's AI assistant can generate DQL queries based on natural language descriptions. Use agentic AI to automate analysis, generate insights, and suggest next steps for investigation.
-
To skip writing queries, you can explore data with a more point-and-click interface.
QuickStart interface at a glance
Beyond the three touchpoints covered above, the QuickStart interface surfaces several other useful sections. Here's what each one does.
- Analyze data displays a map of your data.
- Select a service on the map to filter findings and performance charts to that specific entity.
- Findings are Dynatrace's intelligent analysis of your data.
- To drill down, select a finding.
- To analyze your findings with AI, select (Assist) in the Dynatrace dock on the left, or press Ctrl+I.
- Create new dashboard opens the
 Dashboards app. Use it to create a custom dashboard that queries your data.
 - Access data shows data access possiblities with your agents and tools. Connect to your environment through Dynatrace MCP, dtctl CLI, or IDE plugins for VS Code and JetBrains.
- Trial usage overview charts your usage across the different observability capabilities.
- Popular integrations lets you browse 750+ integrations to connect Dynatrace with your existing tools, including GitHub, Jira, Slack, and ServiceNow.
Ready for more?
You've completed the QuickStart journey. Continue exploring Dynatrace capabilities, set up additional integrations, or learn advanced techniques:
- Application Observability—Monitor application performance, dependencies, and user experience
- Infrastructure Observability—Track hosts, containers, and cloud services
- Log Management and Analytics—Centralize and analyze logs across your environment
- Digital Experience Monitoring—Measure real user experience and synthetic tests
- Cloud Operations—Automate cloud operations and deployments
- Security and Vulnerabilities—Detect runtime vulnerabilities and security threats
And don't forget to join the Dynatrace Community!
Dashboards Smartscape