What's new in Dynatrace SaaS 1.342
- Release notes
- 17-min read
- Rollout start on Jun 30, 2026
This page showcases new features, changes, and bug fixes in Dynatrace SaaS version 1.342. It contains:
Infrastructure Observability | Kubernetes
Investigate problems faster with log insights in Kubernetes ready-made dashboards
 Kubernetes ready-made dashboards now include built-in log insights, giving you a faster, more complete picture of your Kubernetes environment without switching between views.
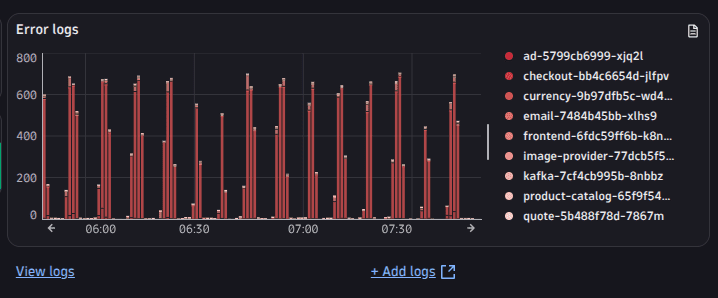
At-a-glance error visibility
Each Kubernetes dashboard now shows an error log count at the top, so you can immediately see if the cluster, namespace, or nodes are producing errors—right alongside your existing health data.
Dedicated Log Analytics section
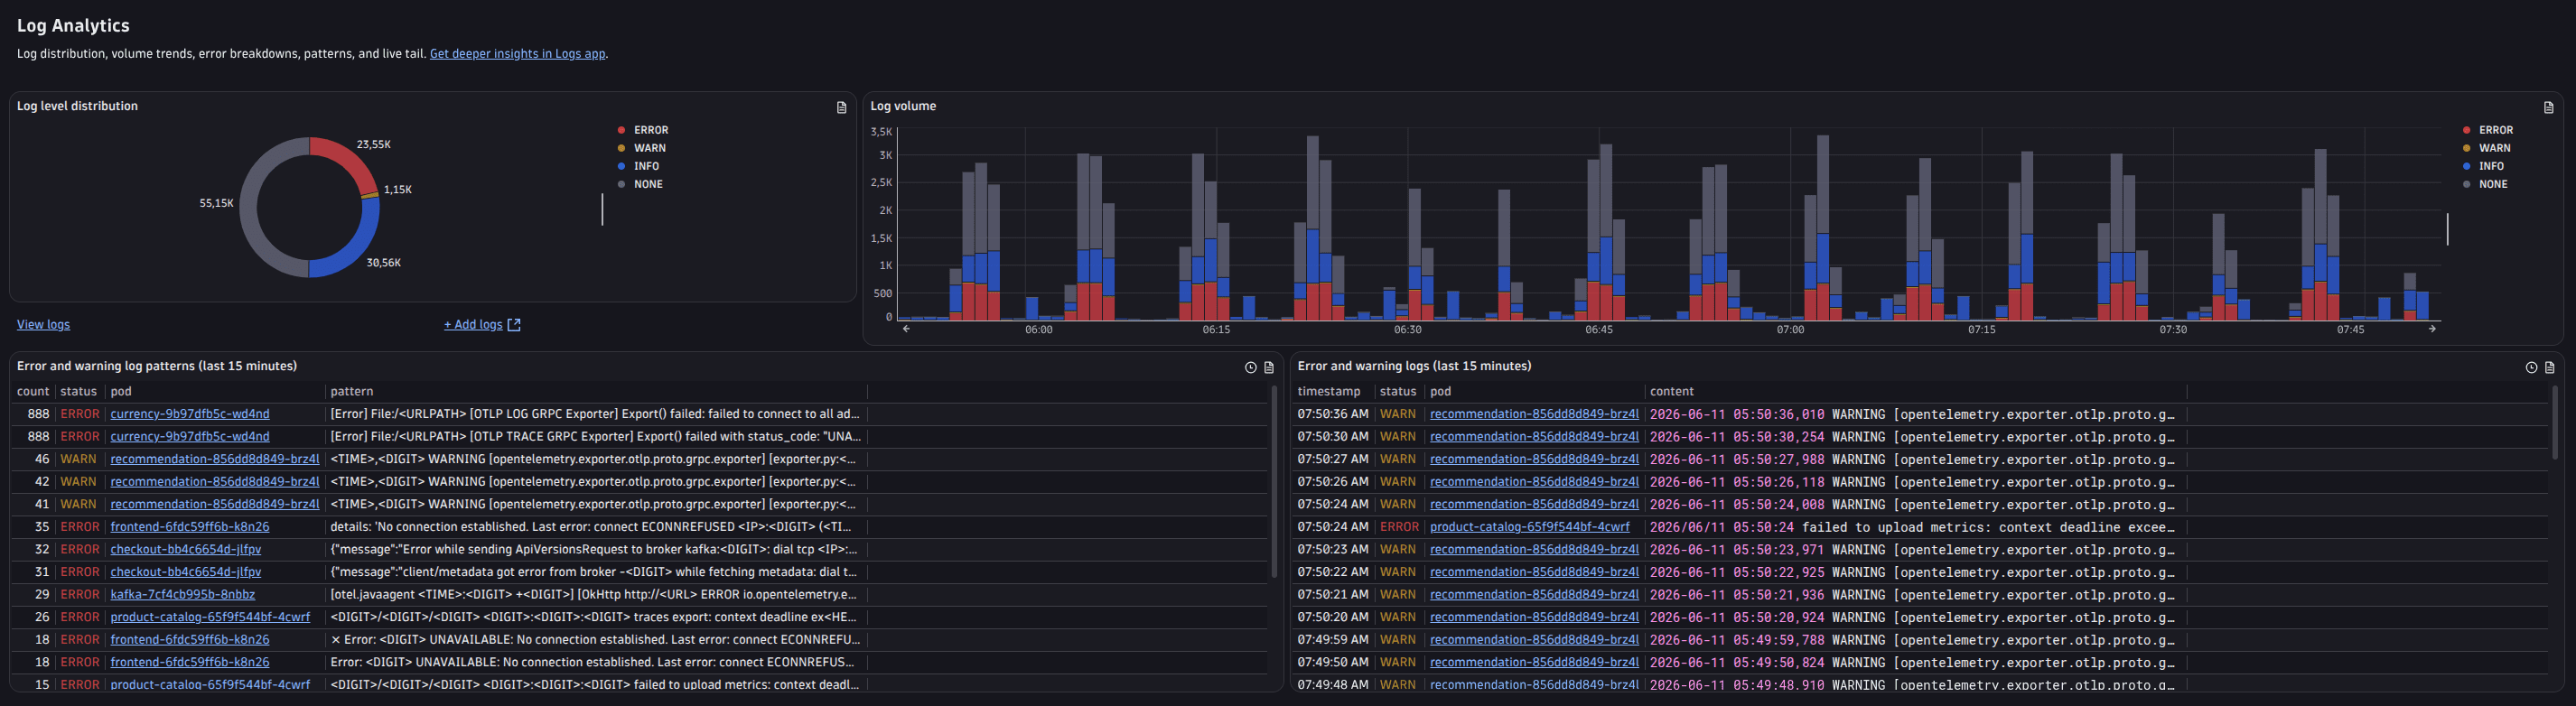
A new Log Analytics section at the bottom of each dashboard provides deeper insights into log activity:
- Log level distribution: A breakdown of log volume by severity (errors, warnings, informational) to spot patterns at a glance.
- Log count over time: See how log severity trends across your selected timeframe.
- Top recurring issues: The most frequently appearing error and warning messages, helping you identify systemic problems faster.
- Recent errors and warnings: The latest error and warning log entries for immediate investigation.
Direct links to  Logs are included throughout, so you can drill deeper into any area with a single click.
Dashboards updated
Log insights are now available in the following Kubernetes dashboards with Kubernetes version 1.42:
- Kubernetes cluster
- Kubernetes namespace - workloads
- Kubernetes namespace - pods
- Kubernetes nodes - pods
Feature updates
Account Management | Subscriptions and Licensing
Improved process for purchasing Dynatrace Platform Subscriptions
Purchasing Dynatrace Platform Subscriptions via private offers on the Azure Marketplace is now easier. The updated interface and workflow let you synchronize your Dynatrace Platform Subscription start and end dates with your Azure SaaS subscription, so contract periods align.
For more information, see Azure Native Dynatrace Service.
AI Observability | AI Observability
OpenInference instrumentation support for AI applications with OTel
Dynatrace now supports AI applications instrumented with OpenInference. You can ingest OpenInference traces and normalize OpenInference semantic conventions to Dynatrace gen_ai.* attributes using either OpenPipeline or an OpenTelemetry Collector.
This enables AI Observability for OpenInference-instrumented applications, including visibility into model usage, token consumption, prompts, completions, agents, tools, embeddings, and guardrails within  AI Observability.
Application Observability | Distributed Tracing
Yii framework support for PHP applications
We’ve added support for the Yii framework for PHP applications.
Application Observability | Distributed Tracing
Added support for Go library aws-sdk-go-v2/service/sqs
OneAgent now supports monitoring AWS SQS services in Go applications.
Application Observability | Distributed Tracing
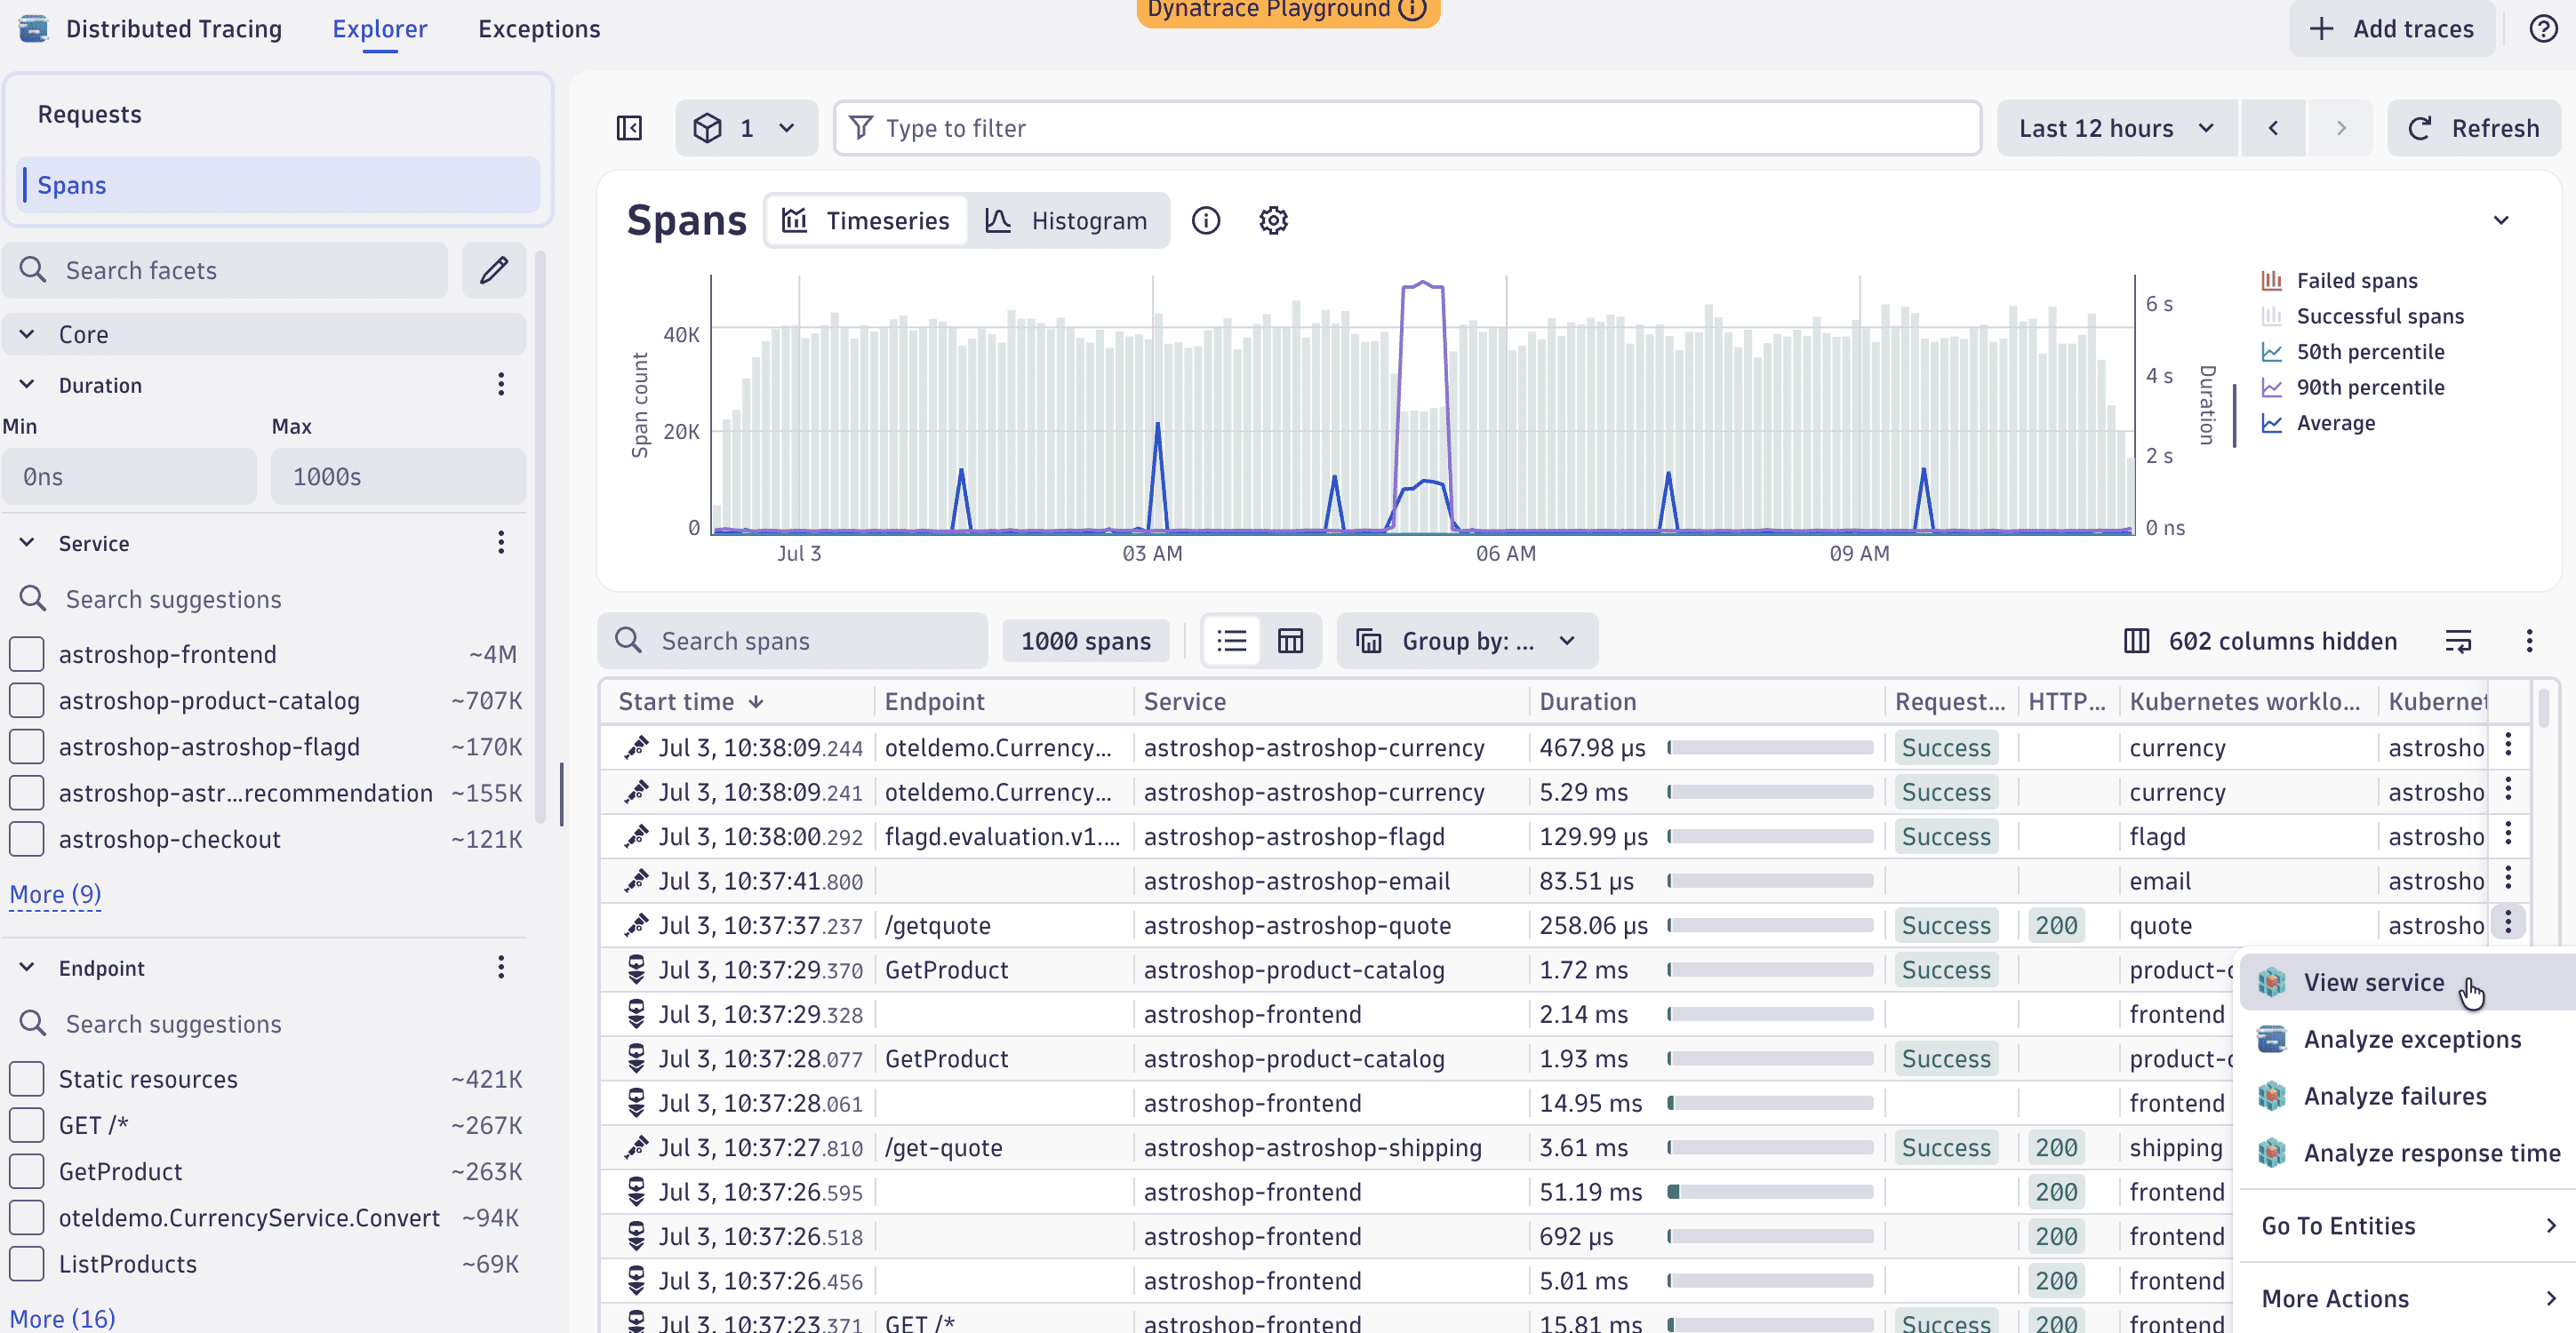
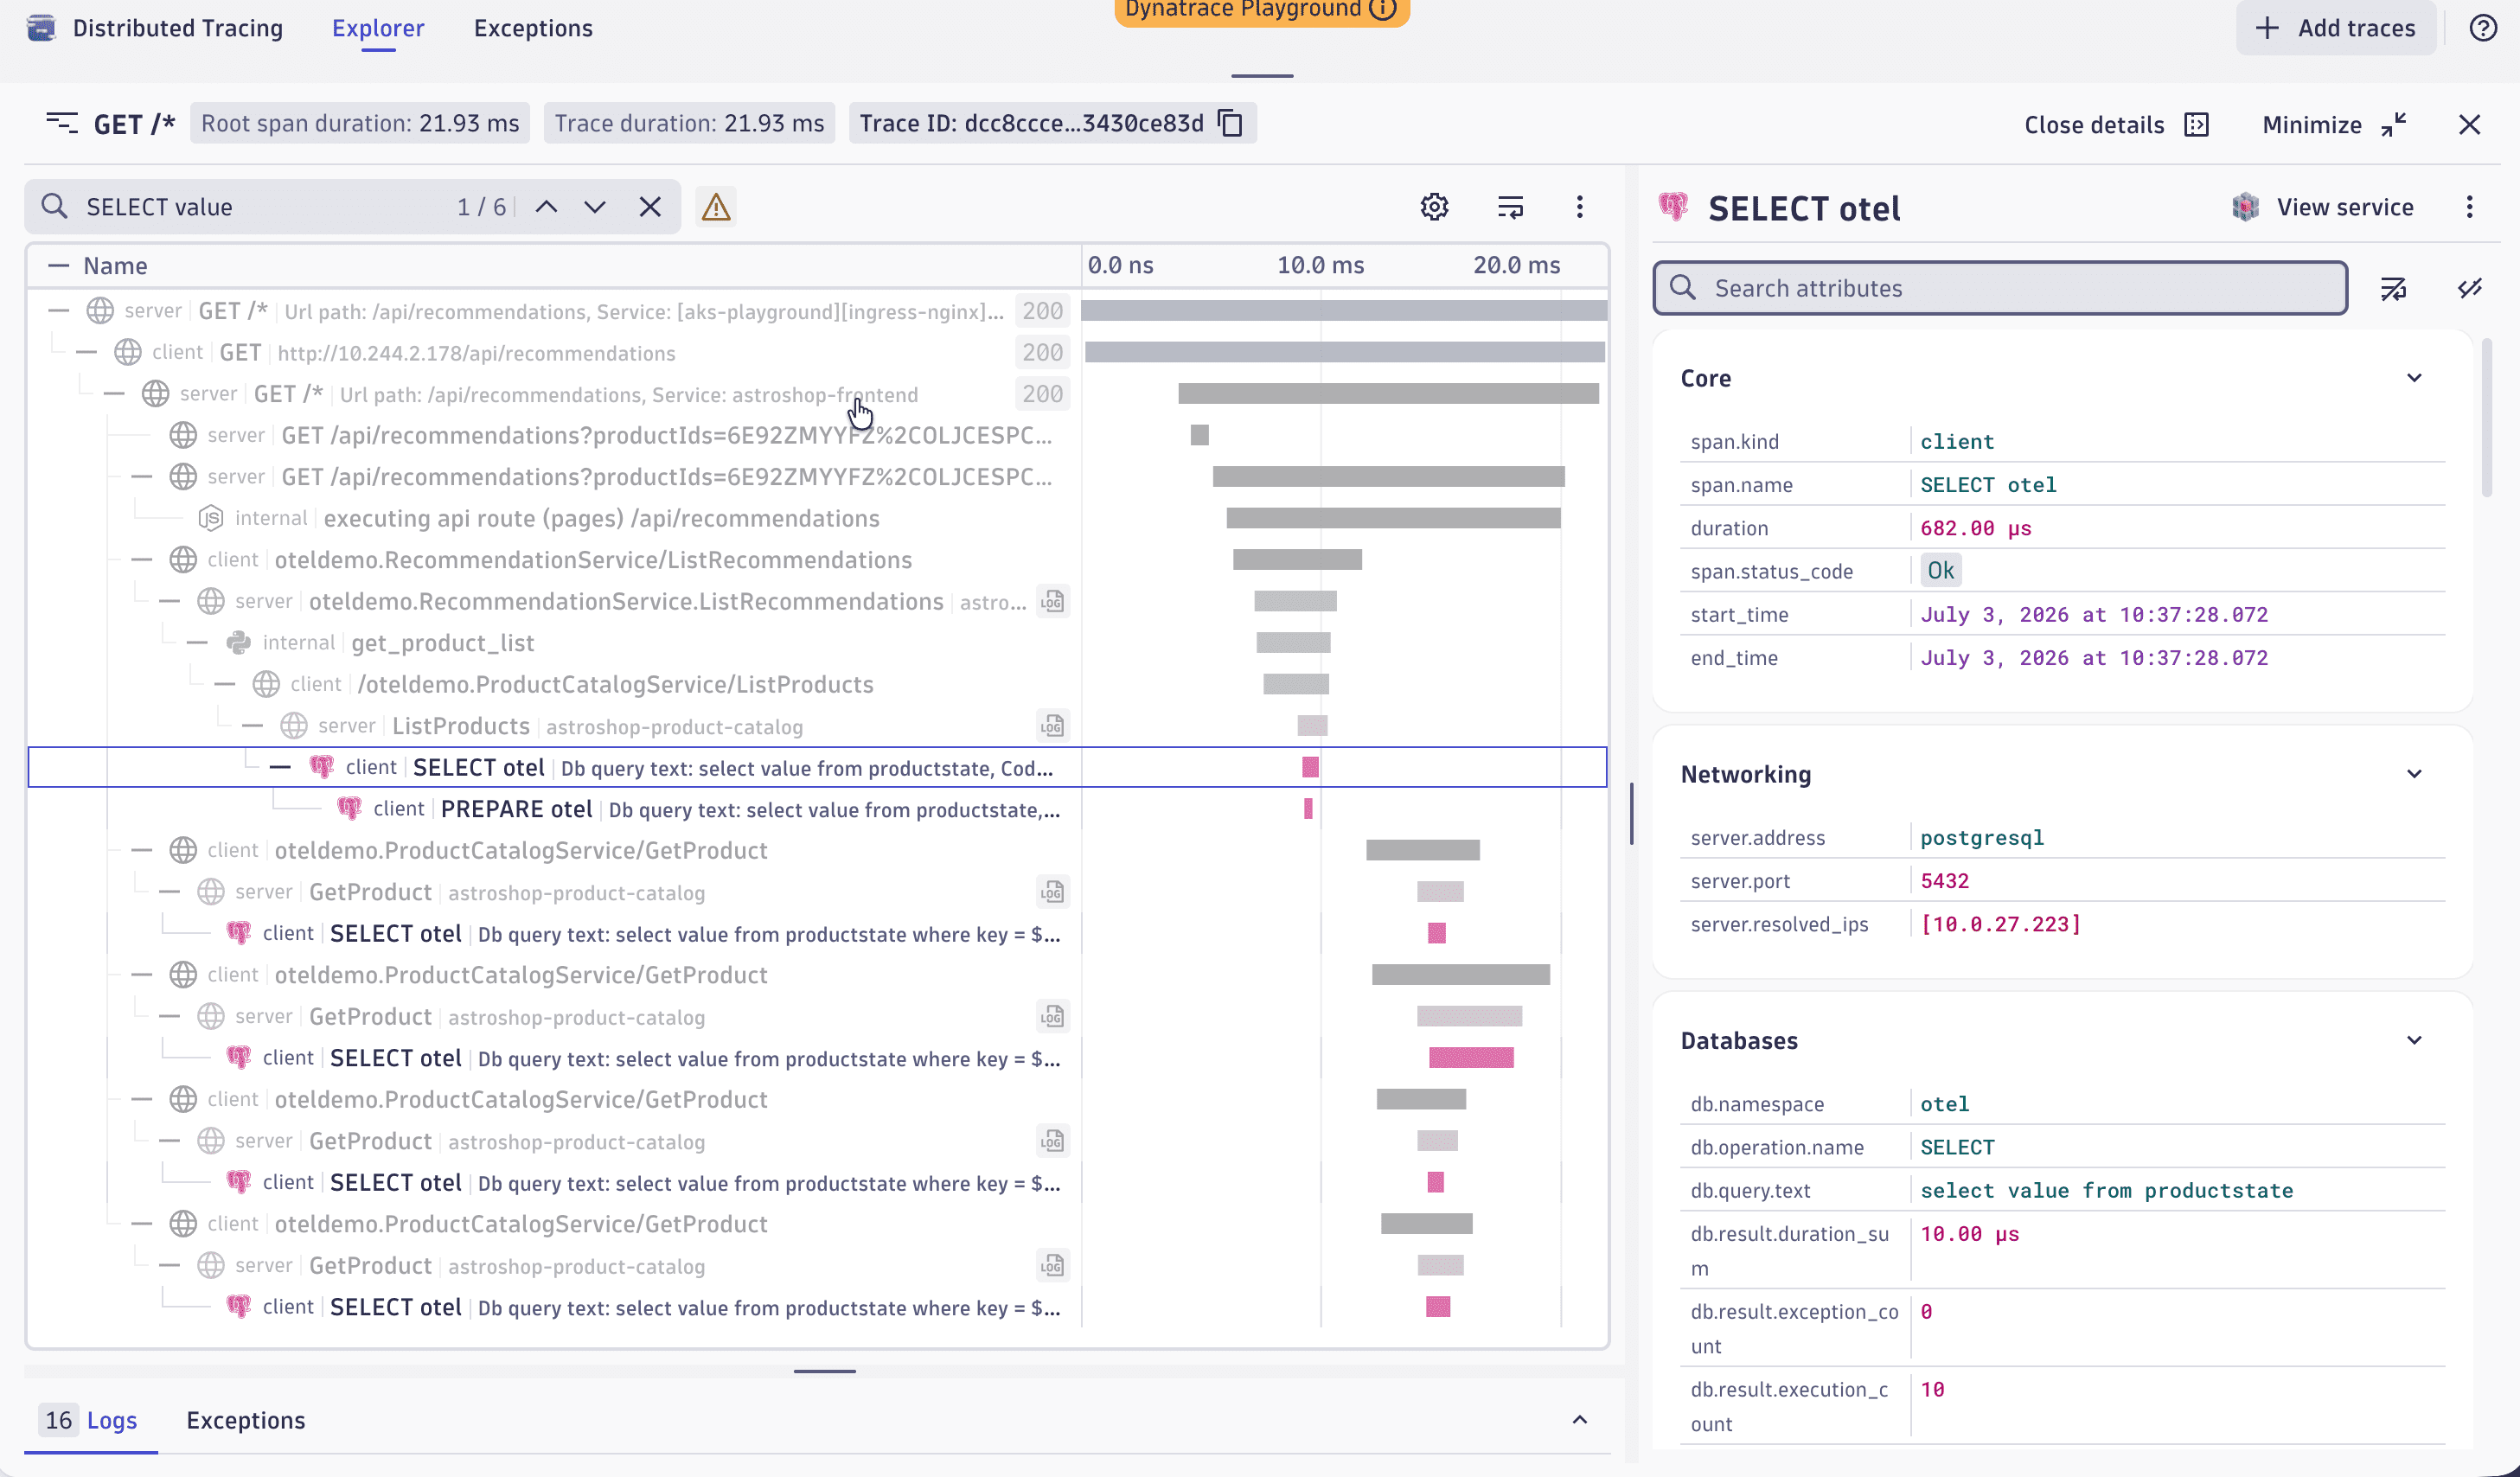
Investigate traces faster with improved search, shortcuts, and facets
Investigating traces just got faster. Distributed Tracing introduces a set of focused improvements that reduce friction in trace analysis and keep experienced users in flow.
- Primary and domain tags in the facets panel—filter and narrow traces by the dimensions that matter most to your team, without digging through span attributes manually (Primary Grail tags and fields).
- Improved search across all span attributes—search now matches across every span attribute, with steppers to jump between results, so finding the right span in a deep trace no longer means scrolling manually.
- Extended keyboard shortcuts—press L on a span list row to open related logs, T on an exception grouping to view traces, and Escape to close a detail panel and return focus to the table.
- Refreshed drill-down action layout - improved visual clarity for faster navigation.
Application Observability | Services
Consistent endpoint naming for HTTP-based SDv2 services
Service Detection v2 (SDv2) now derives the same clean HTTP routes as SDv1, ensuring consistent endpoint names regardless of how a service is detected.
- Derived route fallback: When instrumentation doesn't send
http.route, SDv2 builds one from the URL path, trimming dynamic segments such as long IDs, hex tokens, and mixed-case or all-caps identifiers. A supportability flag marks routes that were derived rather than ingested. - Cleaner defaults: Because every HTTP endpoint now gets a route, the
{method} /*fallback is retired for new environments.
Application Security
Cloud-native tagging support for security events
Primary Grail tags and fields are now available on security finding and scan events for Runtime Vulnerability Detection and Runtime Application Protection.
Application Security
Surface security information on Kubernetes entities
Kubernetes entity detail pages in Kubernetes now include a dedicated security panel. You can see vulnerability and attack exposure directly on cluster, namespace, workload, and node entities, and drill through to  Vulnerabilities,
  Threats & Exploits, or
  Security Posture Management for full details.
Application Security | Vulnerabilities
Native Runtime Vulnerability Analytics settings
We have updated the settings experience for Runtime Vulnerability Analytics with a new native interface.
- Management-zone-based TPV monitoring rules have been removed.
- Technology-specific TPV monitoring toggles have been removed.
If you have no monitoring rules configured, your cluster will automatically migrate to the new resource-attribute-based monitoring rules.
Digital Experience | Synthetic
New Browser Monitor metrics
We've added two new browser monitor metrics.
dt.synthetic.browser.(step).user_actions.durationdt.synthetic.browser.(step).user_actions.total_duration
These show the duration of user actions in browser monitors, with information sourced from the new RUM JavaScript.
Digital Experience | Synthetic
Credential Vault Platform API
A dedicated Platform API for the Credential Vault is now available in Latest Dynatrace. It provides programmatic management of stored credentials used by synthetic monitors and other platform components.
Base URL:
https://<env-id>.apps.dynatrace.com/platform/credential-vault/v1
Details
The API supports full lifecycle management of credential vault entries:
- List all stored credential entries
- Create new credential entries
- Read metadata of a specific credential entry
- Update an existing credential entry
- Delete a credential entry
All credential types supported by the Credential Vault are available through this API.
Authentication: Requires an OAuth 2.0 Bearer token. Use a platform token (dt0s16.*) for personal and user-context automation, or an OAuth client with the client credentials grant for service-to-service integrations.
Required permissions: credential-vault:entries:read, credential-vault:entries:write, credential-vault:entries:admin — assign only the permissions required for the use case.
Maturity: All endpoints are currently in Early Adopter status. Non-breaking changes may be introduced without a version increment. Clients should handle unknown enum values gracefully.
For the full endpoint reference, see the Credential Vault Platform API Swagger.
Impact
Classic credential vault access via the Environment API remains available and is not removed. The Platform API is an addition. Migrating to the Platform API is recommended for Latest Dynatrace integrations.
Infrastructure Observability
Infrastructure Observability settings
Infrastructure Observability settings now follow a consistent, modern design that aligns with other Dynatrace apps and supports a more intuitive configuration workflow. This includes host resource saturation, process availability, and connectivity alerts for hosts; traffic monitoring for networks; cluster, namespace, node, and workload anomaly detection for Kubernetes. You can also access the most commonly used settings directly from within each app without navigating away, using the icon in the app header.
Infrastructure Observability | Clouds
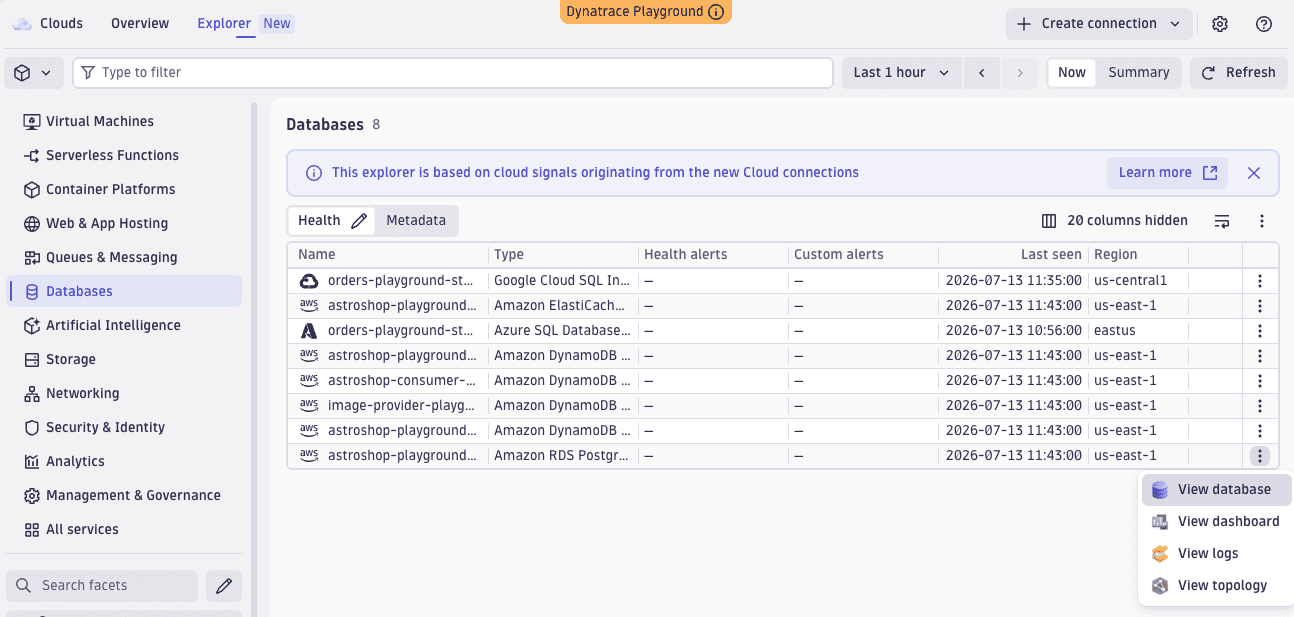
Improved navigation and domain interlinking in  Clouds
Standardized drill-down navigation has been added across list screens, detail screens, and charts in the latest version of the Clouds app. These drill-downs provide direct contextual links into related domains — including Services, Kubernetes, Databases and Infrastructure & Operations — enabling deeper insights and explorative analysis without manual context-switching.
Infrastructure Observability | Extensions
Extension framework now supports primary tags and fields
The extension framework now supports primary tags and fields. Define them manually in the extension config for each endpoint for the whole config. Local extensions executing on OneAgents will also populate all ingested data with the fields and tags defined within the scope of the OneAgent.
Infrastructure Observability | Hosts
OS services in Smartscape
OS services can now be queried from the Smartscape storage via smartscapeNodes OS_SERVICE.
For more information, see Smartscape - Core Entities.
Infrastructure Observability | Infrastructure & Operations
Fast Grail-powered inventory Explorer in  Infrastructure & Operations
Infrastructure & Operations has a new Explorer, fully powered by Grail, that provides significant performance improvements. It requires OneAgent version 1.337+ as well as the latest versions of technology extensions (there’s a new major version for each).
The Explorer Classic will be retained temporarily in a separate tab for backward compatibility.
Infrastructure Observability | Infrastructure & Operations
Platform token support extended to classic REST APIs
Platform tokens can now be used to authenticate classic REST APIs for OneAgent management and network zones, in addition to the existing access token support.
Platform
Manage Grail Files
Managing lookup tables in Grail is now simpler and more accessible through a new Settings UI “Grail Files” within the Storage Management. Instead of depending on APIs and manual query-based steps, you can browse files, inspect lookup contents, and upload lookup tables with guided help for the parser pattern and a visual preview of the result. When reference data changes, you can re-upload files and reuse the saved pattern, which reduces repeated effort.
Platform
Descriptive browser tab titles
Dynatrace browser tabs now show the app and environment name, so you can tell your open tabs apart without switching between them. The title updates automatically as you navigate.
Platform
View S3 log ingestion status in Lifecycle Management
S3 bucket log ingestion is now visible with volume visualization and guided setup links in the configuration wizard.
Platform
Latest Dynatrace REST API for ActiveGate tokens now generally available
The latest Dynatrace REST API for ActiveGate tokens is now enabled by default and available via the platform domain. The API is accessible with the default Dynatrace administrator policy, and public OpenAPI documentation is available for all stages.
Platform | Dashboards
Improved discovery of ready-made dashboards
Ready-made dashboards let you get insights faster without writing complex queries. This release closes key gaps in how users find, install, set up, and customize ready-made dashboards — reducing friction for new users onboarding and making it easier for experienced users to build on best-practice templates.
Discoverable ready-made dashboards
When a document search or document list returns no results, users are now guided directly to the Hub to discover and install relevant ready-made dashboards. This turns a dead end into an onboarding moment.
Documents tab in extension details
The extension app now includes a dedicated Contents tab, giving users a clear path from an installed extension to its associated ready-made dashboards.
Platform | Dashboards
Further improvements to the Annotations experience on dashboards
The global selector is now shown only when at least one annotation exists, and users get faster creation and richer display/customization options (pills, variables, “Open with”, icon & color pickers). Data mapping is now optional to reduce setup friction.
Platform | OpenPipeline
GeoIP lookup for OpenPipeline (Early Access)
The new GeoIP lookup processor in OpenPipeline can automatically enrich logs, spans, metrics, events, user events, and user sessions with geographic information based on IP addresses in records.
Platform | OpenPipeline
OpenPipeline ingest API for Smartscape nodes and edges
OpenPipeline now supports direct ingest and processing of Smartscape nodes and edges via Smartscape events, giving customers access to all incoming Smartscape records, including extracted ones. The new Smartscape Ingest API introduces the following ingest sources:
- Public REST endpoint
- Cloud monitoring endpoints
- Smartscape extraction endpoint
Additionally, there is a dedicated OpenPipeline configuration scope that supports default pipelines, routing, processing, permission, and cost allocation stages.
Note: currently, entities created by OneAgent and the Kubernetes monitoring are not running through OpenPipeline.
Platform | Problems
Improved problem journey experience
This release brings improvements across multiple areas of the  Problems.
Problems List — Added an entity names column with drilldown badges, plus new impact level and free-text filters (searches event name, description, alerting profile, and tags). Both filters work in OpenPipeline and notification routing.
Problems Problem Detail — Impact tiles now show entity counts with cleaner labels and are fully clickable. Baselining charts use readable metric names instead of raw IDs. The automation tile now includes the problem ID and an Open with action. Visual Resolution Path nodes open a Smartscape Topology modal in context.
Problems Data — Grail problem records now include an affected_entity_names array (aligned with existing entity ID/type arrays), also extended to Smartscape 2.0 entities for easier lookups in workflows and integrations.
Visual Resolution Path / Smartscape — Nodes now show up to 3 recommended intents (up from 1). Legend state persists across sessions. Nodes with active problems auto-surface relevant drilldowns (for example, Analyze slowdown/failures).
Failure Analysis & Exceptions — Several usability fixes: clearer failure reason formatting, an improved Analyze details switch, better handling for single-service cases, clearer empty states for outbound calls, updated Message Processing tab wording, and a fix for the info icon shrinking on smaller screens. The CPU profiling drilldown has also been replaced with Method Hotspots, which better matches where most users need to go.
Platform | Settings
Log module custom log source settings widget now available
The settings widget for Log module custom log source settings is now available in Latest Dynatrace.
Software Delivery | Release Monitoring
New ready-made release monitoring dashboard
The new release monitoring dashboard provides instant insights into the released components in the environment. Selected filters provide tailored information on released components, organized by environment (stage) and version, including detected problems and vulnerabilities.
Breaking changes
Application Observability | Services
Smarter endpoint names for SDv1 services
Endpoints are now easier to read and more useful out of the box.
- Cleaner endpoint names by default. WebRequest endpoints now derive a stable route from the URL path, with UUIDs, IDs, and other volatile segments stripped automatically. No more generic
GET /*for traffic that should be grouped meaningfully. - A new clean-URL placeholder. Use the sanitized URL path (your custom cleanup rules included) directly in request-naming rules. Available to everyone, no opt-in needed.
- More control in naming rules. URL path and query attributes can now be used in custom placeholders, so REST-style services that encode meaning in the path or query name correctly.
- Endpoints for more service types. Web, Custom, RPC, and mainframe (CICS/IMS) services now produce endpoint metrics in Grail.
The new default route replaces existing GET /* endpoints, and URL-path patterns that previously went unresolved now resolve. This is a behavior change, rolled out gradually and coordinated with your team.
Infrastructure Observability | Kubernetes
Deprecated Kubernetes metrics removed from Grail
We have discontinued forwarding of Classic Kubernetes metrics to Grail.
Affected workload metrics:
dt.kubernetes.workload.requests_cpudt.kubernetes.workload.limits_cpudt.kubernetes.workload.requests_memorydt.kubernetes.workload.limits_memorydt.kubernetes.workload.cpu_usagedt.kubernetes.workload.cpu_throttleddt.kubernetes.workload.memory_working_setdt.kubernetes.workload.containers_desired
Affected node metrics:
dt.kubernetes.node.requests_cpudt.kubernetes.node.limits_cpudt.kubernetes.node.requests_memorydt.kubernetes.node.limits_memorydt.kubernetes.node.cpu_usagedt.kubernetes.node.cpu_throttleddt.kubernetes.node.memory_working_setdt.kubernetes.node.pods
This change only affects customers who had the legacy forwarding feature explicitly enabled. Customers using native Grail Kubernetes metrics are not affected.
For more information, see Kubernetes metrics migration guide.
Platform | OpenPipeline
OpenPipeline Configurations API will be sunset in June
The legacy Configurations API for OpenPipeline (GET all configurations and other pages in the same section) was deprecated in November, 2025, with Dynatrace version 1.327. It was replaced with a configuration based on the Settings API, which immediately delivered a fine-grained permission model. Since then, we’ve been adding new features for OpenPipeline that you can configure only via the Settings API.
- If you're using the Dynatrace web UI, this is a non-breaking change for you, with slight differences in the permission model.
- If you're using the API or Configuration as Code, Dynatrace converts the configuration, which can then be downloaded and merged into your repository. You can trigger the migration in
 Settings. For details, see Migrate OpenPipeline configurations to Settings API.
On June 29, 2026, we will deactivate the legacy Configurations API and migrate all environments to the new configuration based on the Settings API.
Fixes and maintenance
Resolved issues in this release (SaaS)
- Go improved static injection [opt-in] is now deactivated by default for new configurations. If you’ve customized this setting, your configuration is preserved. This change applies to Dynatrace version 1.337+. (OA-66375)
- OS service events now also have the
OS_SERVICESmartscape entity attached. (DI-29015) - Fixed the Maintenance Window filter entity type lookup to avoid matching all entities for unknown entity types. (DI-28768)
- Fixed repeated
WARNINGlogs fromDavisGenericEventBuilderaboutsmartscape.rootcause_entitynot being part of thedavis.eventSemantic Dictionary model during problem update ingestion. (DI-28569) - In Logs, the
limitcommand in the DQL query no longer overrides the configured records limit. To increase the limit for your query, go to Logs > App settings directly. (APPOBS-36072)