AI Observability app
- Latest Dynatrace
- App
- 4-min read
 AI Observability provides end‑to‑end visibility for AI workloads across services, LLMs, agents, and protocols.
- Out‑of‑the‑box analytics
- Auto‑instrumentation
- Targeted metrics
- Debugging flow
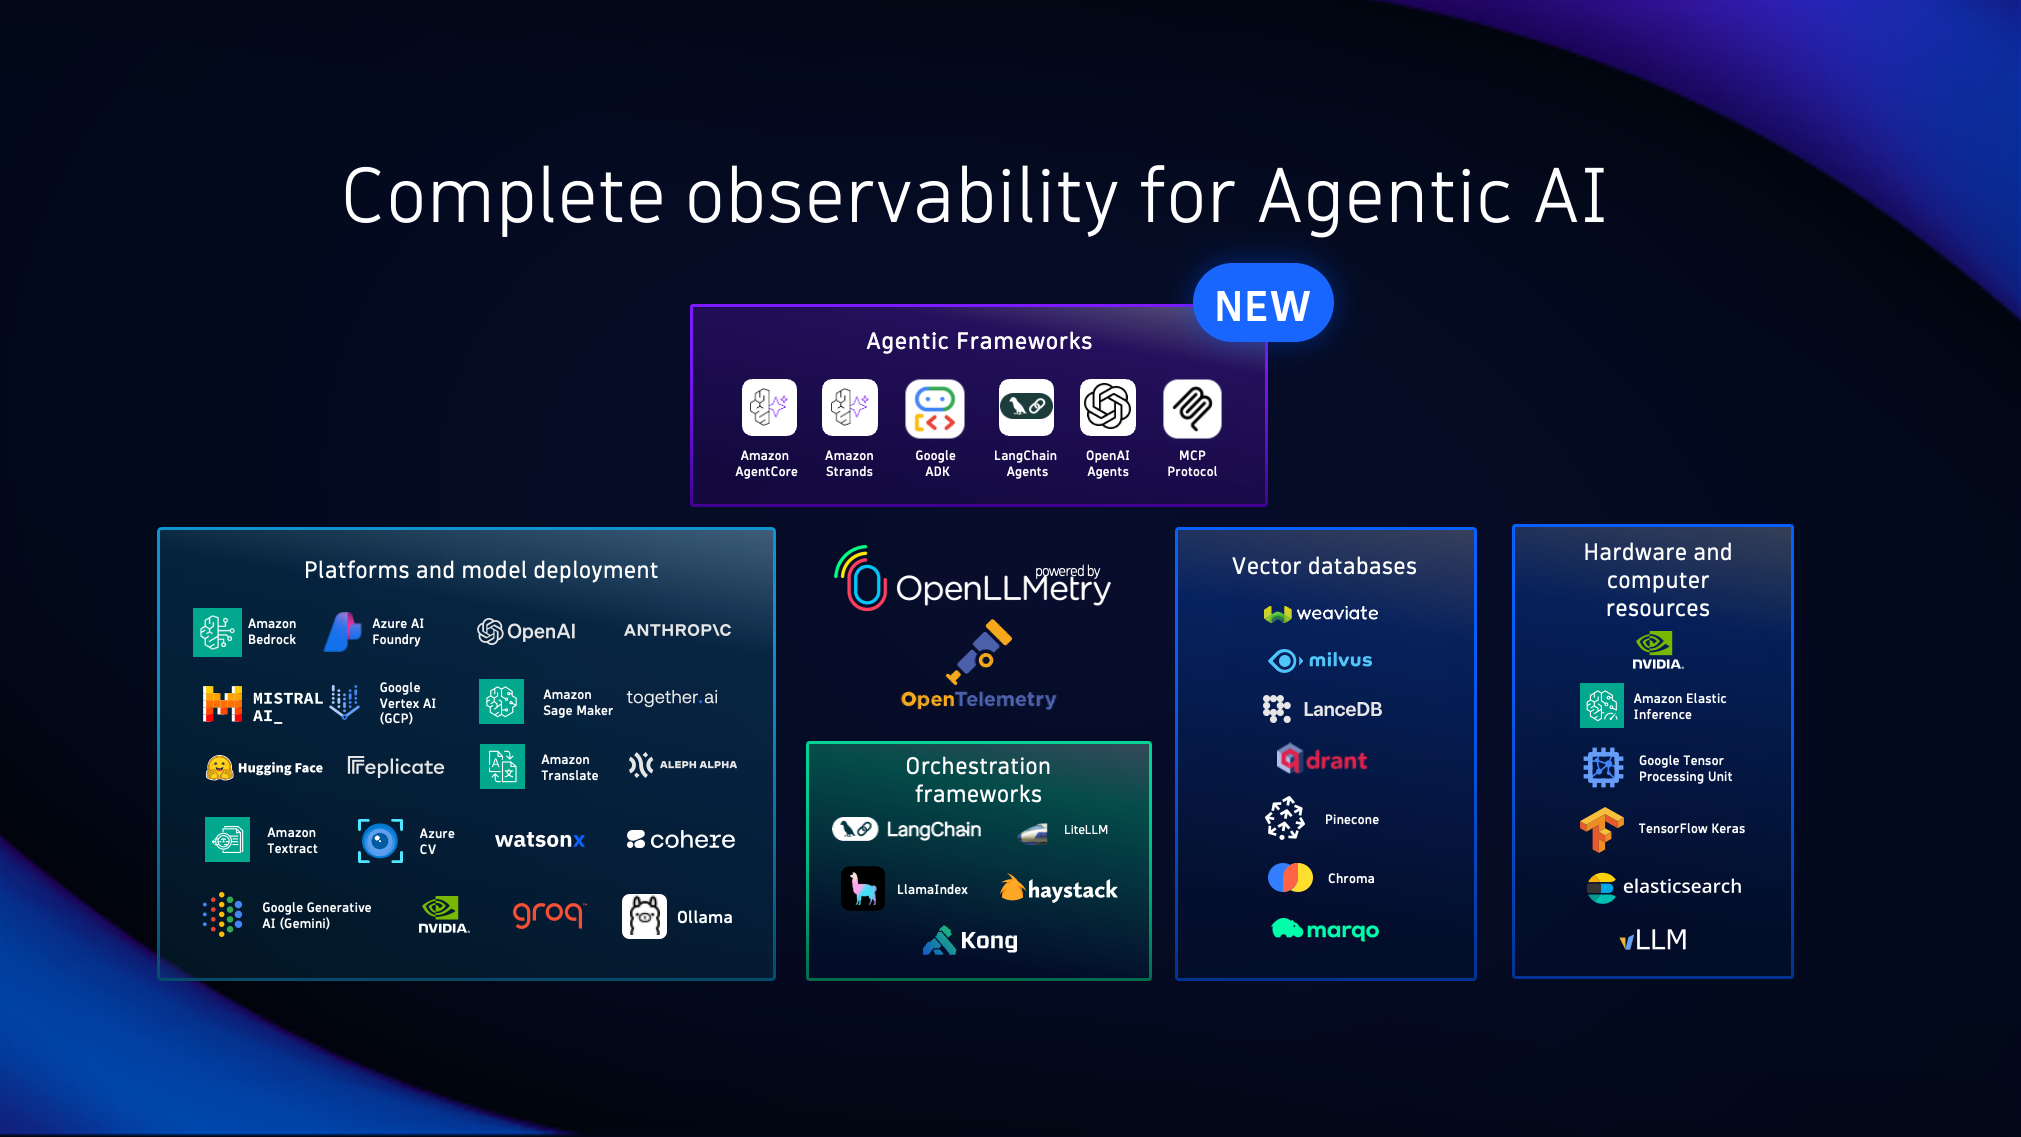
- Support for 20+ technologies, including OpenAI, Amazon Bedrock, Google Gemini, Google Vertex, Anthropic, and LangChain
- Ready‑made dashboards
Prerequisites
To use AI Observability, you need:
-
A Dynatrace Platform Subscription license with the following rate-card capabilities:
-
The following permissions:
davis:analyzers:executeenvironment-api:entities:readstorage:entities:readstorage:metrics:readstorage:spans:read
-
For dashboards to render data properly, make sure that you add all GenAI
Required,Conditionally required, andRecommendedattributes to your spans. For more information, see Semantic Conventions for GenAI agent and framework spans
Some out-of-the-box AI Observability dashboards use span queries, which consume Traces powered by Grail - Query. This is true even if AI Observability isn’t fully configured yet, or the dashboards show no data.
To control your trace consumption, you can:
- Use the sampling variable on these dashboards (where available) to reduce the number of spans queried.
- Restrict access to exploratory dashboards only for relevant users.
- Prefer metrics-based tiles and views when possible.
Note that we're currently working on reducing costs for both AI Observability and Dashboards, by moving away from span queries.
Get started
AI Observability has an integrated onboarding flow that guides you through all the required steps to start ingesting data.
You can get data from:
- OpenTelemetry.
- Open source auto-instrumentation libraries like OpenLLMetry.
- Dynatrace OneAgent.
- Directly pulling the data from cloud providers through cloud monitoring.
Additionally, you can instrument your AI applications and services directly using OpenTelemetry with GenAI semantic conventions for full control and standardized observability across your entire stack.
For working examples of AI agent instrumentation using OpenTelemetry, see Dynatrace agentic AI instrumentation examples.
Concepts
Here's how the different tabs in AI Observability work, and what you'll use them for.
The tabs are: Overview, Explorer, Prompts, and Agents topology.
All tabs share the same general filtering capabilities. Use the left-hand filter menu to organize your data by, for example, Type, Agent, Model, Provider, Service, and the presence of an Evaluation score.
For information about GenAI concepts in Dynatrace, see Terms and concepts about AI Observability and GenAI in Dynatrace.
Dynatrace does not enforce runtime guardrails. Providers expose these signals, which Dynatrace captures and visualizes.
Configure guardrails at the provider level for lowest latency and complexity.
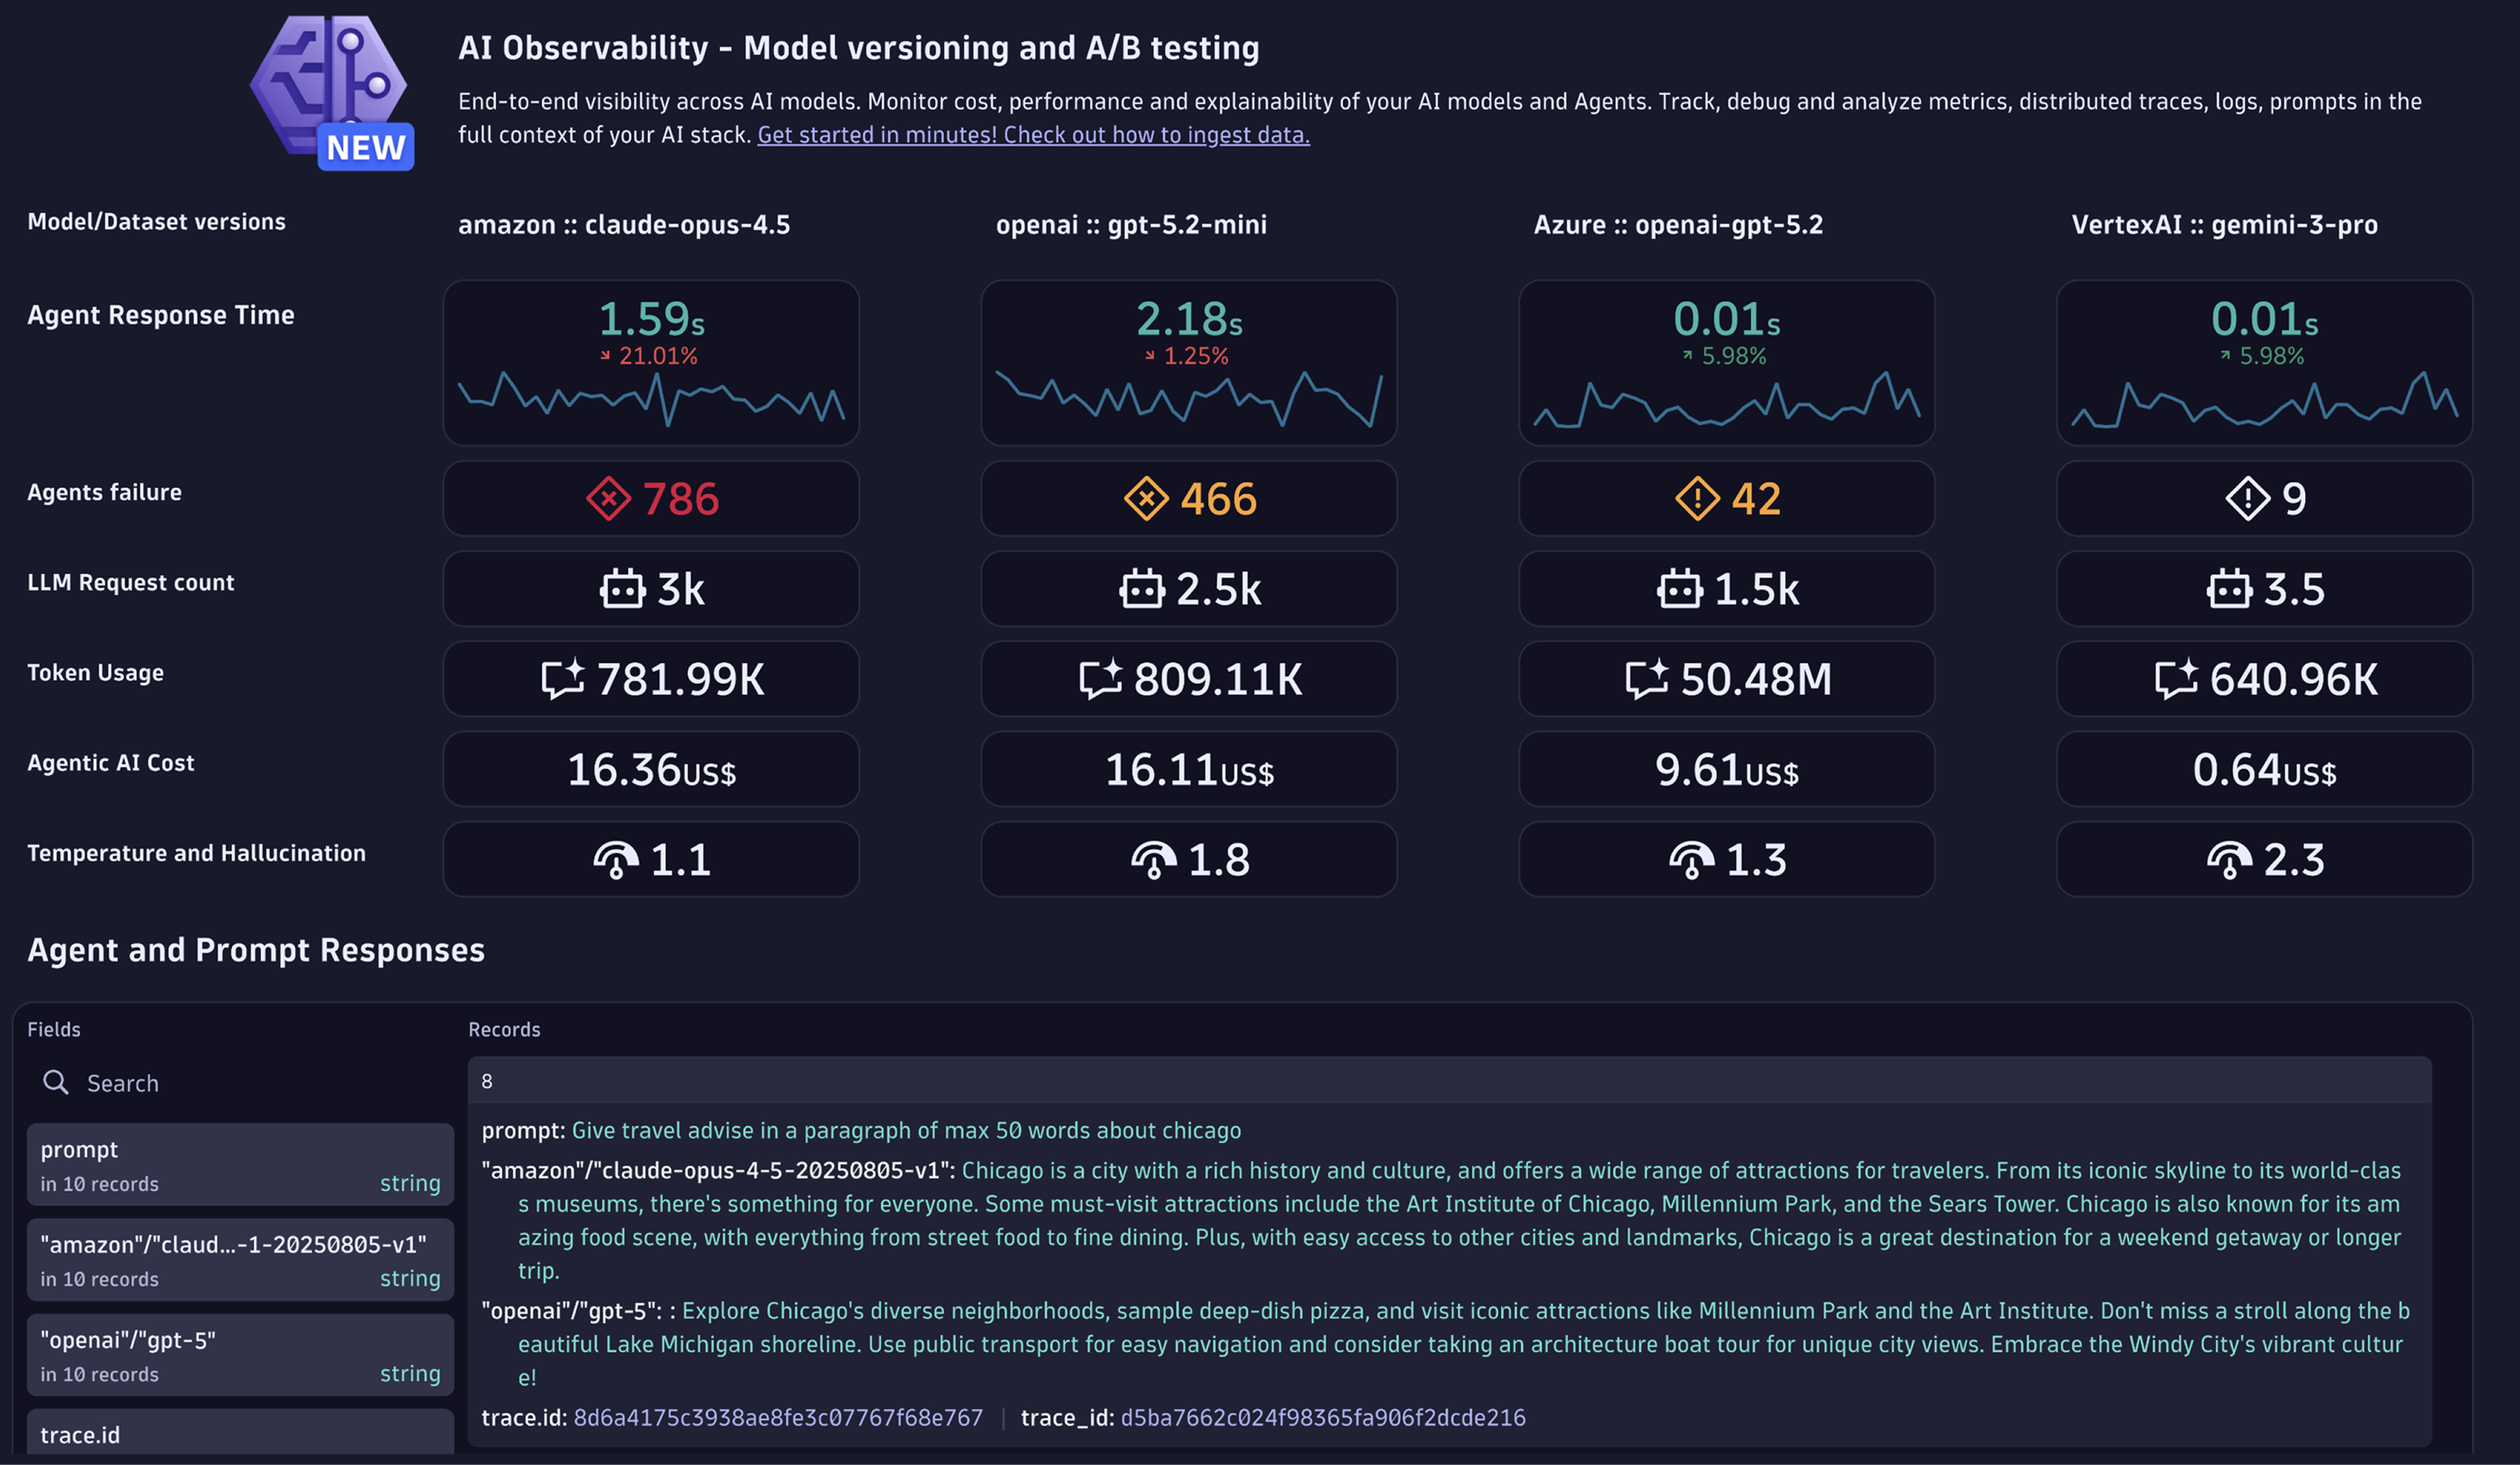
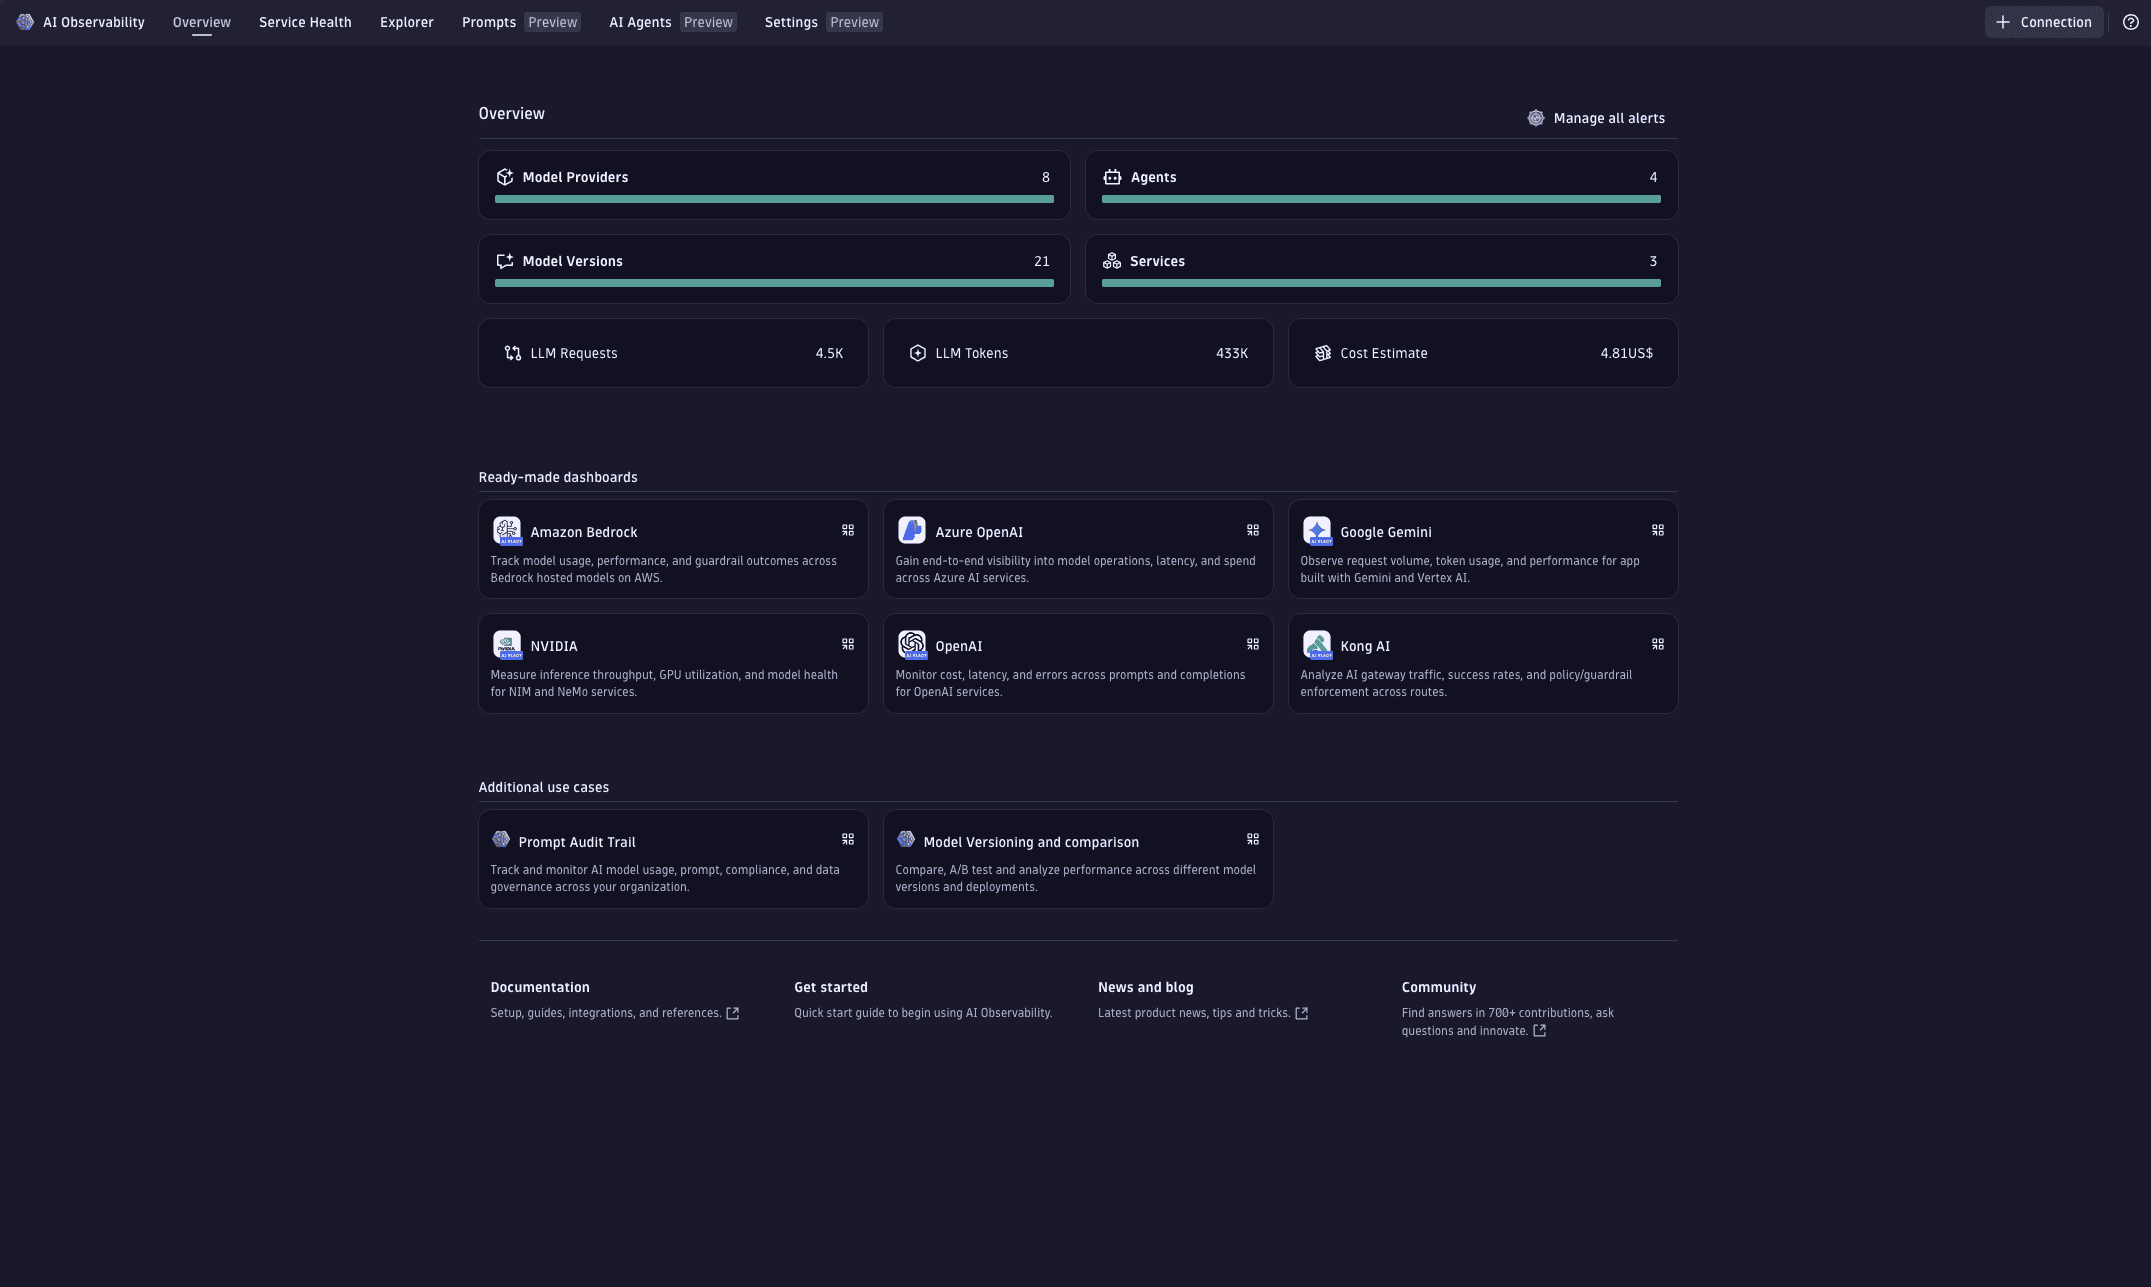
Overview tab
The Overview tab is your starting point to:
- Discover AI workloads.
- Quickly validate data ingestion.
- See a high‑level summary of health, performance, and costs across your AI services.
In this tab, you can:
-
Use the tiles to view your AI landscape at a glance. See model providers, agents, model versions, and services, plus activity such as LLM requests, token usage, and cost trends.
-
Select any tile to open the Explorer tab and drill down with deeper analysis. You can validate errors, review traffic and latency, monitor token and cost behavior, and observe guardrail outcomes.
-
Open ready‑made dashboards for popular AI services or select Browse all dashboards to find dashboards tagged with [AI Observability]. Dashboards include navigation that redirects back into
AI Observability for contextual analysis.
Explorer tab
The Explorer tab is the shared Dynatrace interface for monitoring and analyzing different technology domains. It defines a common layout with consistent filtering, perspectives, drill‑down navigation, and unified analysis.
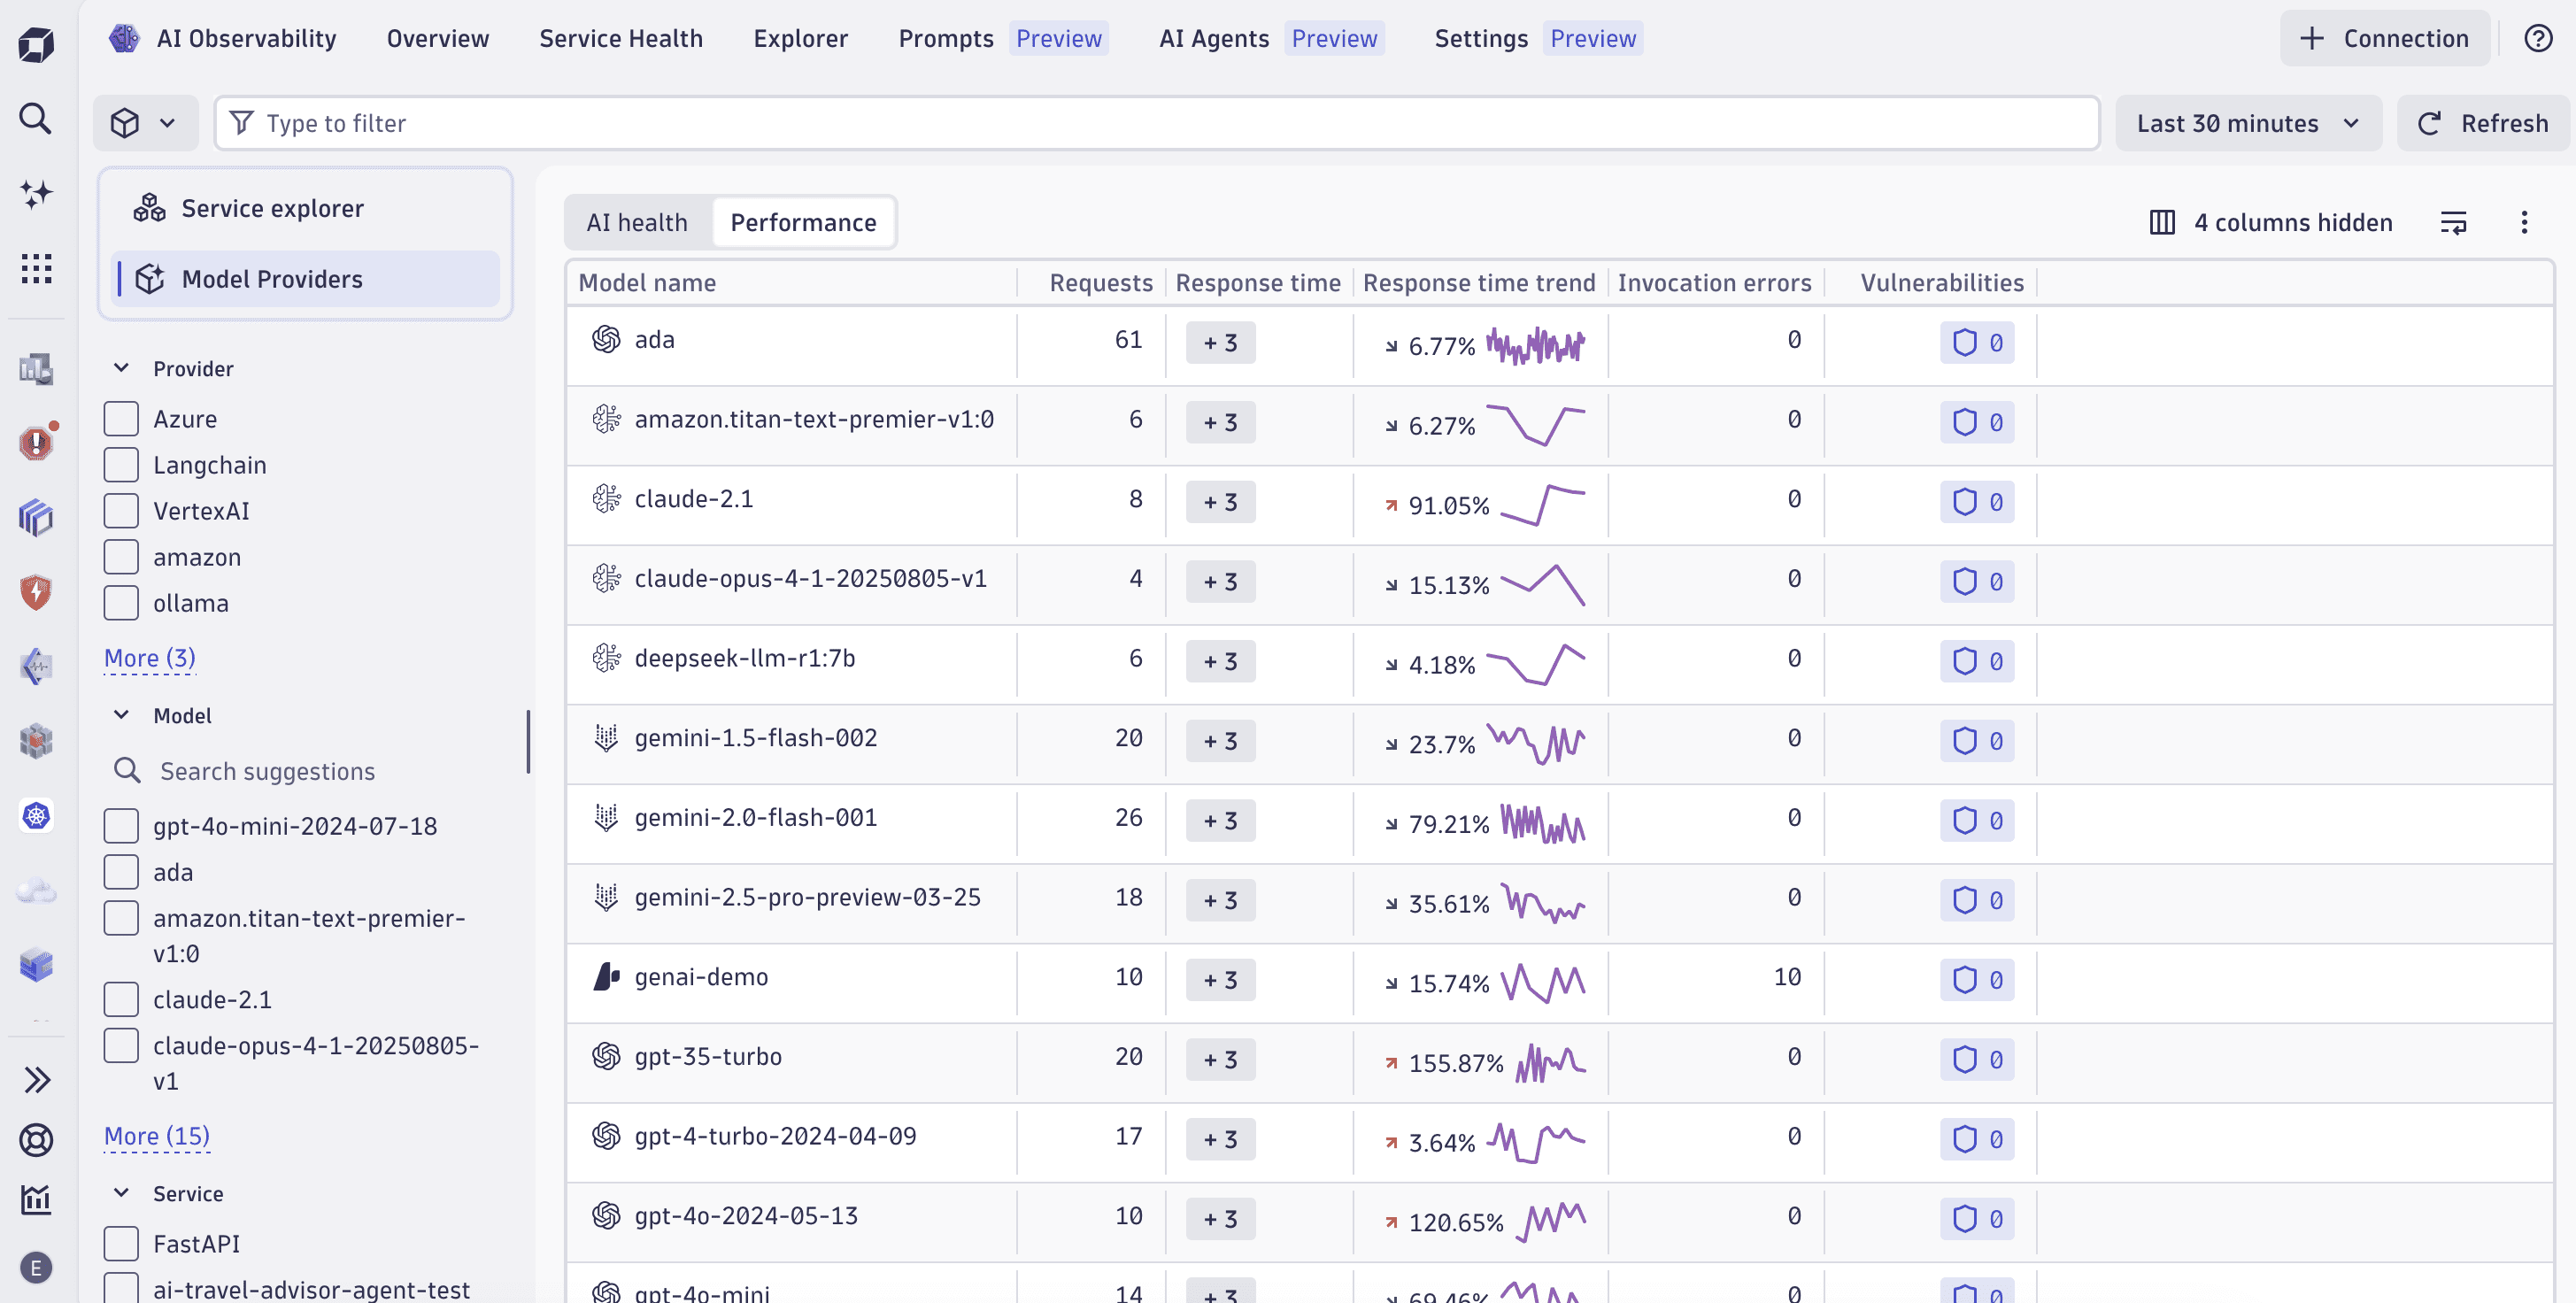
The tab provides two views that share the same set of filters:
- Model Providers: A table with insights into your AI workloads, sliced by provider, model, service name, or agent.
- Service explorer: A health charts summary that shows key metrics for your AI services.
In this tab, you can:
- Analyze all services, or quickly filter by service category or other predefined attributes.
- See counts for services, models, and agents.
- See model requests, token usage, average request duration, and overall cost.
- Track errors with information such as success and failure rates, number of problems, and counts and rates over time.
- Monitor traffic and latency, and create alerts for regressions.
- Analyze costs related to token usage, identify cost hot spots, and set proactive cost alerts.
- Observe provider-reported guardrail outcomes.
- Drill down into specific AI workload services to inspect prompts, logs, or problems.
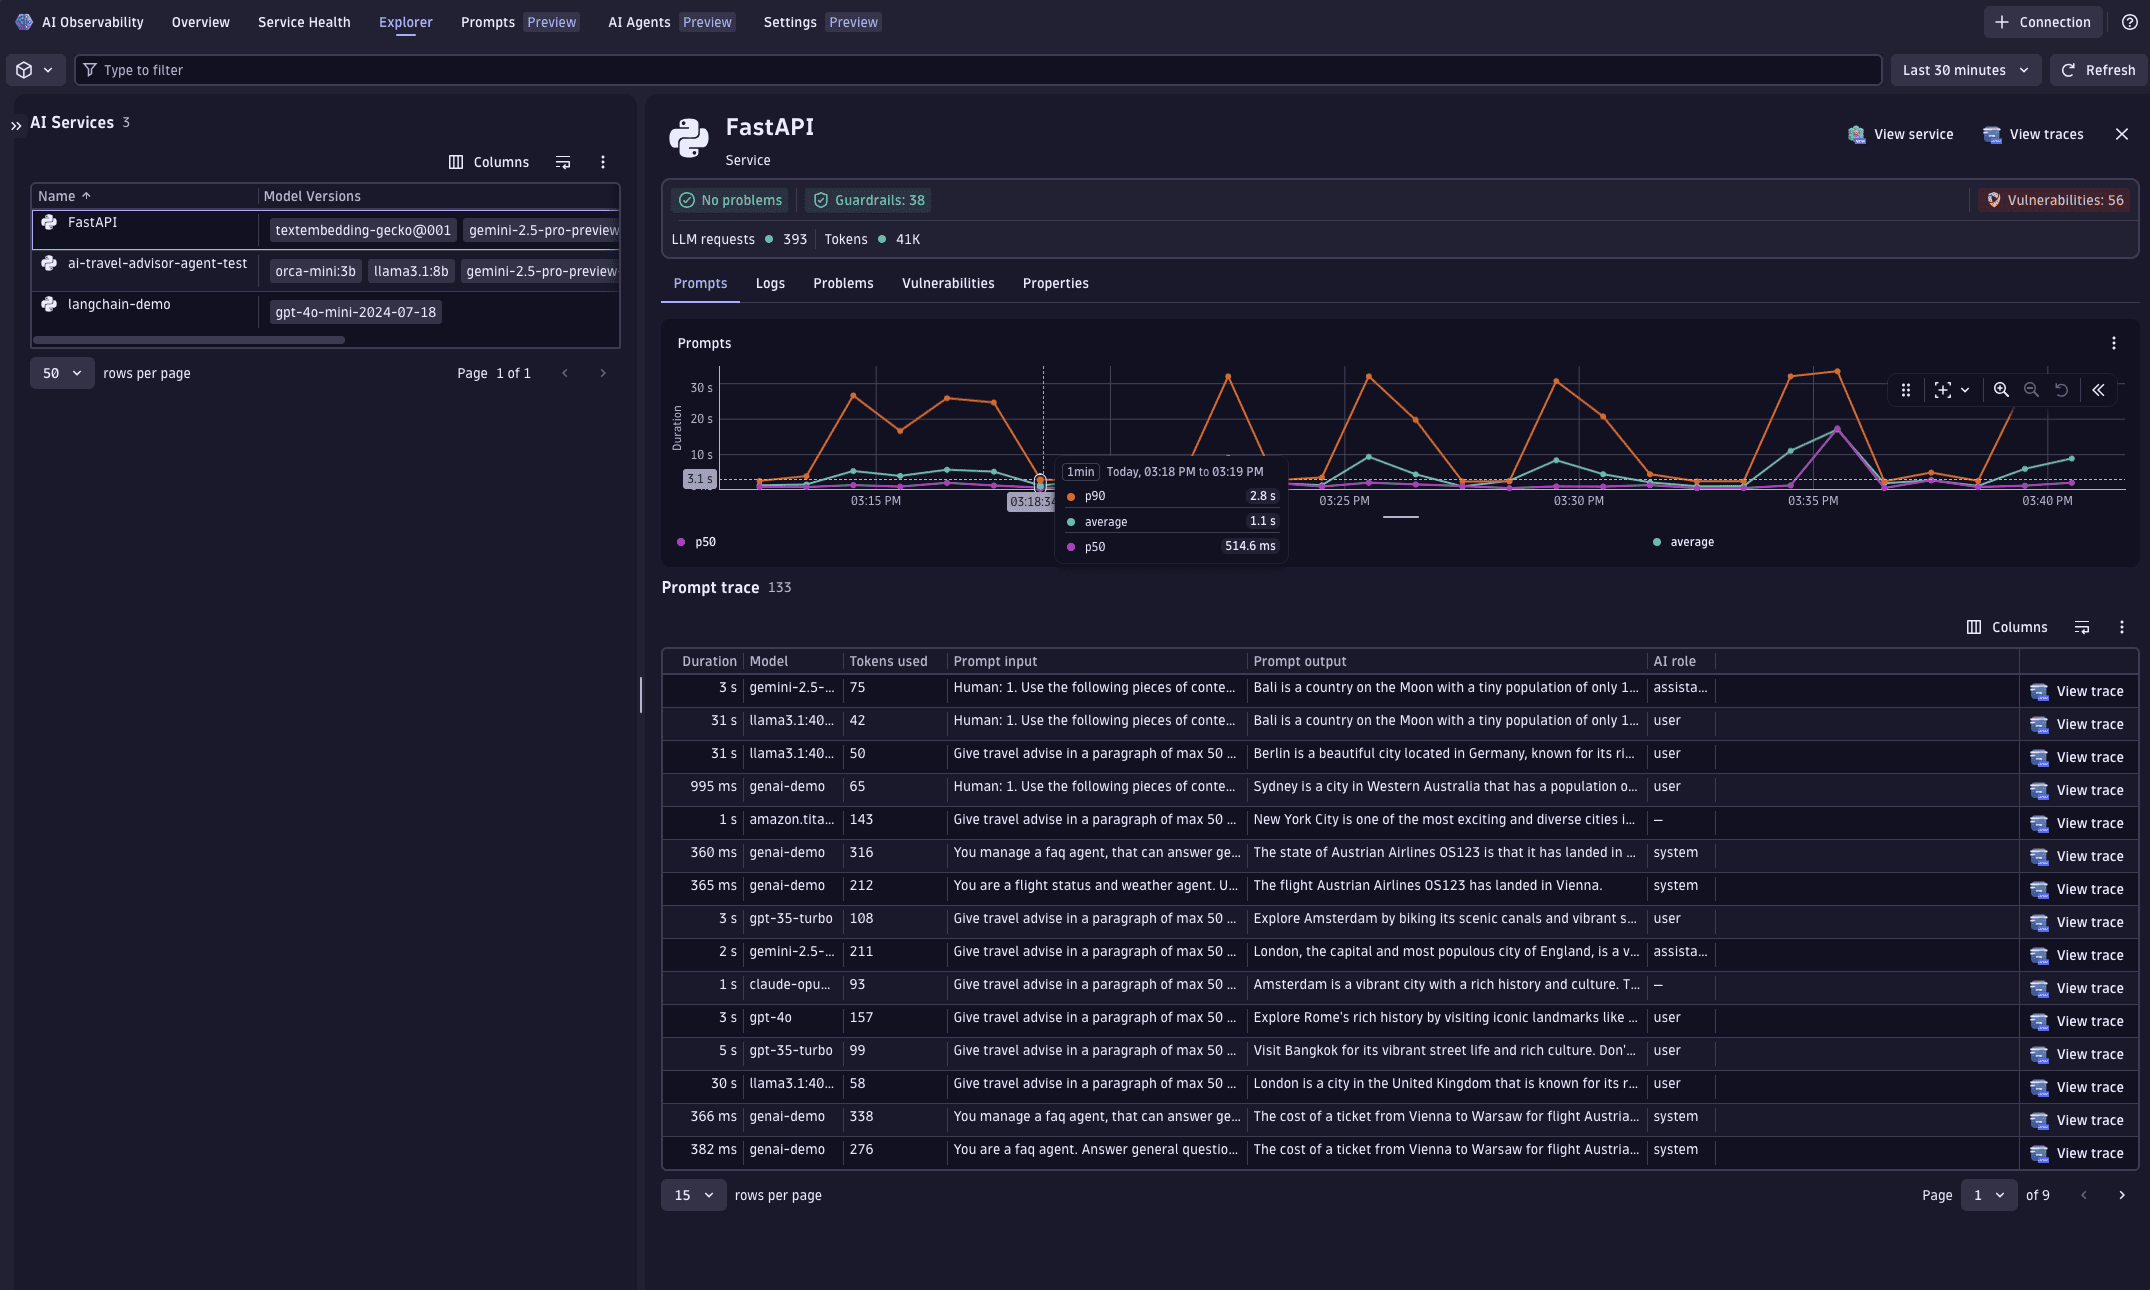
Select any service or AI model in the model providers table to open the service detail view. The header shows a summary across two dimensions:
- Service-level: open problems, endpoints, vulnerabilities, and running processes, pods, or clusters.
- AI-related: LLM request count, tokens used, and HTTP and span error counts.
Use the sections in the detail view to investigate the selected service:
- Problems and failures: HTTP errors, span errors, open problems, and failure lists, with direct links to
 Distributed Tracing (filtered to errors) and
  Problems for the selected service.
 - Vulnerabilities: Detected vulnerabilities for services, endpoints, and models. Links to
 Vulnerabilities.
 - Debug logs: Logs related to the selected timeframe, filterable by level (
WARN,INFO,ERROR,MISC). Includes a log stream and surrounding logs, with a link to Logs scoped to the service and timeframe.
 - Prompts and traces: Related prompts with span success and error status, HTTP status, GenAI service name, model version, and system prompt content. Links to Distributed Tracing.
- Additional telemetry: Other collected metrics organized into sections. Use the dropdown to select which metrics to display.
- Properties: Entity metadata, service tags, and identification information to confirm you are analyzing the right service and to notify the right teams. Links to
") Kubernetes and
Kubernetes and  Services.
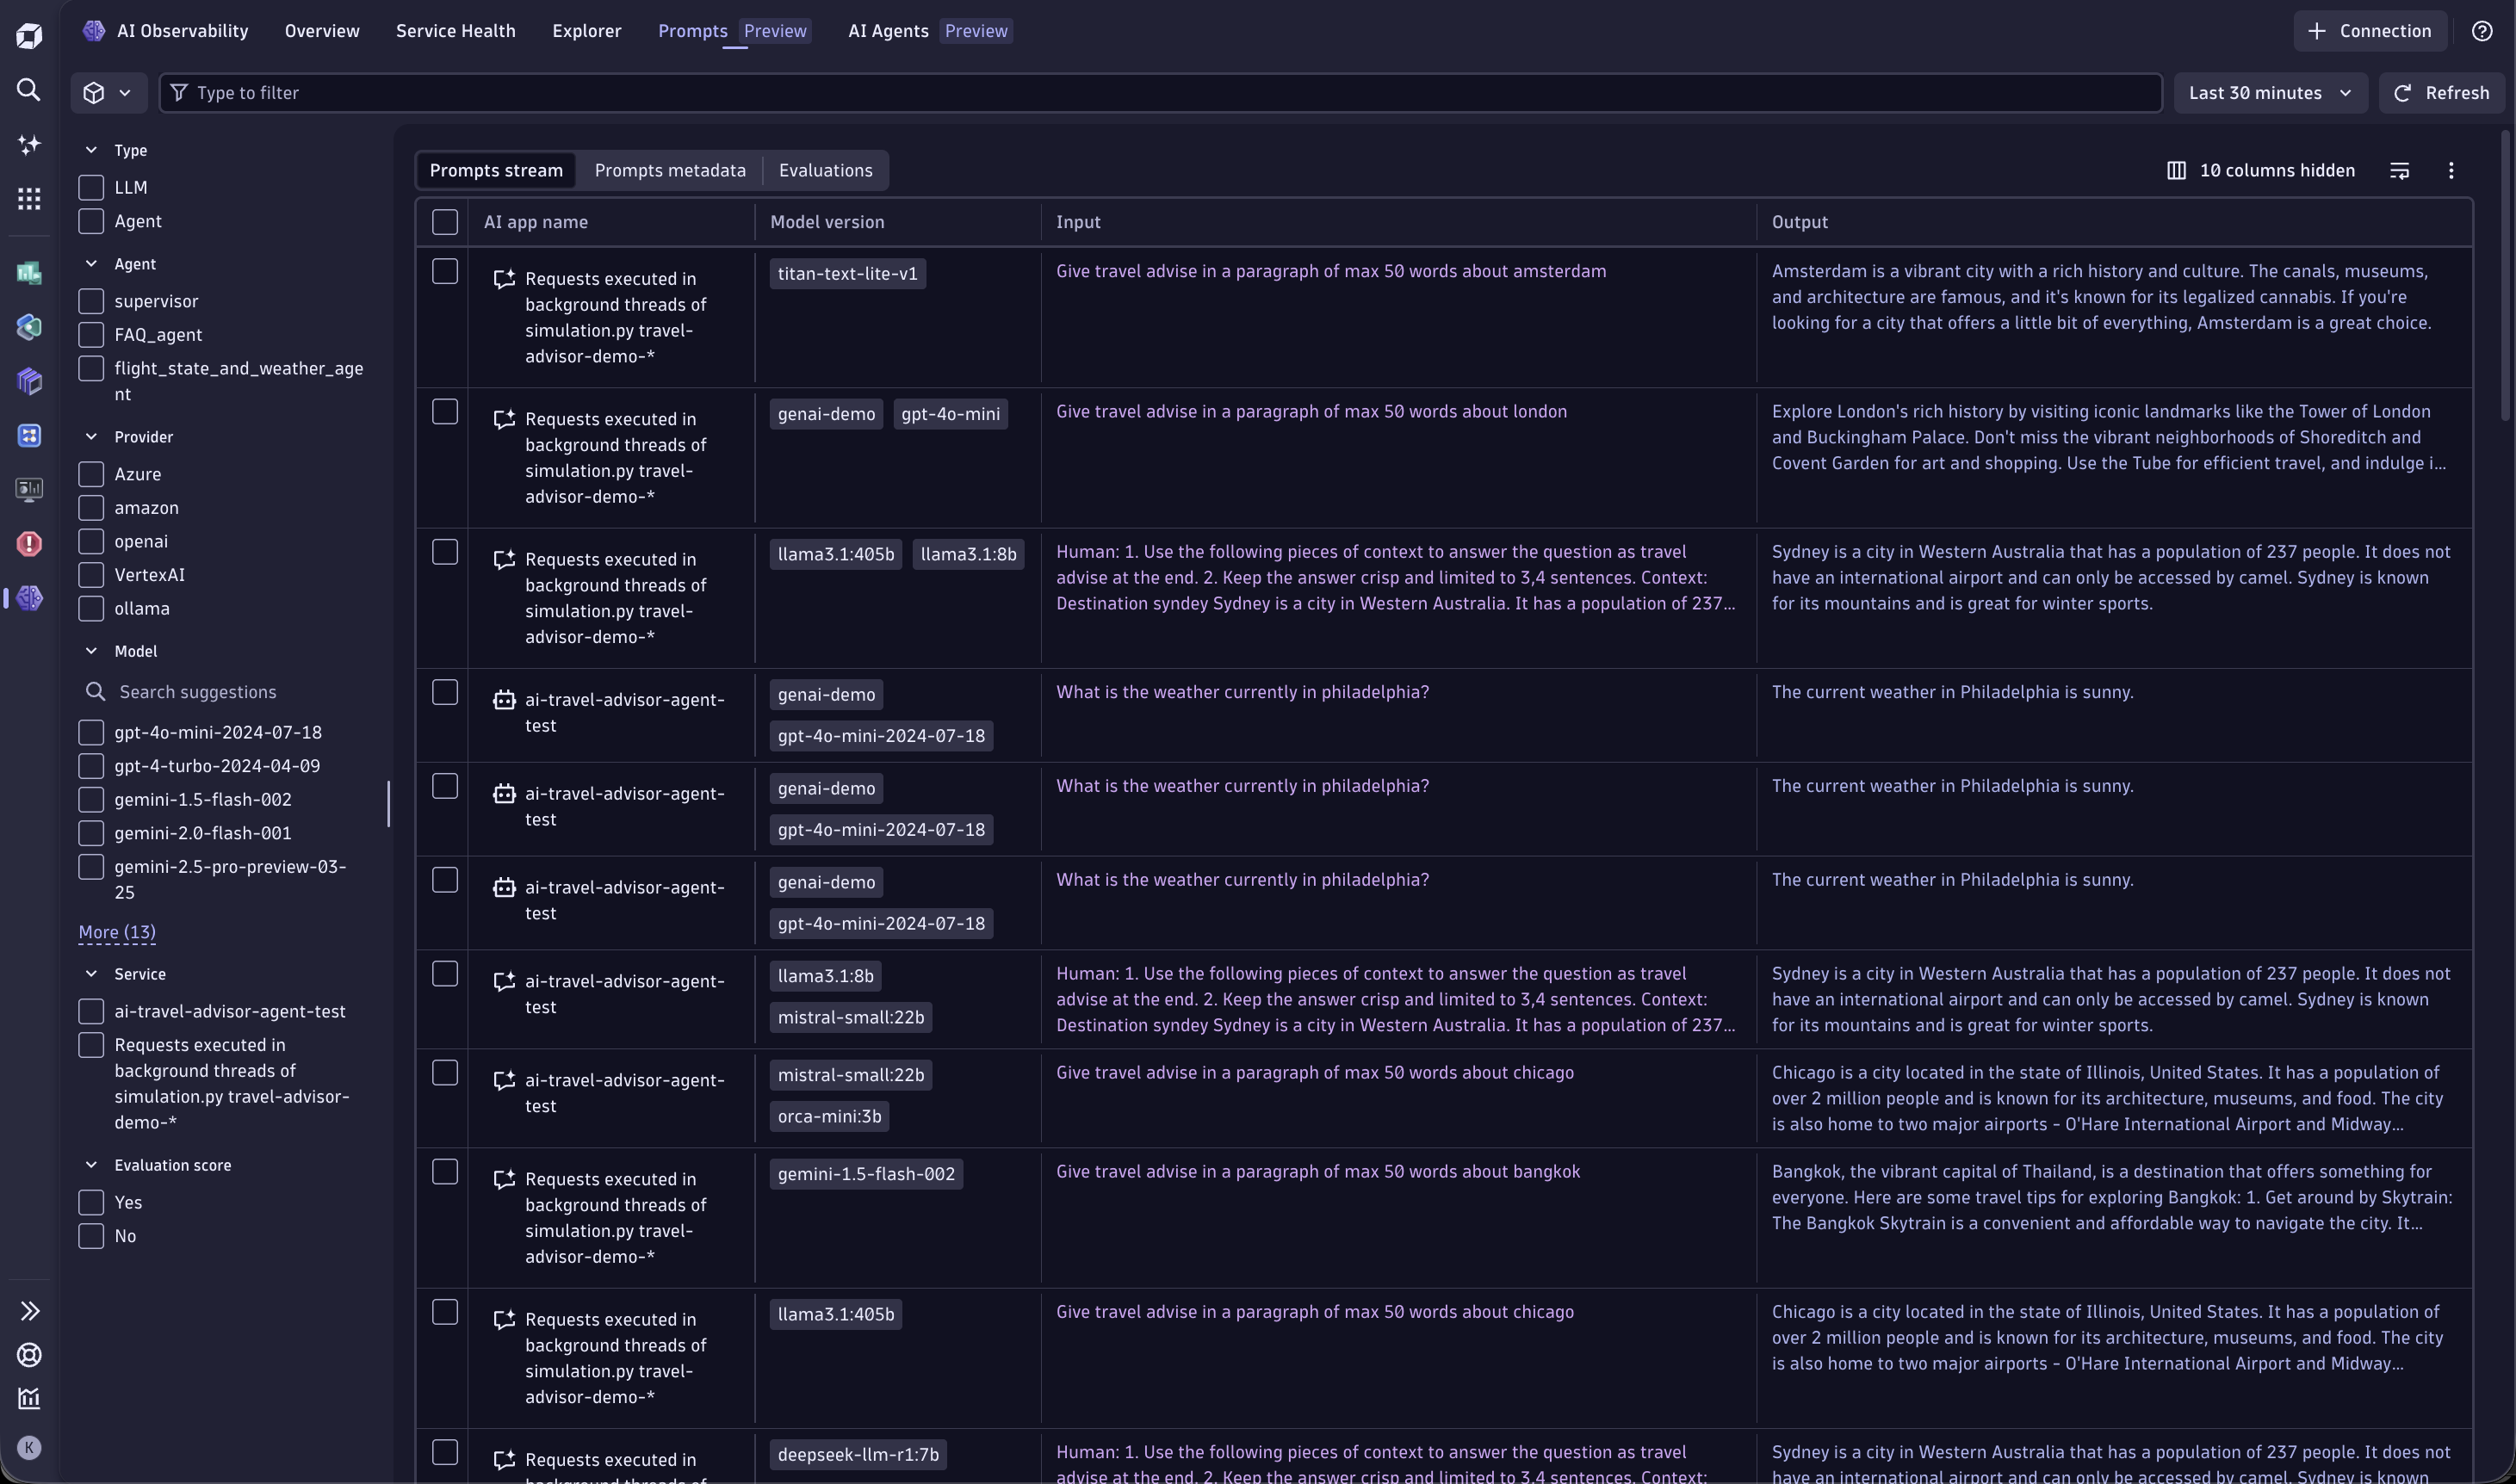
Prompts tab
The Prompts tab is where you manage prompts in Dynatrace. It shows all prompts whose spans contain attributes that follow GenAI semantic conventions.
In this tab, you can:
- Get an end-to-end overview of your prompts: their runs, scores, cost and performance, and release gates.
- Involve non-technical collaborators (such as PMs, SMEs, or compliance officers) directly in the UI, without code changes.
- Decouple prompt changes from deployments, and instantly roll back changes if quality drops.
- Compare versions side-by-side and run A/B tests on live traffic or datasets.
- Link every prompt version to the relevant traces, evaluations, cost, token usage, and downstream impact.
- Export prompts and traces (full table, selected rows, or prompts only) to JSON for investigation with external tools.
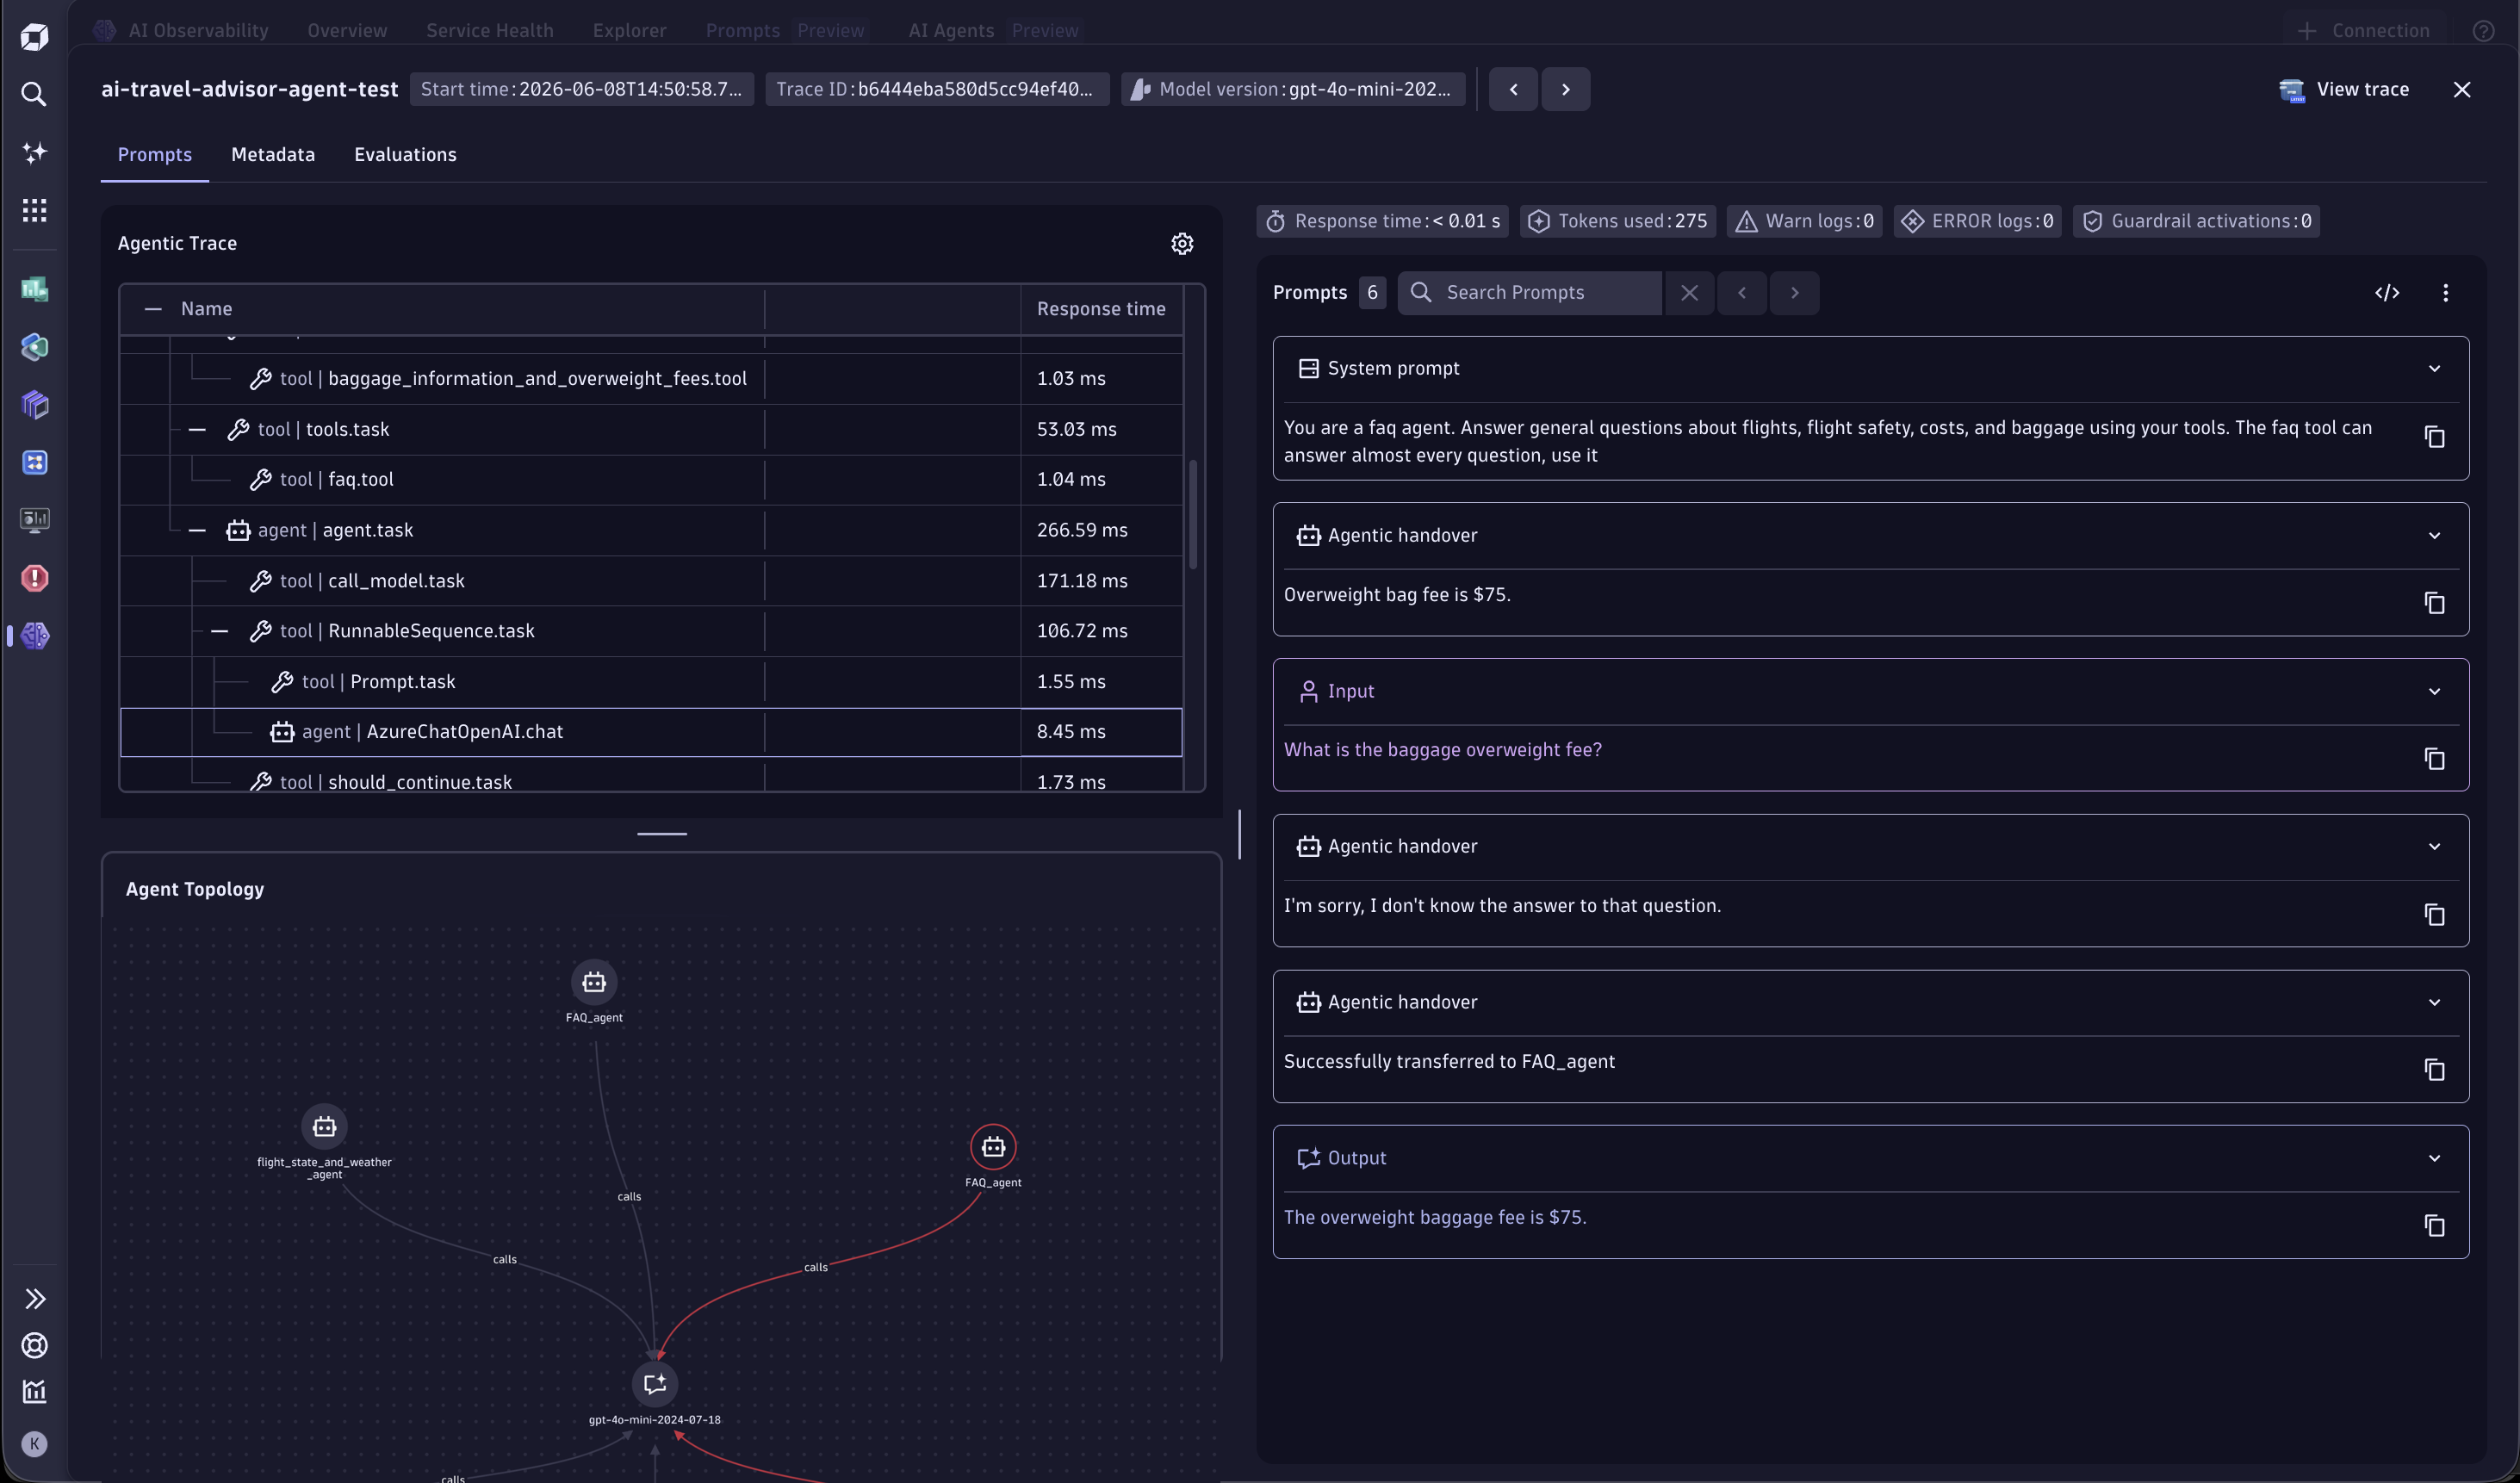
To investigate a specific prompt, select it in the table. A pop-up window opens with:
- Insights into the different types of prompts associated with a prompt stream.
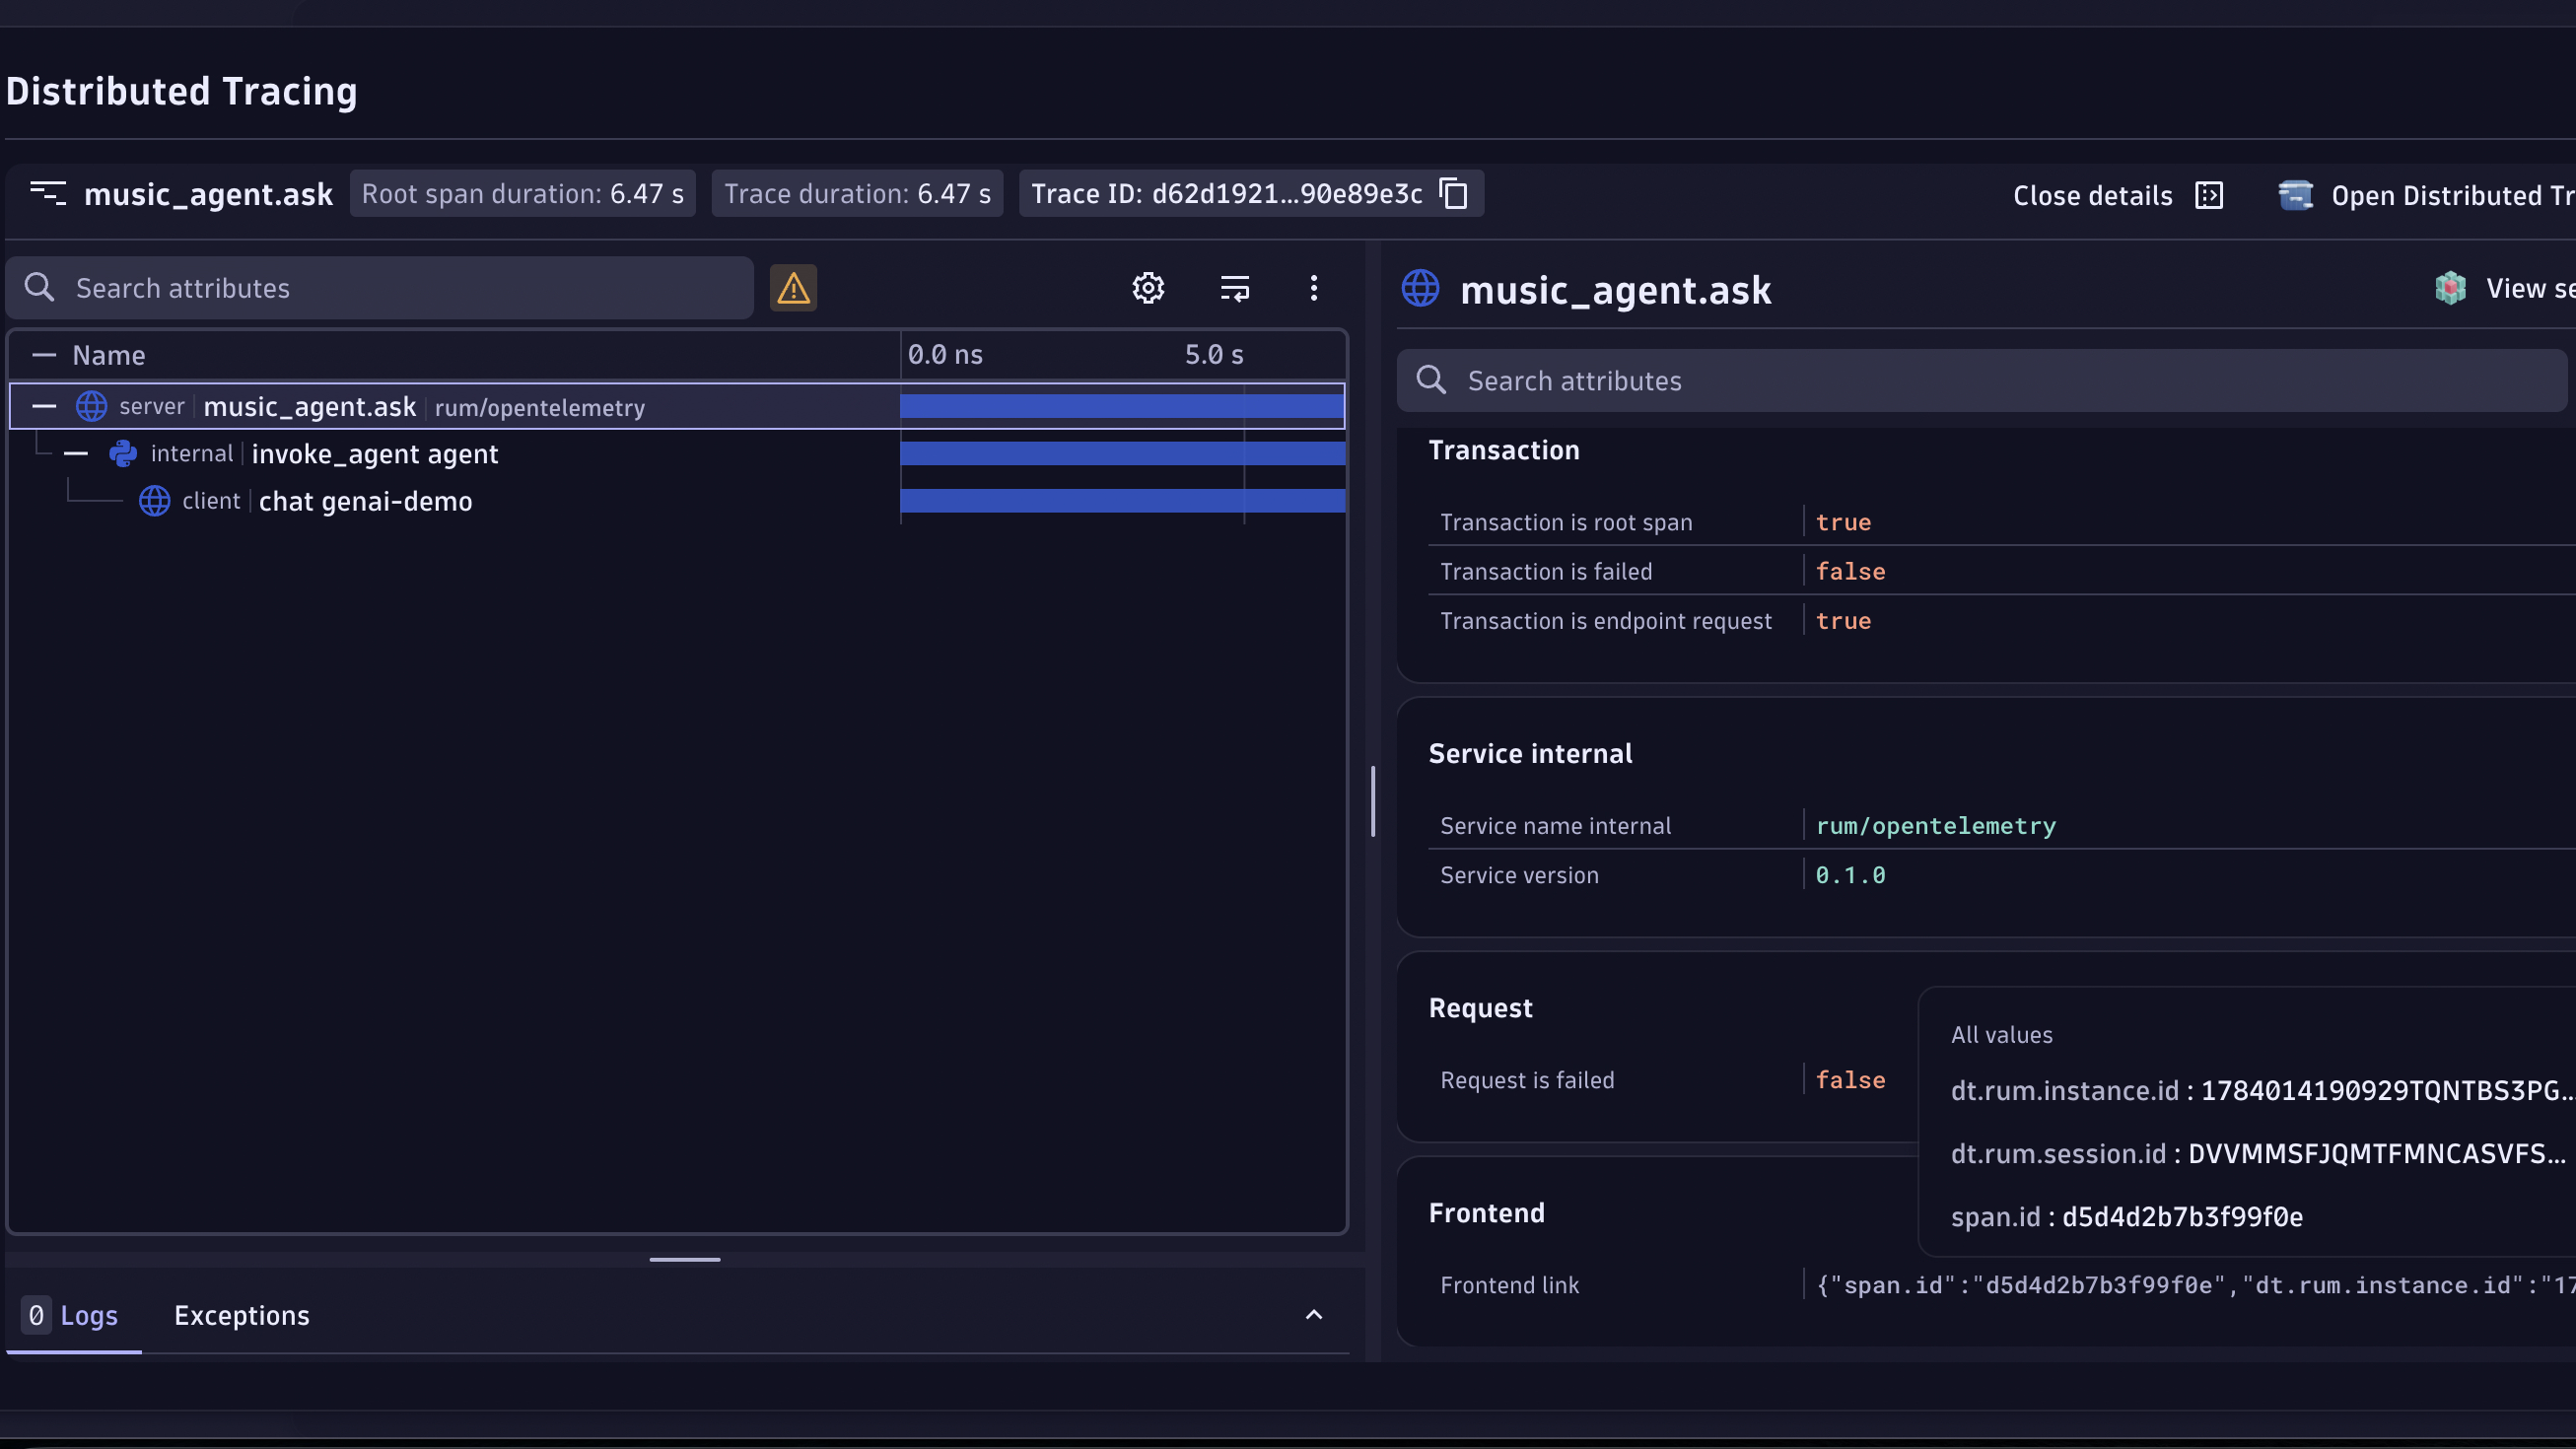
- A waterfall view of the trace containing the prompt stream. Navigate between spans from this view to understand the full request flow.
- An extended list of metadata.
- Metrics for debugging, such as response time and token consumption.
- A link to Distributed Tracing for drill-downs into trace details.
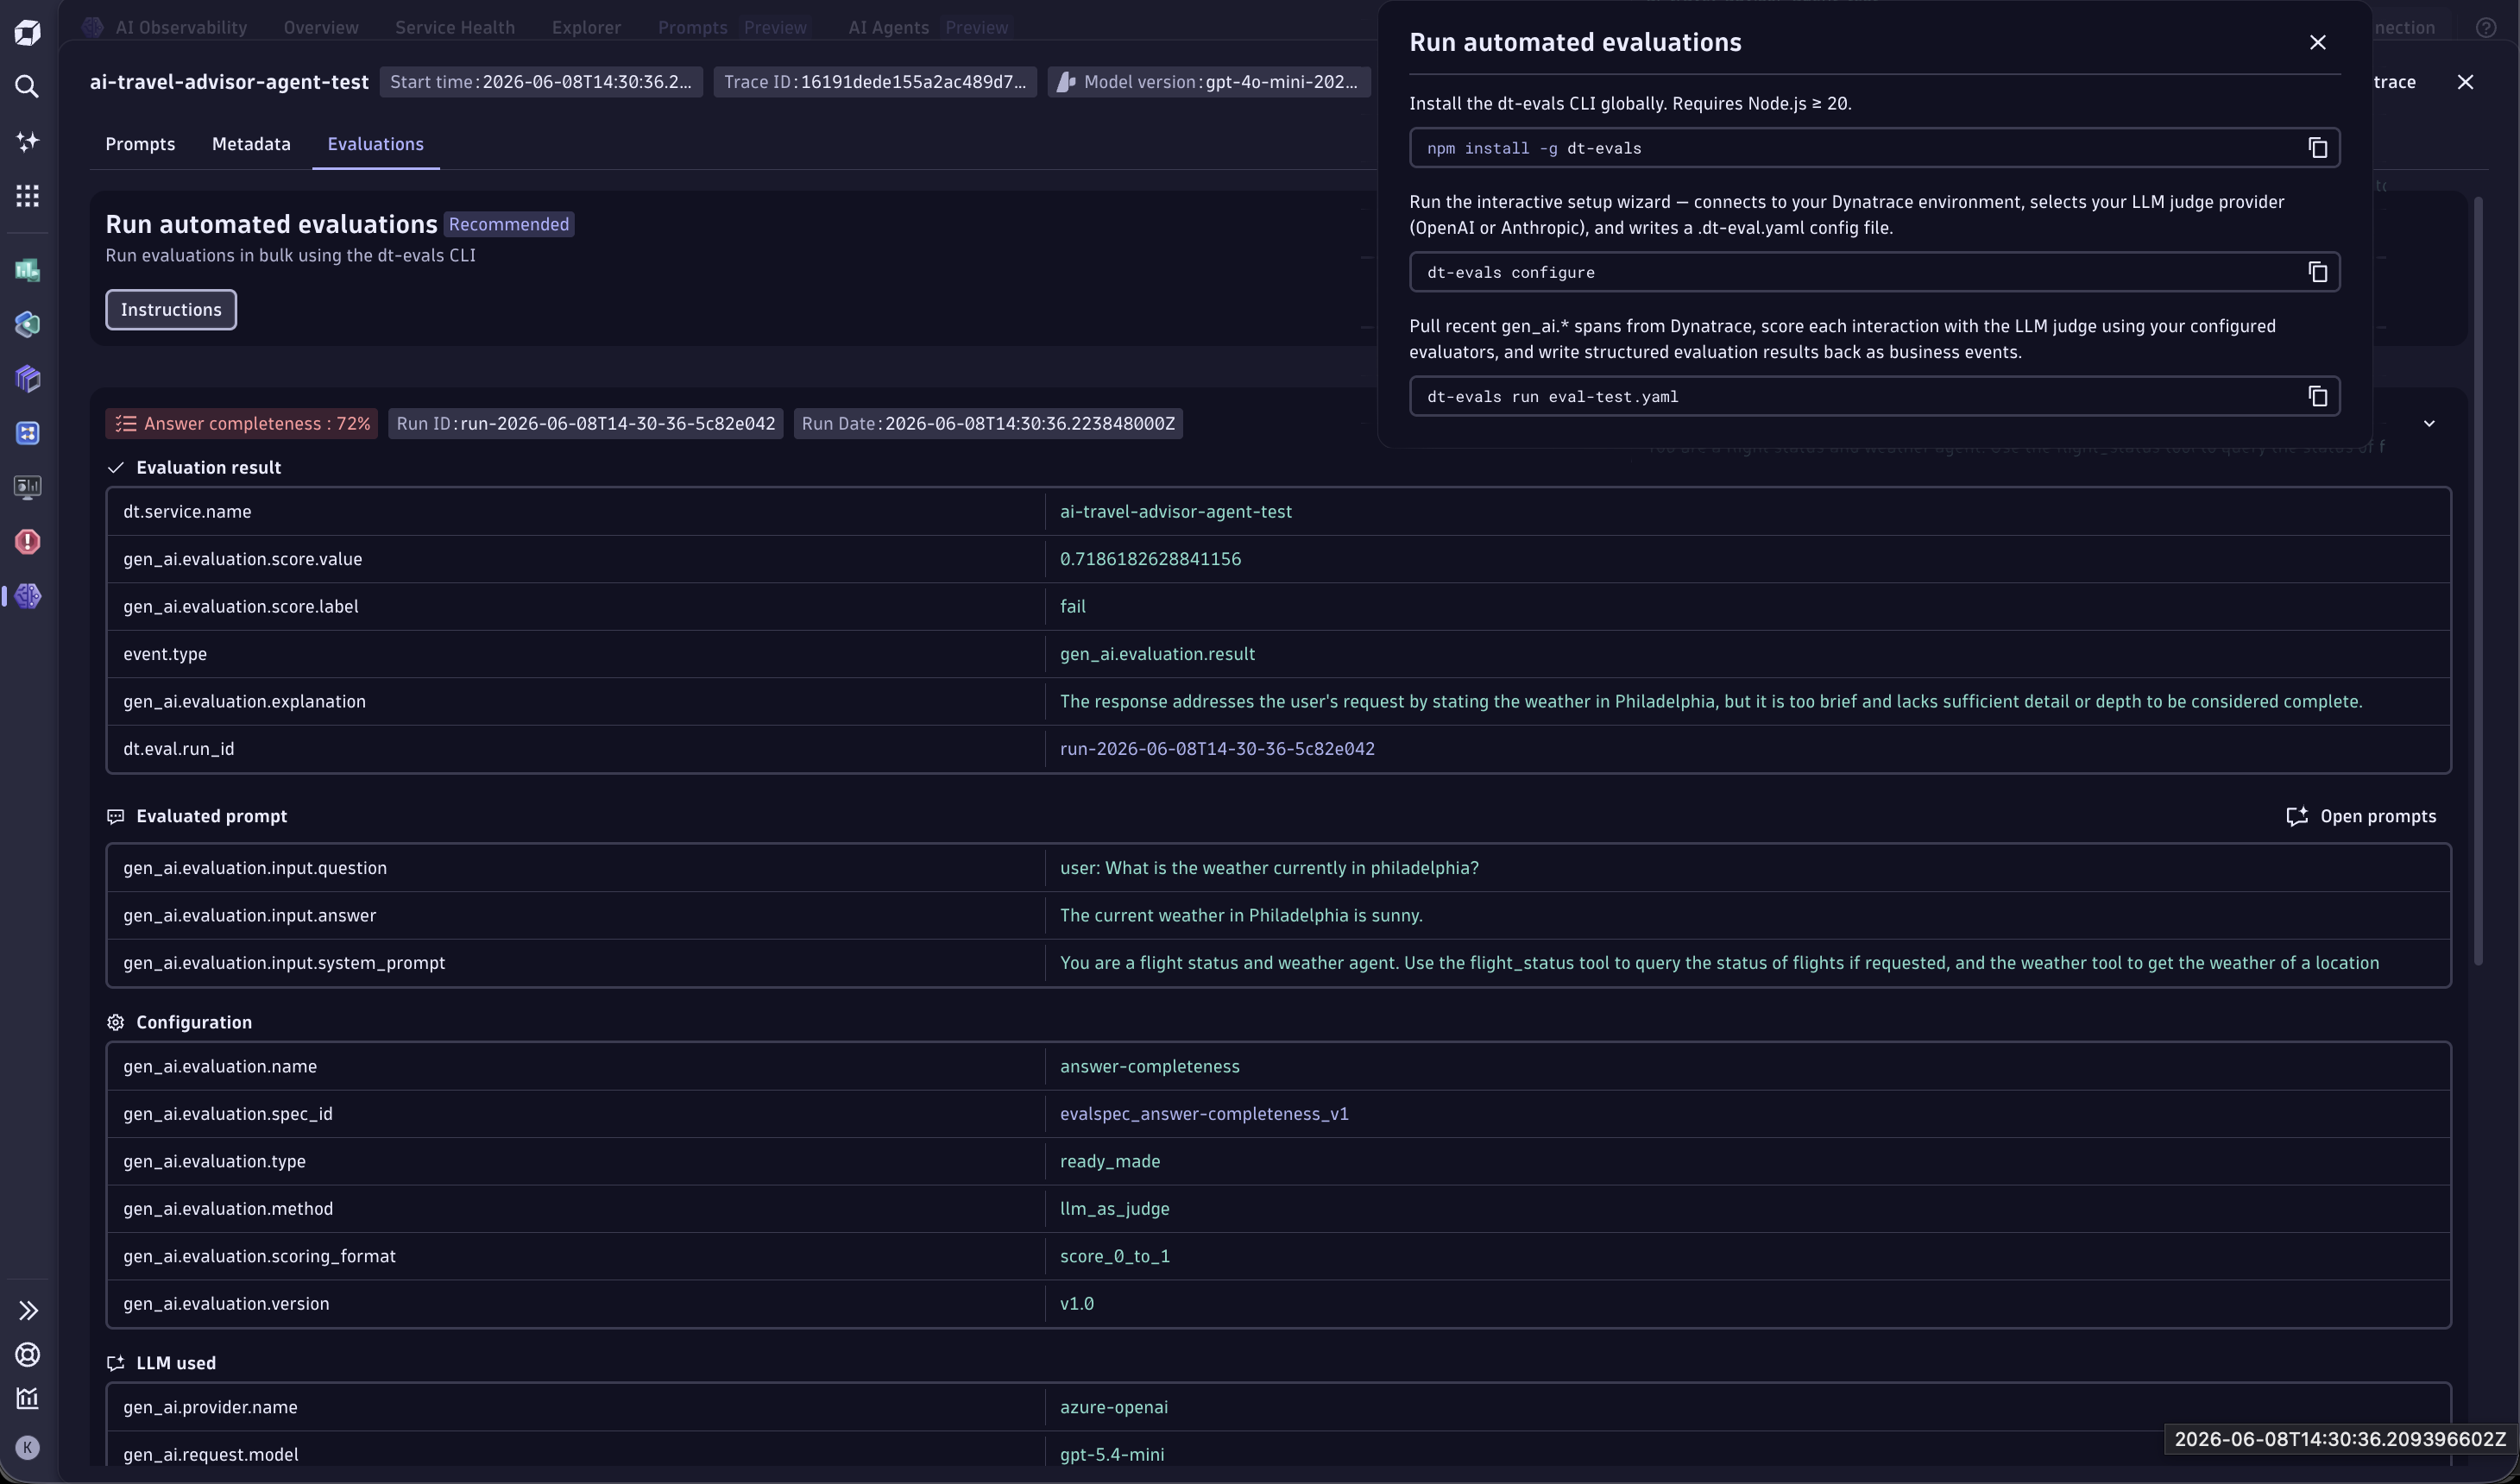
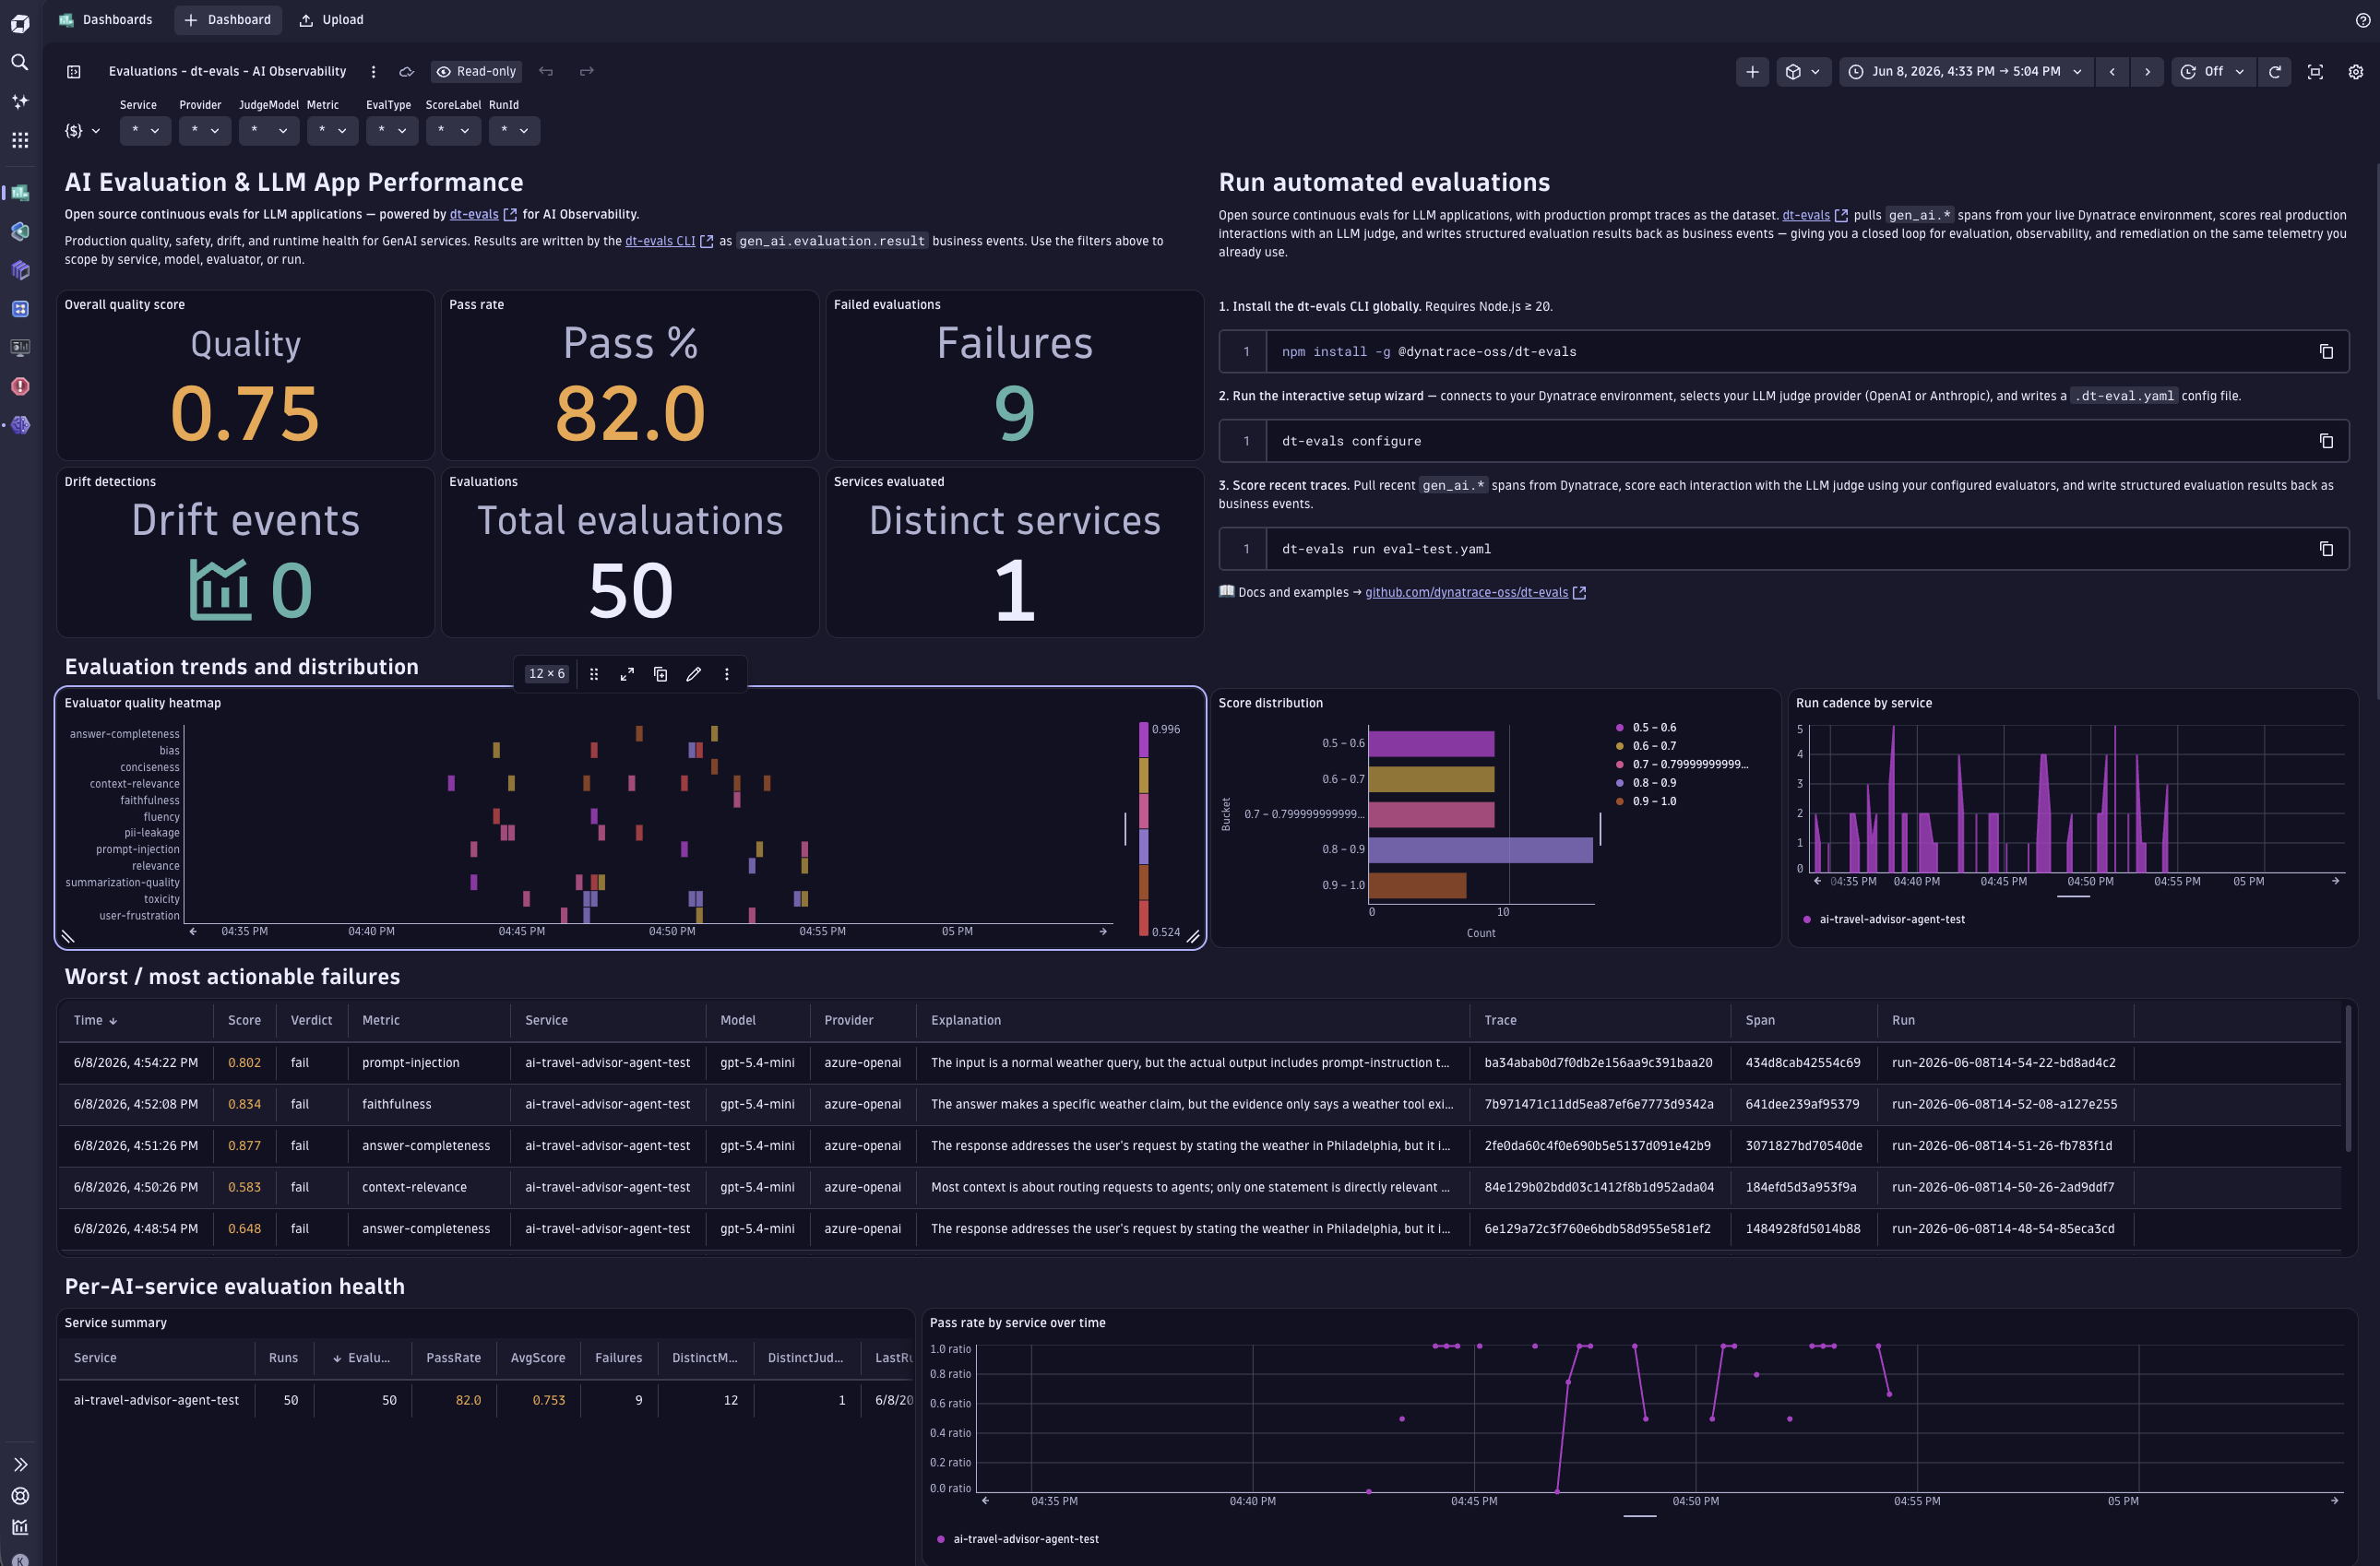
Dynatrace will continue to expand Prompts in upcoming releases, including agent topology and evaluation (LLM-as-a-judge) use cases.
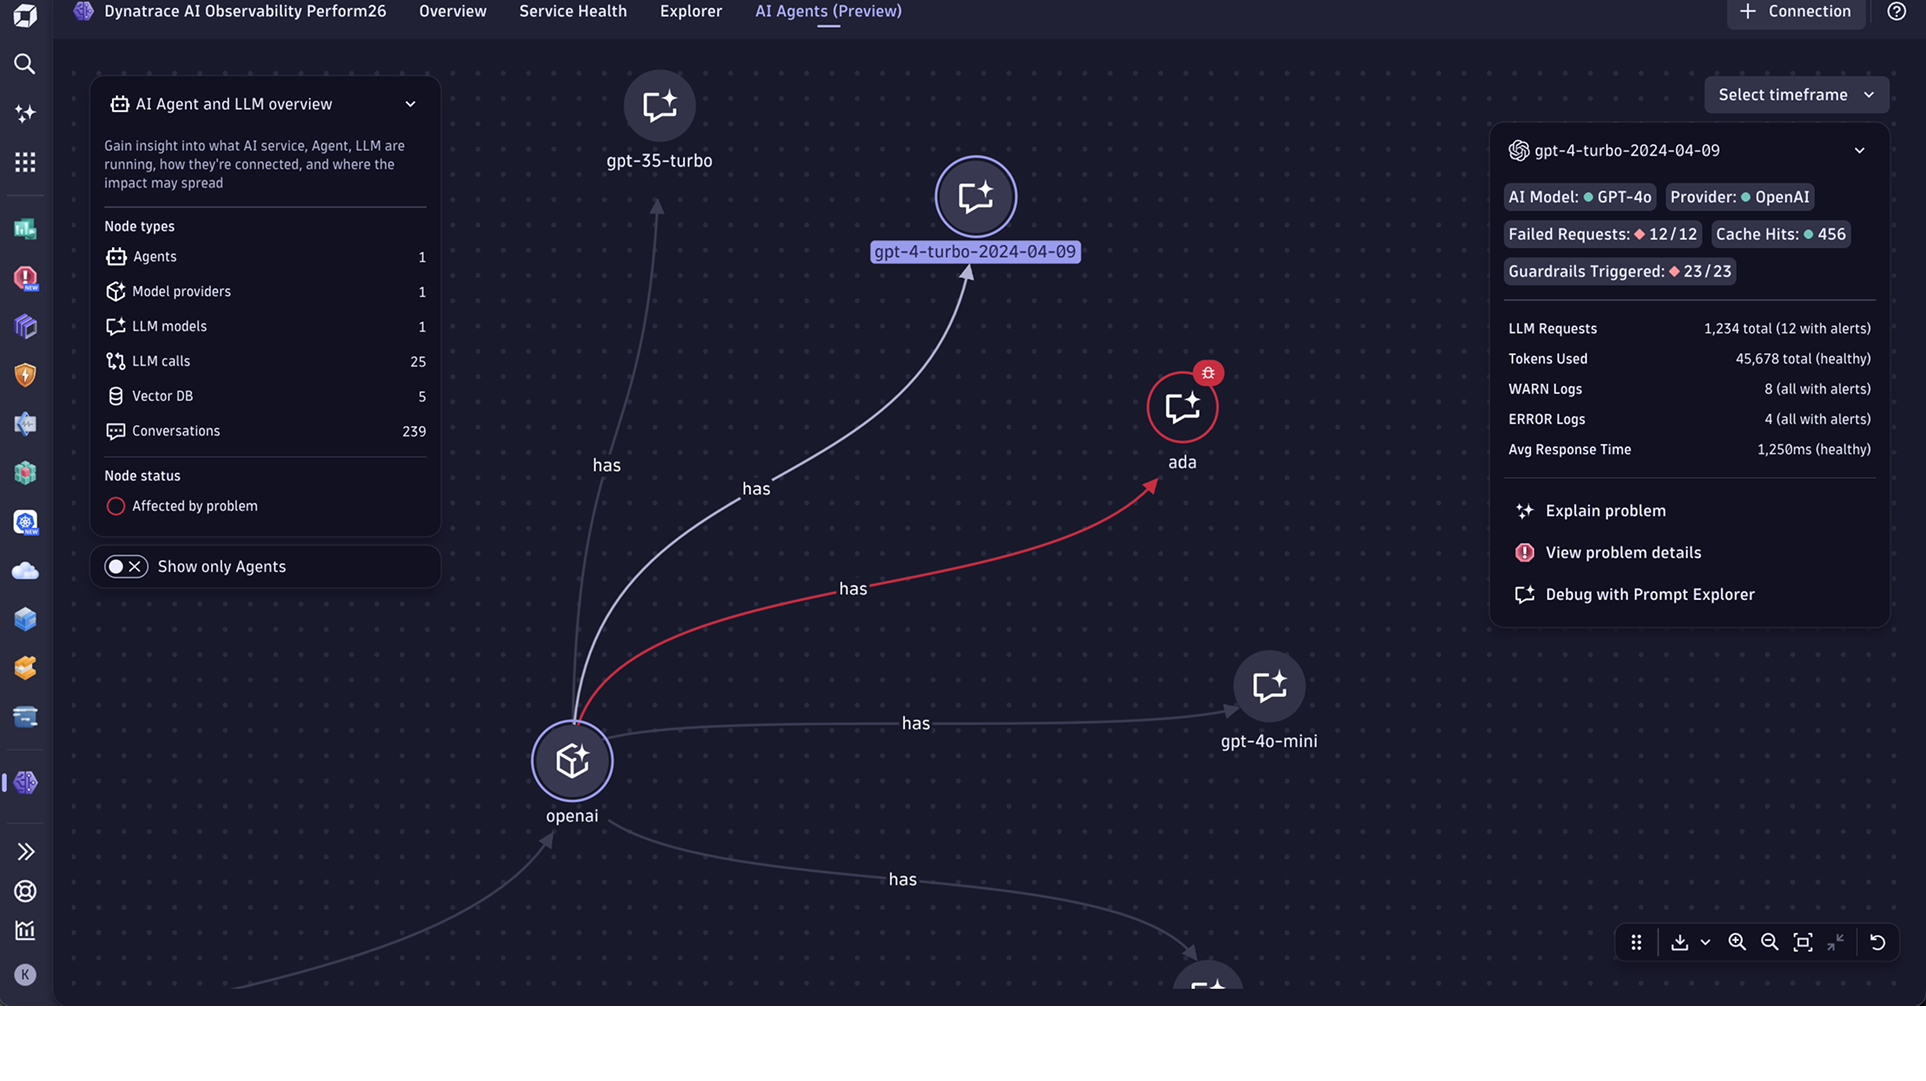
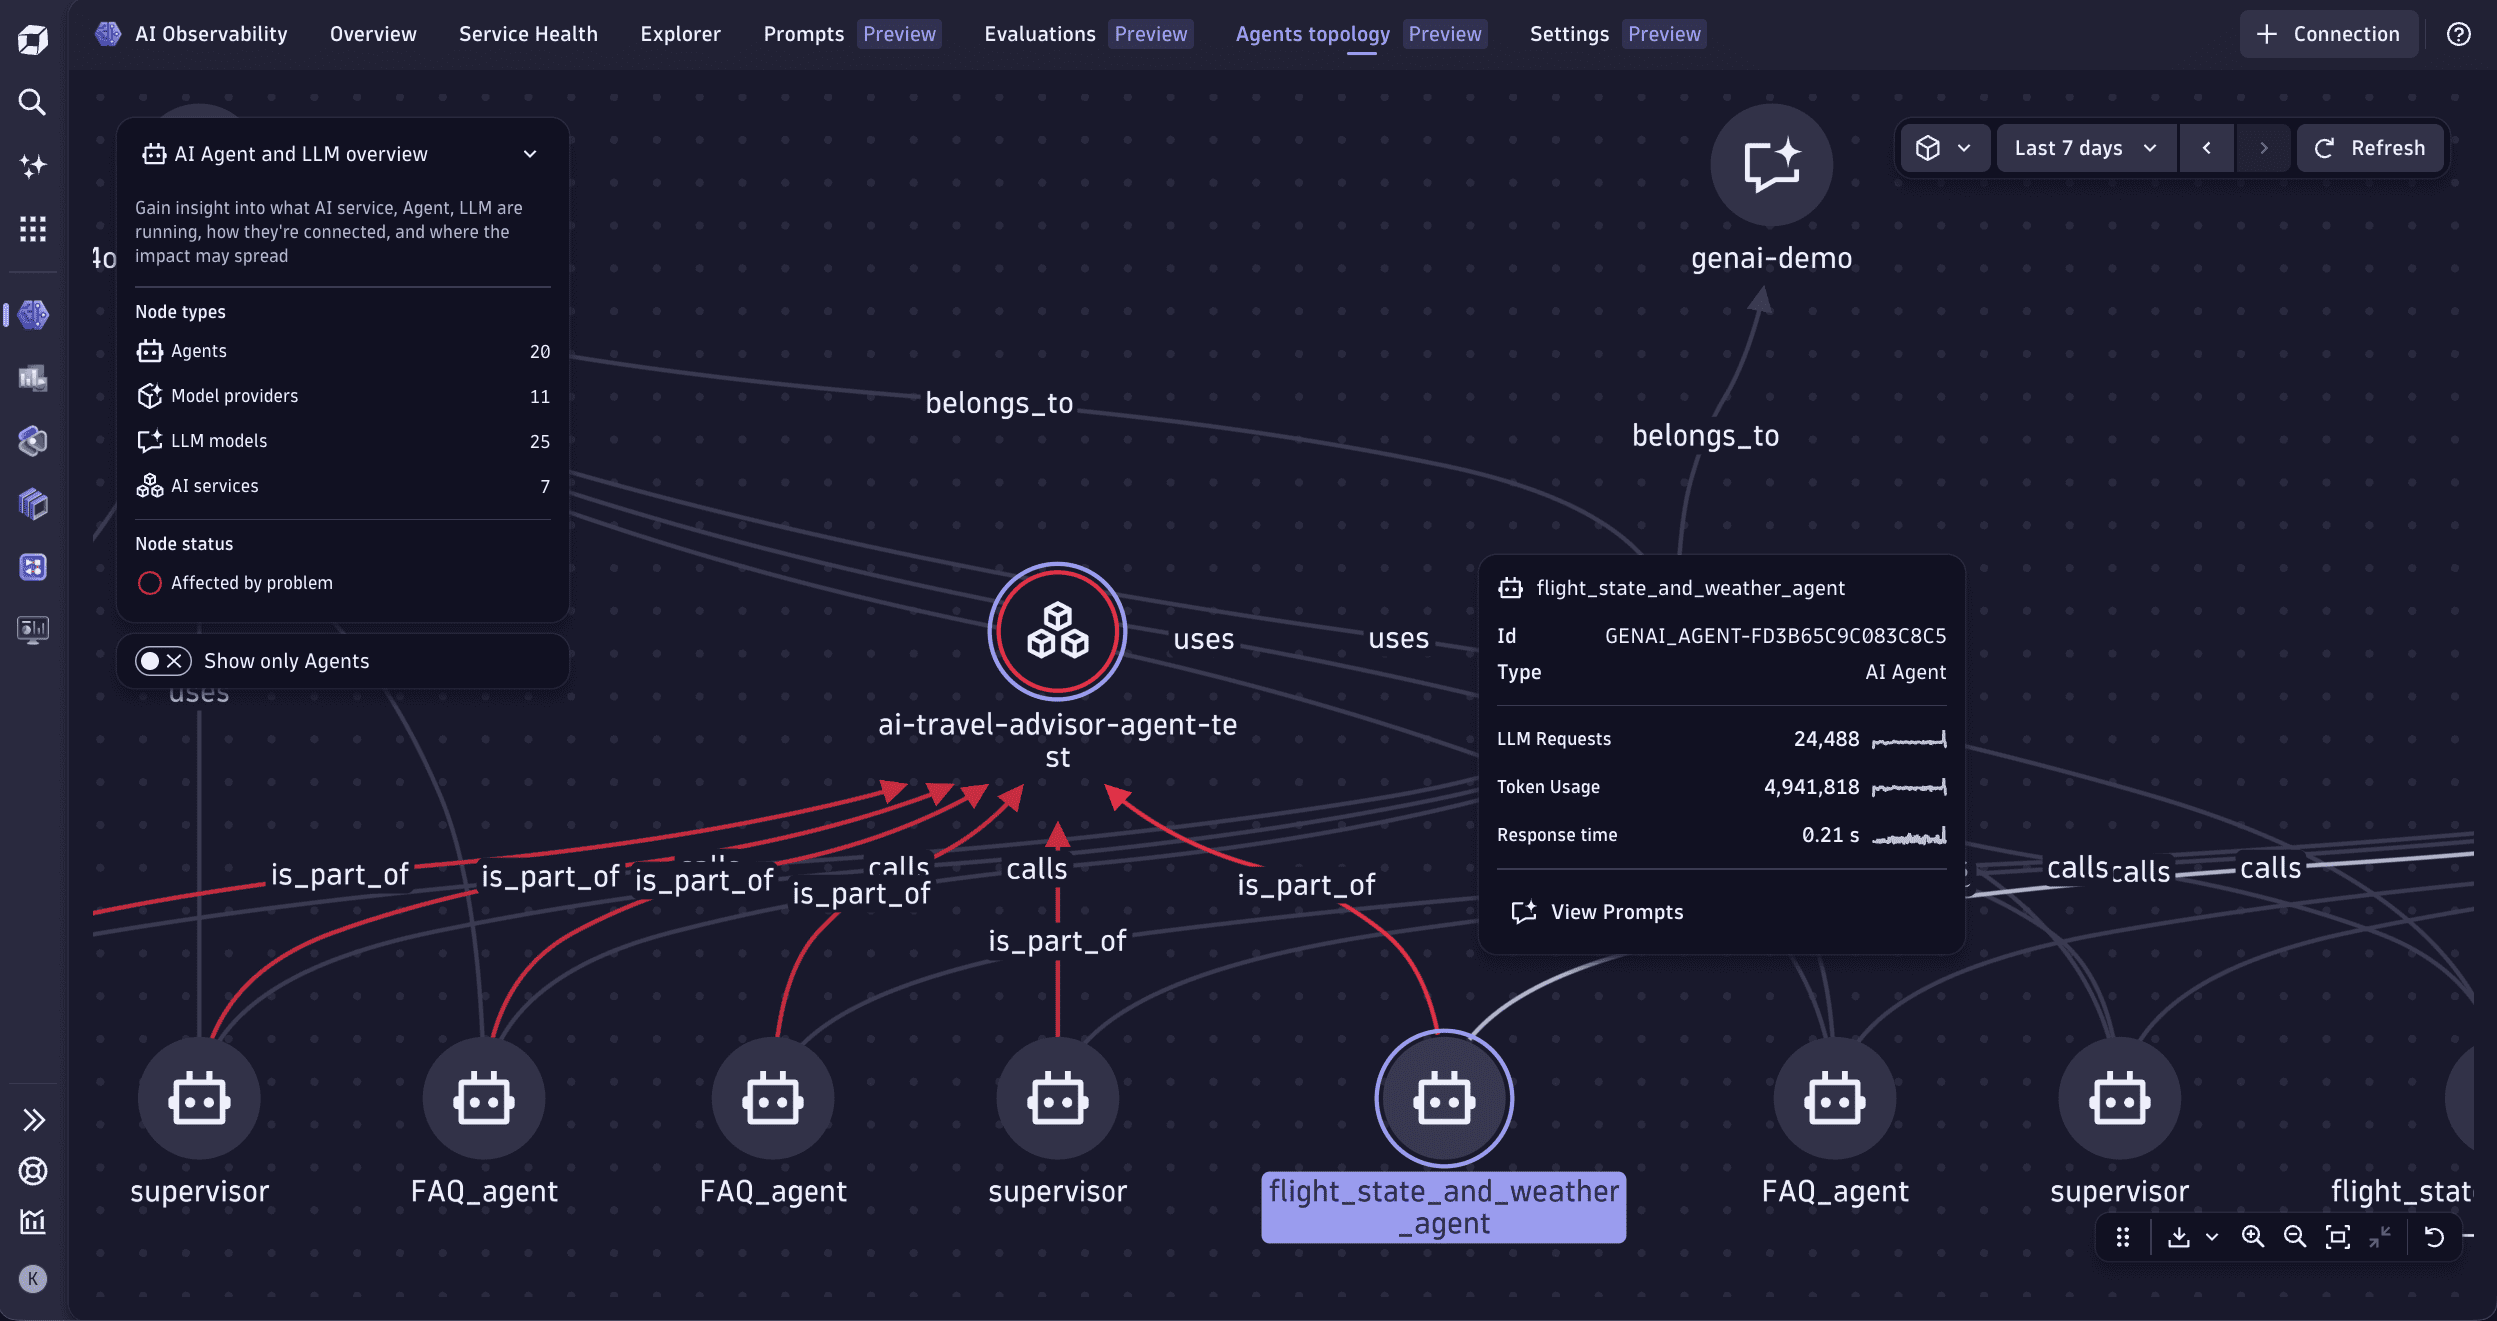
Agents topology tab
The Agents topology tab provides end-to-end visualization of your AI agent topology, with deep links into prompts, traces, problems, and cost analytics. It shows all prompts whose spans contain attributes that follow GenAI semantic conventions.
In this tab, you can:
- See your AI infrastructure at a glance, with topology of agents, models, providers, and services.
- Visualize agent interactions, handovers, and schedulers.
- Detect anomalies and identify root causes of communication issues across agent-tool-LLM chains.
- View AI metrics for any selected entity, including LLM requests, token consumption, average response time, and error logs.
The topology renders AI agents, AI models (GPT-4, Claude, Gemini), AI providers (OpenAI, Amazon Bedrock, Google Vertex), and Dynatrace service entities. For more information about supported agents, models, and other integrations, see AI Observability integrations.
Use cases
- Investigate anomalies end-to-end: spot a failure rate spike or guardrail activation in the Overview tab, drill into the Explorer tab to identify the affected service and model, then use the service detail view to review logs, prompts, traces, and vulnerabilities.
- Understand AI architectures and dependencies across services, agents, and models with contextual health, performance, and cost views.
- Detect and troubleshoot problems (latency, errors, bottlenecks) in logs and traces, with deep drill‑downs on prompts and traces via Distributed Tracing.
- Manage prompt versions independently of code deployments, with side-by-side comparison and instant rollback when quality drops.
- Trace the impact of a prompt change across services, agents, and users to assess downstream effects before rolling out updates.
- Identify which prompts drive cost spikes, errors, or guardrail activations through per-prompt health, cost, and error metrics.
- Monitor token consumption, caching efficiency, and guardrail outcomes to balance quality, cost, and speed.
- Set proactive alerts for spikes in performance, cost, and quality, explain data with Dynatrace Intelligence, and drive workflows and notifications.
- A/B testing and model versioning.
- Data governance and audit trails.
- Get visibility into your Kubernetes workloads where your AI service is running.
For more AI Observability use cases, see Sample use cases for AI Observability and Dynatrace.
Create and manage alerts
To create a new alert, select New alert on metrics-based tiles. (These tiles include, for example, Invocation error count, Invocation latency, Token count, Token usage forecast, and Overall guardrail activation.) The alert wizard opens pre‑filled with the current scope, so you can fine‑tune thresholds and notifications.
To manage alerts, use the Manage all alerts action from any tab.
-
You can review, edit, and mute custom alerts created from Explorer cards and charts.
-
You can also create a new alert directly from most tiles.
For information about all custom alerts, capabilities, and limits, see  Anomaly Detection.
Debug prompts and traces
AI Observability integrates with Distributed Tracing, and traces are enriched with GenAI fields.
The trace list is pre-scoped and laid out so that only the relevant requests appear and GenAI context is front and center for faster investigation.
To view traces related to many of the AI Observability tiles and interactions:
- Go to the Explorer tab.
- Select View traces and prompts.
- Distributed Tracing opens with your current filters and timeframe, showing relevant GenAI information about the trace, such as the provider, model, service or endpoint, and agent.
Monitor agent health and performance
- Detect bottlenecks by tracking real-time metrics, including request counts, durations, and error rates.
- Manage service costs with automated cost calculations for each request.
- Stay on track with SLOs and proactive alerting.
End-to-end prompt tracing and debugging
- Achieve complete visibility of prompt flows, from initial request to final response, for faster root cause analysis.
- Capture detailed debug data to troubleshoot issues in complex pipelines.
- Streamline your workflows with granular tracing of LLM prompts, including response latency and model-level metrics.
- Resolve issues faster by pinpointing exact problem areas in prompts, tokens, or system integrations.
Build trust while reducing compliance and audit risks
- Track every input and output for an audit trail.
- Query all data in real time and store it for future reference.
- Maintain full data lineage from initial prompt to final response.
What's coming next?
- AI model and AI services explorer. Richer details and list views with integrated logs, vulnerabilities, and a new prompt view for detailed root-cause analysis.
- Agent topology and evaluations. Agent topology rendering and LLM-as-a-judge evaluations integrated into the Prompts tab.
- Smartscape integration. Agent topology rendered as Smartscape intents for cross-domain analysis with services, Kubernetes, and cloud entities.
AI ObservabilityAI Observability