What's new in Dynatrace SaaS 1.340
- Release notes
- 10-min read
- Rollout start on Jun 02, 2026
This page showcases new features, changes, and bug fixes in Dynatrace SaaS version 1.340. It contains:
Cost Intelligence
Proactive Cost Intelligence across your entire stack
Use Dynatrace Cost Intelligence to understand your costs, act before they spike, and optimize with ease.
FinOps best practices
Managing and optimizing Dynatrace costs just got clearer. We've published new Optimize documentation that guides DPS customers through the full journey from understanding to optimizing costs, aligned with the FinOps Foundation framework.
Cost Intelligence for deep analytics and optimization
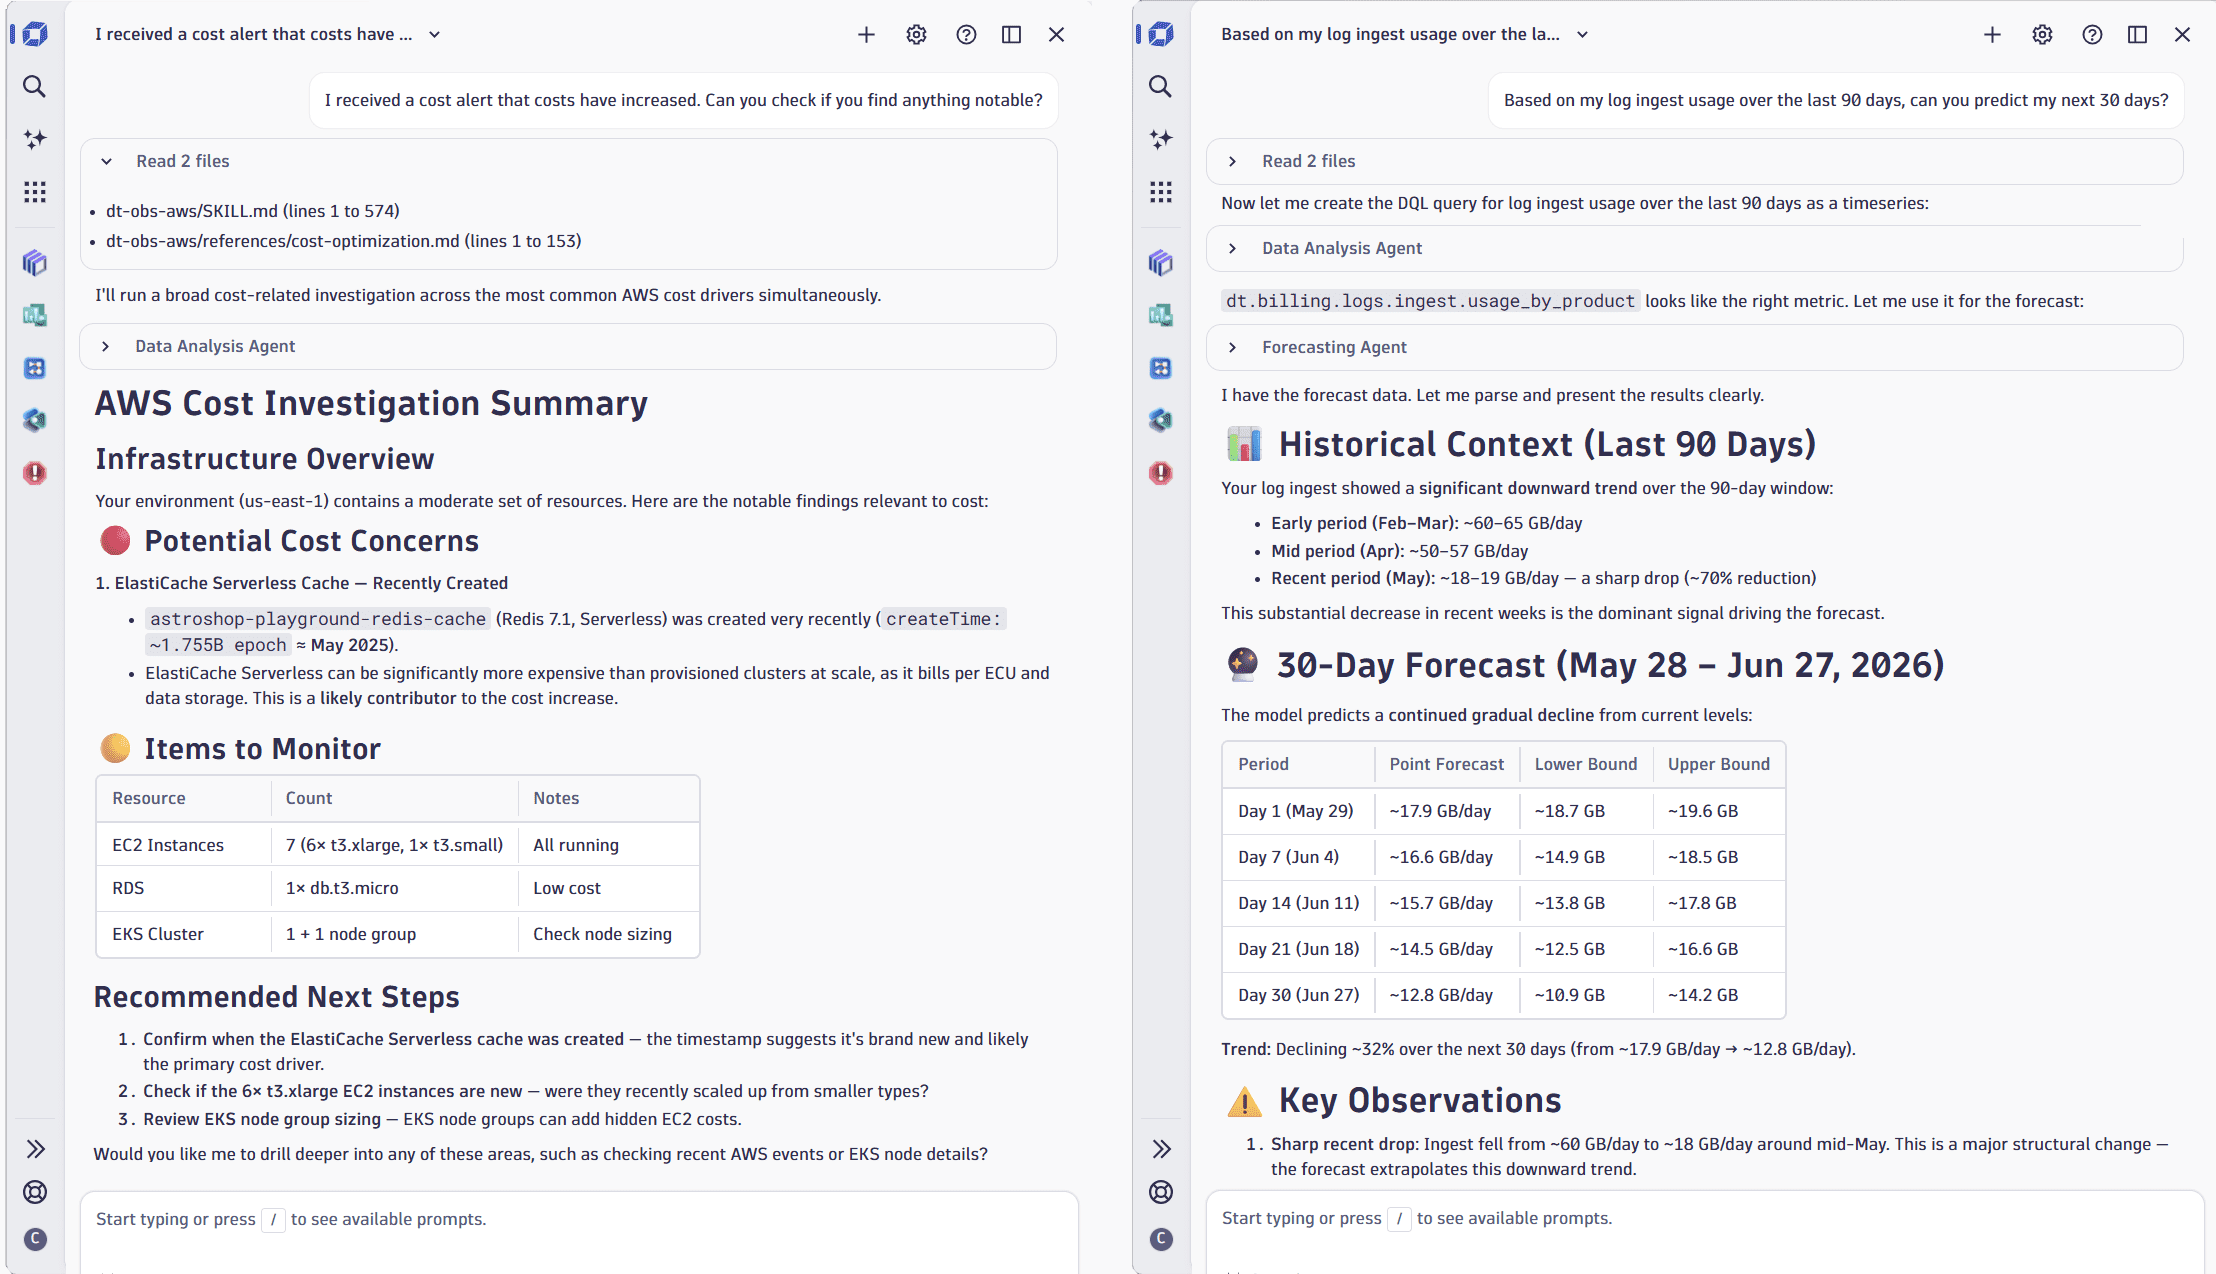
Use Dynatrace Assist to understand, predict, and optimize usage, no further expertise required. You can:
-
Understand cost spikes.
Try: "I received a cost alert that costs have increased. Can you check if you find anything notable?"
What you'll get: A full drilldown into your
billing_usageevents with the root cause surfaced directly—no manual exploration needed. -
Predict costs.
Try: "Based on my log ingest usage over the last 90 days, can you predict my next 30 days?"
What you'll get: A capability-level prediction based on your actual consumption, useful when onboarding new teams.
-
Optimize costs.
Try: "Looking at optimizing my log query usage—are there any queries duplicated by multiple users?"
What you'll get: Insights into overlapping queries with direct suggestions on how to improve.
Feature updates
Account Management | Cost Management
Maintenance of DDU consumption metering
Technical foundations for DDU consumption metering for classic licenses regarding Logs on Grail and Bizevents on Grail are reworked for maintenance reasons. The consumption logic itself does not change.
During the hour when this transition takes place, you may see a DDU consumption gap within a single billing hour affecting the following metrics:
builtin:billing.ddu.log.totalbuiltin:billing.ddu.log.byDescriptionbuiltin:billing.log.ingest.usagebuiltin:billing.ddu.events.totalbuiltin:billing.ddu.events.byDescriptionbuiltin:billing.events.business_events.ingest.usage
Account Management | Identity Access Management
OAuth support for authorization code flow
With this release, Account Admins will be able to generate OAuth clients using the Authorization code grant type, which allows authorized applications to act on behalf of the user.
This feature further enhances integration options to Dynatrace.
For further documentation, see https://docs.dynatrace.com/docs/manage/identity-access-management/access-tokens-and-oauth-clients/oauth-clients.
Account Management | Subscriptions and Licensing
Single POD email for combined Amend & Extend subscription orders
You can now select the Amend and Extend POD template, so you can receive a single POD email containing both amended subscription changes and new renewal subscription terms.
AI Observability | AI Observability
Added Python support for GenAI services and frameworks
OneAgent version 1.339+ Dynatrace version 1.340+
OneAgent now provides automatic instrumentation for Python applications that use AWS Bedrock, OpenAI, Azure OpenAI, and LangChain.
- Dynatrace captures distributed traces, logs, and GenAI-related telemetry for supported model interactions, including provider, operation, model, duration, token usage, and prompt and completion metadata where available.
- You can capture prompt and completion content to debug AI and LLM interactions, analyze model behavior, and understand the performance and cost impact of calls to large language models. To enable it, go to OneAgent features and turn on Python OpenAI prompt capture [Opt-In].
Application Observability | Distributed Tracing
Investigate traces faster with clarity and navigation improvements in Distributed Tracing
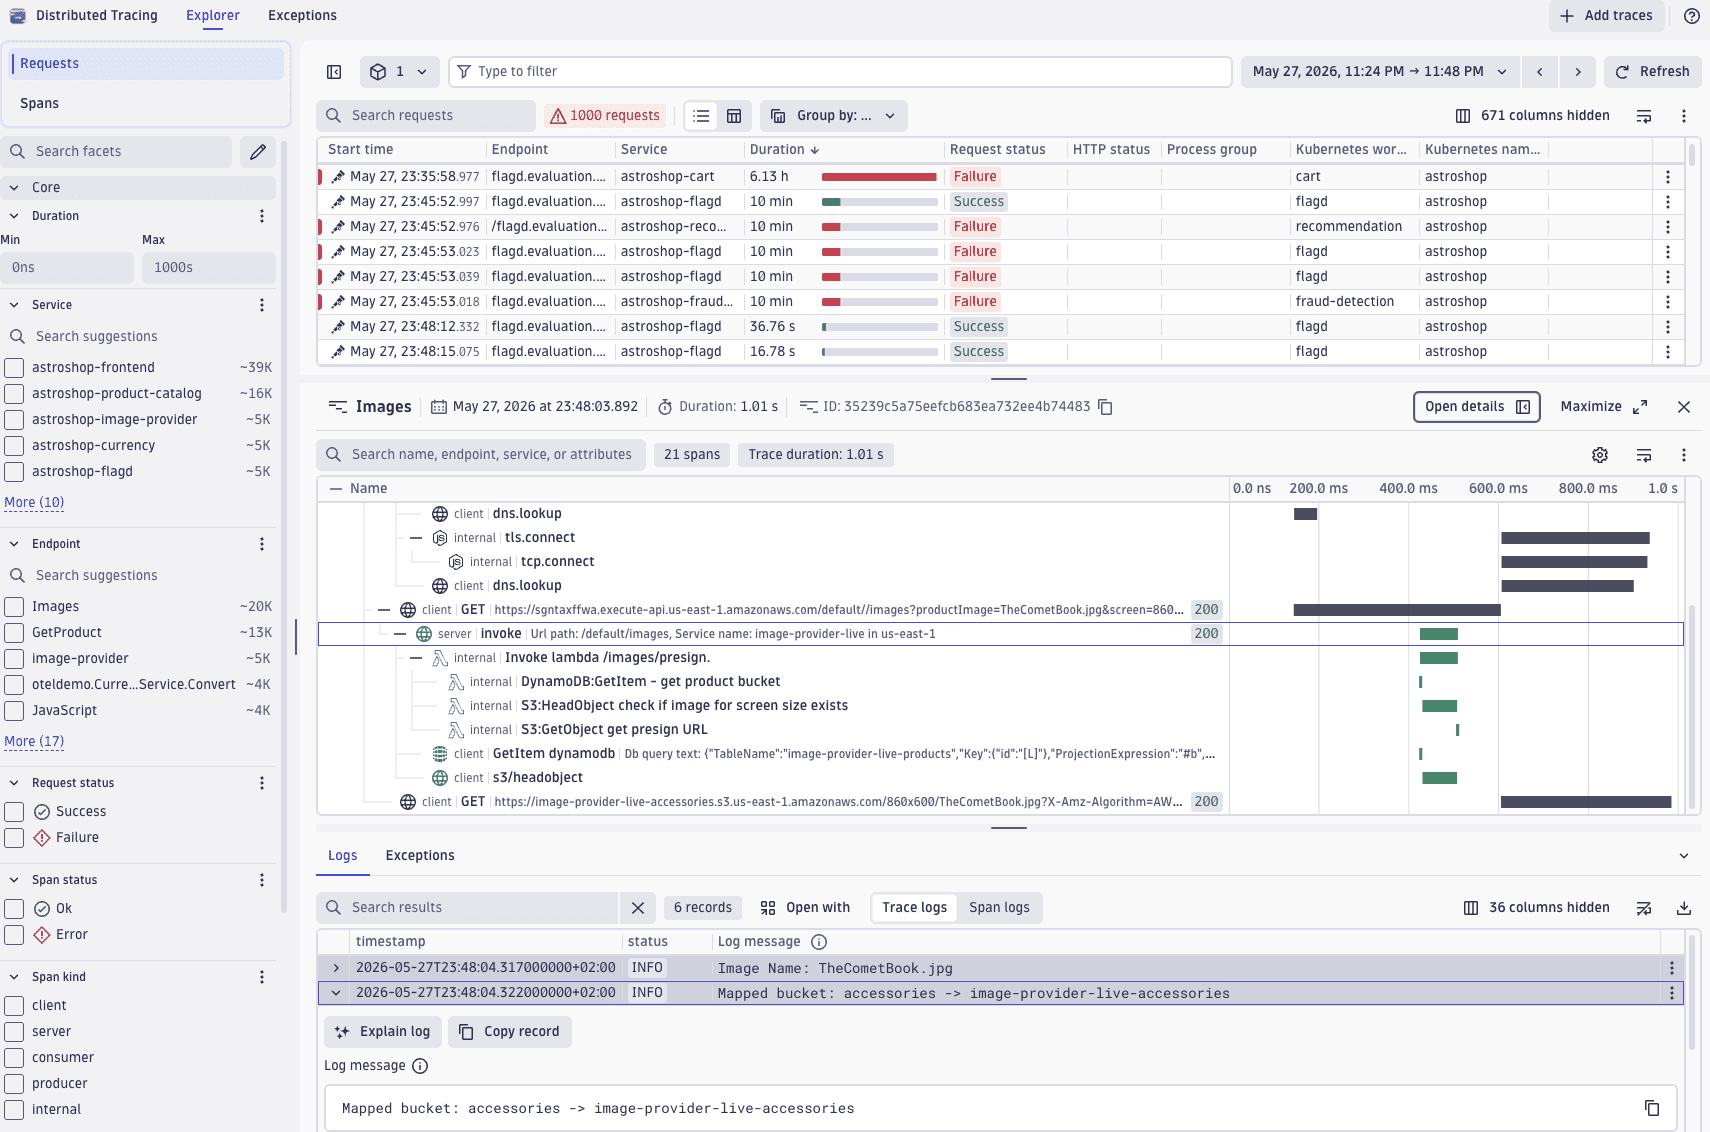
Several enhancements make it easier to analyze and navigate trace data in  Distributed Tracing.
- Facet counts are now visible directly in the facets panel, so you can quickly grasp the distribution across different values without expanding individual filters.
- A meter bar visualization in the duration column of the span list table lets you compare span durations at a glance.
- You can now start Dynatrace Assist conversations directly from the trace Logs viewer.
- New keyboard shortcuts speed up navigation: select S to jump to the search bar, select F to jump to the filter field.
Application Observability | Log Analytics
Log module self-monitoring enabled by default for Grail
The Dynatrace log module now emits self-monitoring events that deliver an environment-wide health overview for OneAgent and Kubernetes log modules. You can detect and resolve log ingest issues across distributed fleets faster, with self-service troubleshooting based on per-source status and health signals.
What's new:
- Self-monitoring events for log module health and log source status, stored in Grail
dt.system.events. Two event categories emitted: log source status and health‑related events. - Troubleshooting guides covering each event type, with remediation steps and query examples.
- Dashboard visualizing fleet health and detected log source status—available as a downloadable package from documentation or via the upgraded built-in Log ingest overview dashboard.
- Suppression mechanism to disable specific event types per configuration scope.
Where to find it:
- Events in Grail
dt.system.events - Dashboard package
- Troubleshooting guides in our documentation.
Enabled by default for Grail; available as opt-in for Log Monitoring Classic (LMv2).
Application Observability | Services
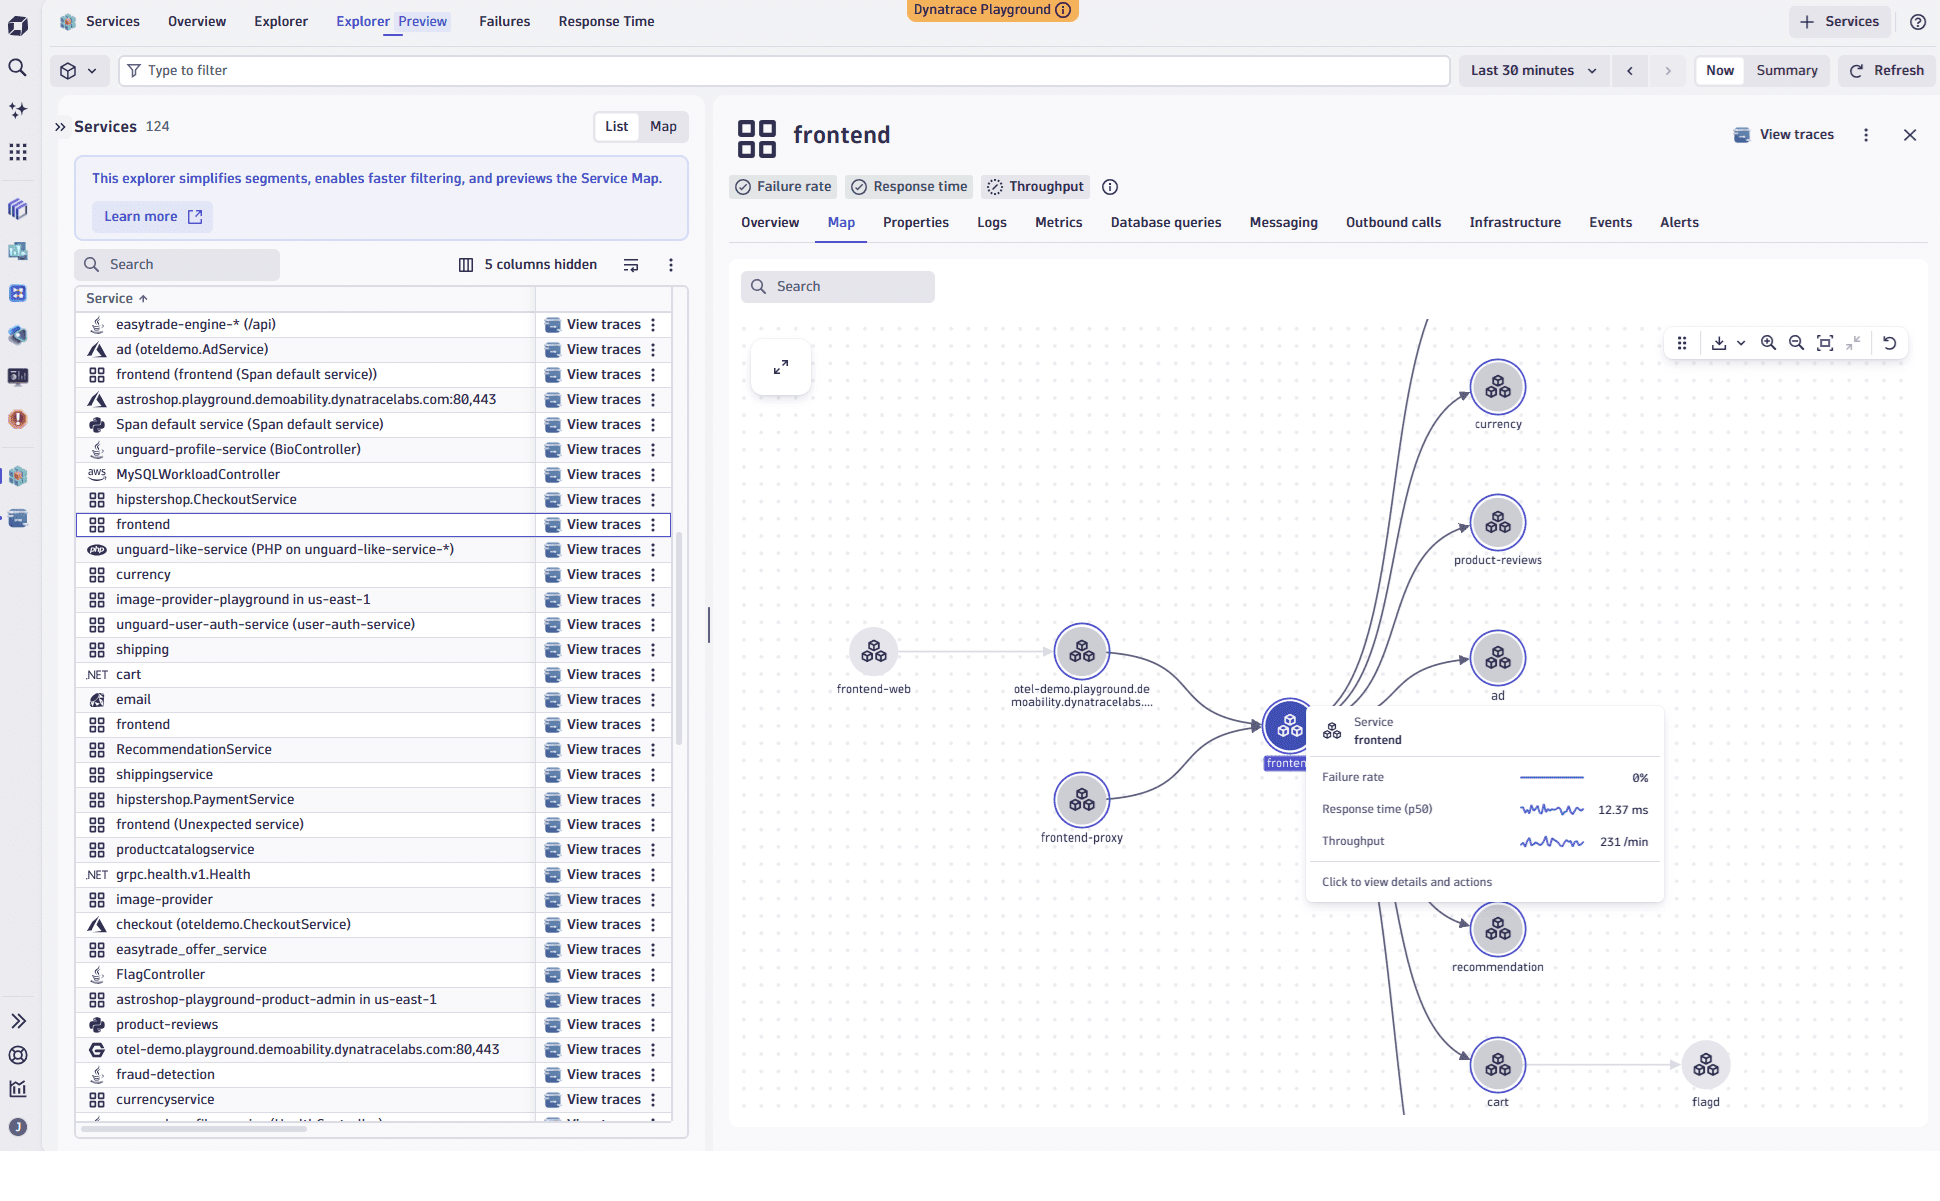
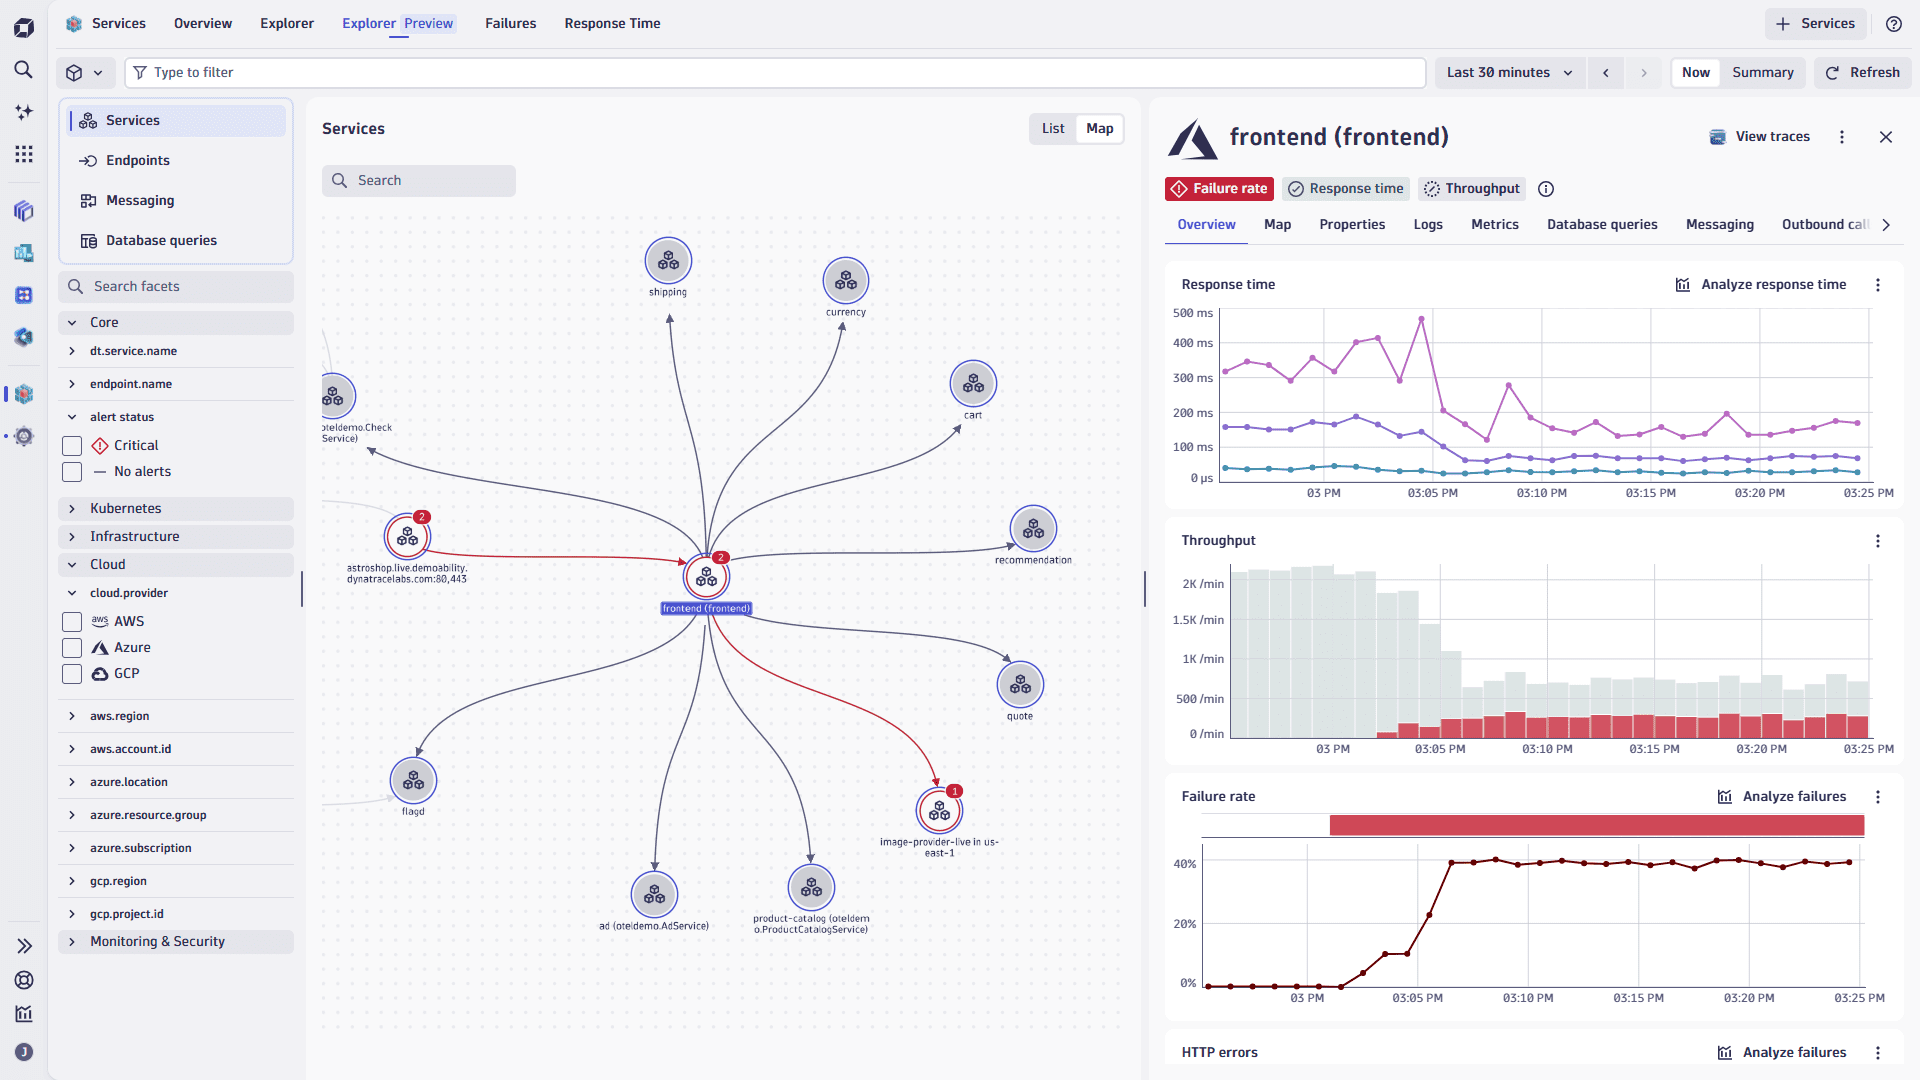
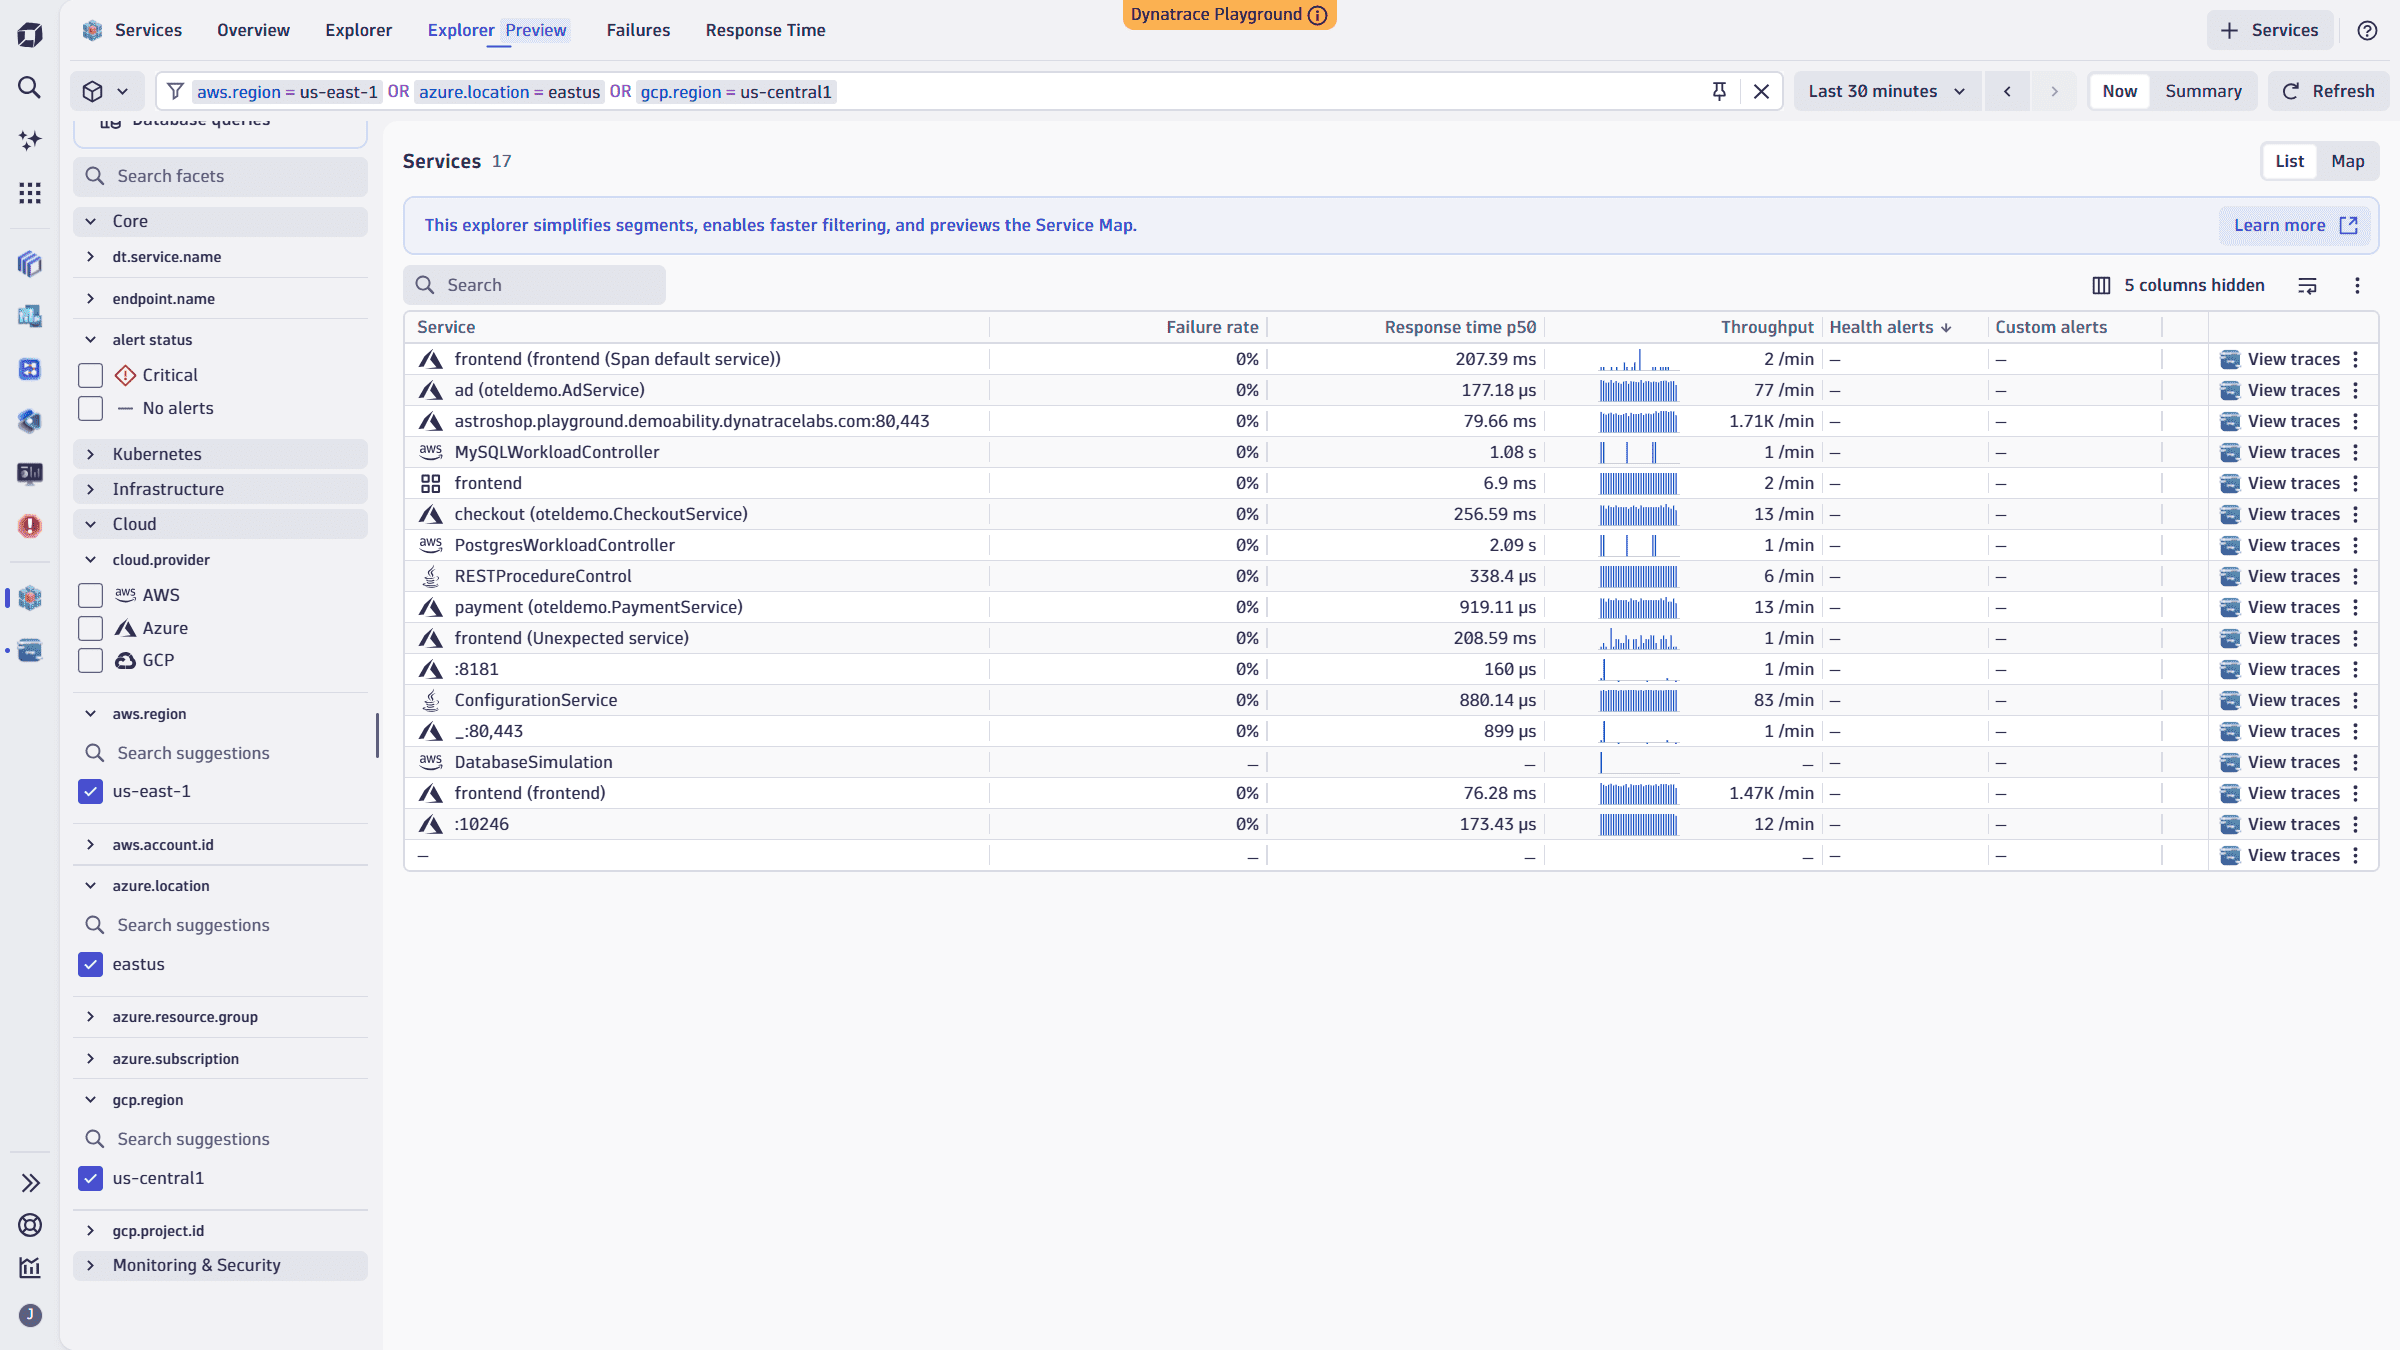
Explorer Preview with service map and primary Grail Fields filtering in Services app
 Services now includes a visual service map that shows service-to-service relationships and messaging flows, with performance and health indicators overlaid on the topology. That makes it the fastest way to understand blast radius during an incident, with topology context, performance signals, and bottlenecks visible in a single view without switching views. You can also filter services directly by primary Grail fields such as
 k8s.cluster.name, k8s.namespace.name, aws.region, and azure.location; the same attributes that power segments across Dynatrace.
Both capabilities are available in the Explorer Preview view and are open for feedback before General Availability. For more details, see Community.
Digital Experience | Users & Sessions
Full-screen mode for Session Replay
You can now watch Session Replay in full-screen mode.
Infrastructure Observability | Infrastructure & Operations
Platform tokens for classic ActiveGate APIs
Added support for platform tokens for classic ActiveGate REST APIs.
Platform
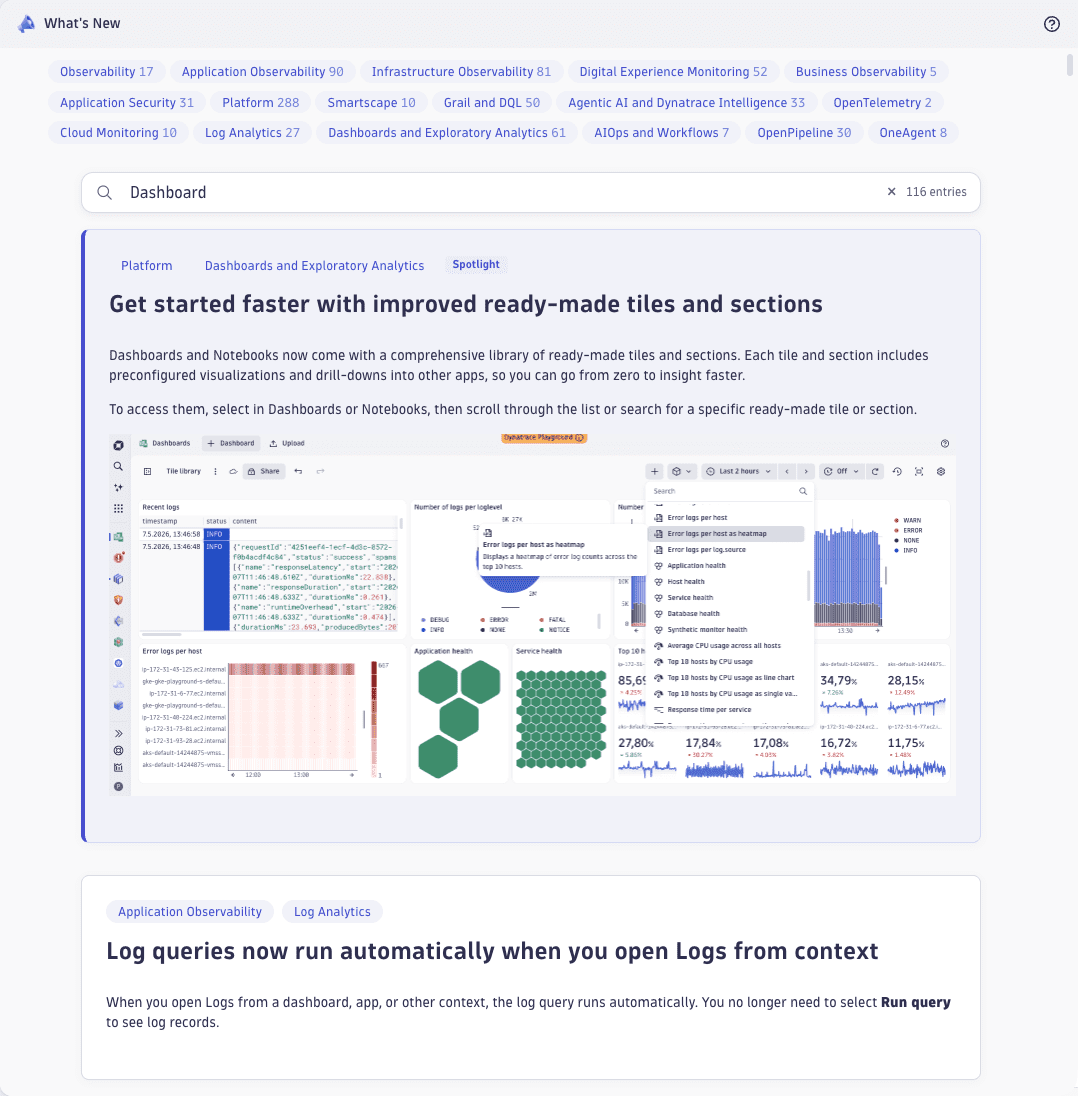
What's New — now in-product
All product news right in the product—searchable, filterable, shareable.
- Search across titles, descriptions, categories, and version numbers.
- Filter by category—pick Logs, Dashboards, Application Observability, or any other product area with a single click.
- Share easily—copy the URL to share entries with your peers.
Platform | Dashboards
View primary tags and fields in Dashboards and Notebooks
In  Dashboards and
  Notebooks, in the table visualization, the record details viewer now groups fields by main type. This includes primary tags and topology fields, as well as fields hidden by table column settings.
Platform | DQL
Durations now also support decimal numbers
Duration literals (h, m, s, ms, us, ns) now also support decimal numbers.
Examples:
0.5h.2m—which is equal to the previously supported0.2 * 1mor12s
If sub-nano precision is used, decimals are cut off:
0.5nsis always converted to0ns, meaning that even4 * 0.5ns == 0ns, whereas0.5 * 4ns == 2ns. While technically supported, the decimal notation only makes sense for units greater than nanoseconds1.23456789uswill also be truncated to1234ns, ignoring everything after
Note:
This is only supported for durations, not for calendar durations.
- Due to daylight saving time,
0.5dis ambiguous and could be something between11.5hand12.5h. For1.5M, it becomes even more obvious. - As it is not supported for calendar durations, even
1.0disn't supported as literal—use1dinstead.
Platform | OneAgent
Dynatrace Platform UX for OneAgent Log module configuration
OneAgent and Kubernetes Log module configurations are now available as a redesigned experience in ![]() Settings. The new UIs give you visibility into discovered log sources, streamline onboarding and management, clarify how rules combine across scopes, and align with Dynatrace Platform applications such as
Settings. The new UIs give you visibility into discovered log sources, streamline onboarding and management, clarify how rules combine across scopes, and align with Dynatrace Platform applications such as ![]() Settings > Process and contextualize > OpenPipeline.
Settings > Process and contextualize > OpenPipeline.
What's new
- New Sources overview with an environment-wide view of autodiscovered log sources, coverage indicators across host groups, Kubernetes clusters, and hosts, and a direct entry point to add missing custom log sources
- New UIs for log ingest rules, custom log sources, sensitive data masking, timestamp and splitting patterns, and other advanced settings
- Improved UX for inherited rules, hierarchy, and overrides, making it clear which configuration applies at each scope
- Guided configuration flow from autodiscovered log sources to ingest rules
Where to find it: ![]() Settings > Collect and capture > Log monitoring > Configure log module.
Settings > Collect and capture > Log monitoring > Configure log module.
The classic Log module settings UI remains available in the Classic Settings application while you migrate. We recommend migrating to the new experience, which is future-proof and where all future improvements will be delivered.
Platform | Problems
Additional event REST endpoints
Environments created on or after January 26, 2026, can now access the /eventProperties and /eventTypes REST endpoints. These endpoints are needed to be able to correctly create the events ingest payload.
Platform | Smartscape
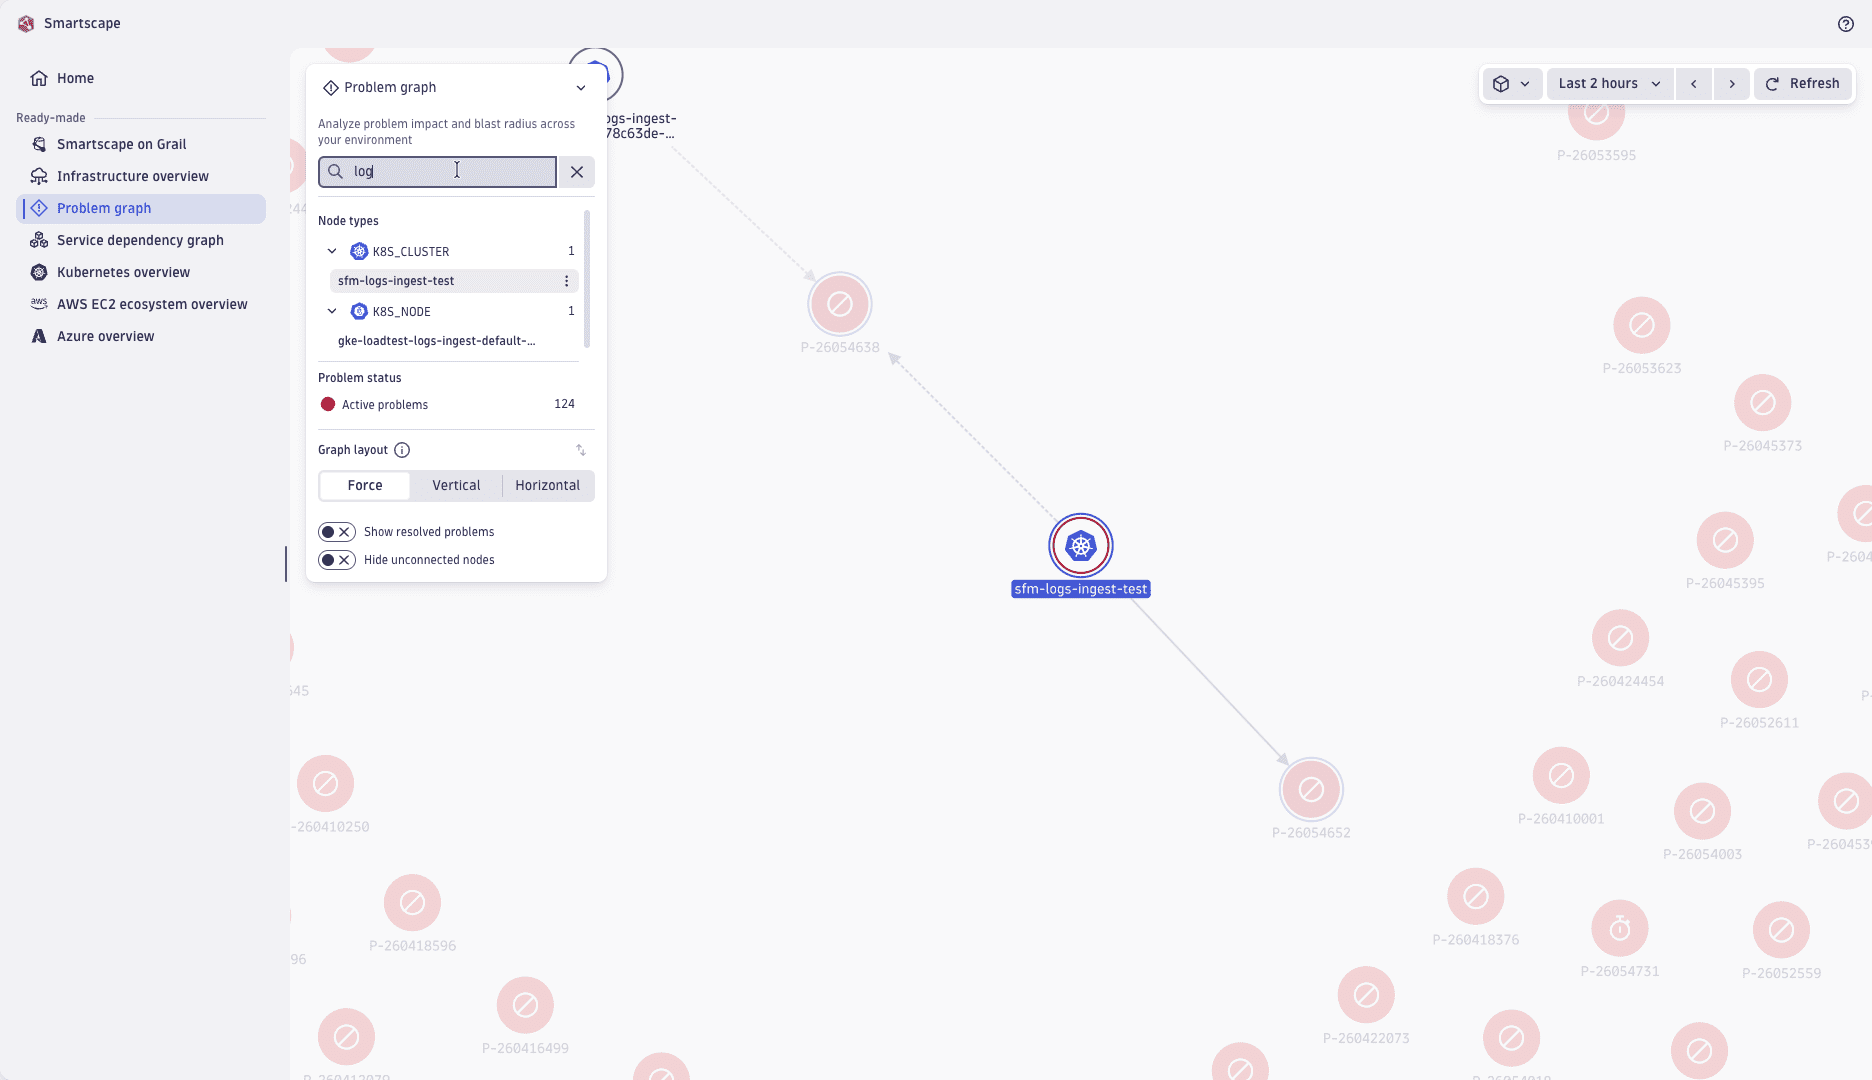
Locate specific nodes across any Smartscape view
You can now search for nodes by name or ID across all Smartscape views, including modal views. Press Ctrl+F (or Cmd+F on Mac) to focus the new search field—Dynatrace highlights matching nodes in the graph and narrows the legend to the matching entity groups. The legend is also interactive: expand any entity type to see its nodes and jump to them in the graph without typing a query.
Threat Observability | Security events
Checkmarx integration
Dynatrace now integrates with Checkmarx. For details, see Checkmarx Ingest .
Breaking changes
Application Observability
Upcoming OneAgent end of life version enforcement
Starting with Dynatrace version 1.341 , the cluster will reject connections from OneAgent versions 1.141 and earlier.
Action might be required:
If you are running OneAgent versions 1.141 or earlier, upgrade to a supported OneAgent version to avoid data loss and connectivity issues, and to benefit from enhanced security and features unavailable in earlier OneAgent versions.
For more details, see End-of-life announcements.
Infrastructure Observability
Smartscape on Grail new software technology fields for process and host
In an update to the Smartscape on Grail entity model, the previous PROCESS field process.software_technologies has been replaced by agent-specific fields.
Infrastructure Observability | Infrastructure & Operations
Deprecation of ActiveGate auto-update API
The ActiveGate auto-update configuration API is deprecated. Instead, use the Settings 2.0 API with the deployment.activegate.updates schema ID.
Infrastructure Observability | Infrastructure & Operations
New REST API for host-based ActiveGate deployment
A new REST API is now available for deploying the ActiveGate installer and retrieving connection information. Unlike the classic API, this API supports non–preconfigured installers, enabling deployment without environment-specific preconfiguration.
Platform | Dashboards
Stricter validation for dashboards
Starting with Dynatrace version 1.342, Dynatrace will apply stricter validation rules to dashboards and won't display dashboards that fail validation.
Who this affects: This will mainly affect dashboards created or modified via the API or external AI tools. Dashboards created and maintained using Dashboards can’t fail validation unless you modify them otherwise.
- If a dashboard fails validation before Dynatrace version 1.342, Dashboards will display a warning and a failure reason, but the dashboard will continue to load as usual.
- Starting with Dynatrace version 1.342, a dashboard that fails validation won’t load until you fix it.
Action plan: If you want to continue using a dashboard that failed validation, you need to fix it before Dynatrace version 1.342.
- To fix a dashboard that failed validation, use the integrated JSON editor.
- Read‑only dashboards that fail validation must be fixed by the dashboard owner.
Use Edit JSON to update the dashboard.
- To edit directly in the Edit JSON editor, display the dashboard, select Edit JSON from the dashboard menu, make your changes, and then select Save. The editor will close, and your changes will be reflected in the dashboard.
- To use a different editing environment, select Copy JSON in the upper-right corner of the editor to copy all of the JSON, and then paste the JSON into your own editor. After you make your updates in the other editor, copy and paste the edited JSON back into the Edit JSON editor and select Save.
Software Delivery | Ecosystem
Support for Smartscape topology on user.sessions and user.replays
We added support for Smartscape topology on user.sessions and user.replays.
Fixes and maintenance
Resolved issues in this release (SaaS)
- In the Smartscape node/edge extraction configuration in OpenPipeline, the pattern for the
edgeTypehas been changed from^[a-z][a-z0-9.]{0,31}$to^[a-z][a-z0-9]{0,31}$. With this breaking change, the dot (.) character is forbidden in theedgeType. (PPX-11541) - We disabled classic entity extraction for Cloud Platform Monitoring. Smartscape support is not affected by this change. (PPX-11079)
- Fixed an issue in which new synthetic Davis events were missing
dt.security_contextin Dynatrace version 1.339. (DI-28804) primary_tagsenrichment now correctly supports services with multiple tag values. (DI-28053)- Fixed an issue within the
 Extensions (classic) where monitoring configurations could not be viewed or updated for extensions that were recently updated or installed. (DAQ-25128)