What's new in Dynatrace SaaS version 1.322
- Release notes
- 10-min read
- Rollout start on Aug 26, 2025
This page showcases new features, changes, and bug fixes in Dynatrace SaaS version 1.322. It contains:
Platform | Notebooks
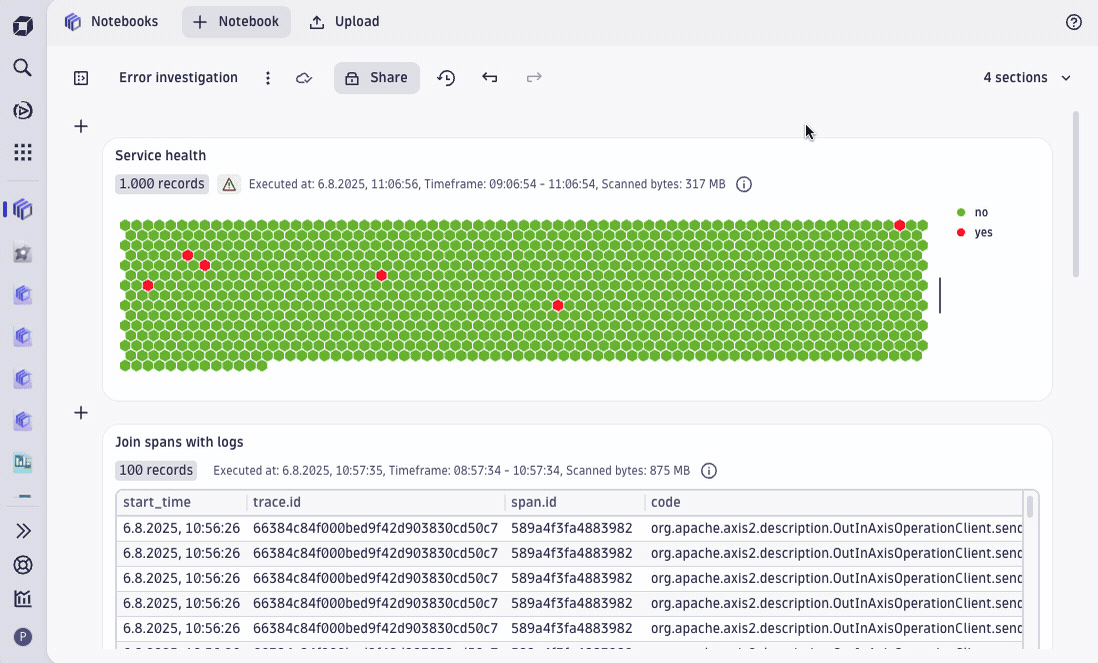
Select multiple notebook sections for bulk actions
In  Notebooks, you can now select multiple sections and perform bulk actions on the selected sections:
- Run sections
- Change their segment, timeframe
- Duplicate or delete section
- Move them within the notebook
- Send them to a dashboard via Open with
Selection options:
- Ctrl+Click to select individual sections
- Shift+Click to select a range
- Ctrl+A to select all sections
This addition makes large-scale data exploration faster and less error-prone, so it is especially useful when working with larger notebooks.
Feature updates
Digital Experience
FIPS Mode support for containerized locations created via API
You can now create containerized private Synthetic location in FIPS mode via /synthetic/locations API to stay compliant with FIPS security standards.
Set the property fipsMode to one of the following values
DISABLED – FIPS(FIPS mode is off)ENABLED – FIPS(FIPS mode is on)ENABLED_WITH_CORPORATE_PROXY – FIPS(FIPS mode is on and uses a corporate proxy)
To learn more about the API, see Dynatrace API changelog version 1.322 - /synthetic/locations
Platform | Grail
On Azure, each tenant's data is stored in a separate Azure storage account and encrypted with unique encryption key
With the latest Dynatrace and in each tenant on Azure, all Dynatrace platform data—including data from Grail, AppEngine, and AutomationEngine—is stored in a separate Azure storage account. Each such Azure storage account is encrypted with a unique encryption key, which is rotated every 365 days. Dynatrace manages the encryption keys.
Account Management | Identity & Access Management
Increase your Dynatrace SaaS environment security through Multi-Factor Authentication
Increase your Dynatrace SaaS security by choosing which of your environments requires Multi-Factor Authentication (MFA).
To use MFA
- Go to Account Management for your account.
- Go to Settings > Environments.
- In the Environments table, for each environment where you want to enforce MFA, turn on MFA enforced.
When MFA enforced is turned on for an environment, non-federated users accessing that environment are required to enter a security code sent to their registered email address.
For details, see Enhance your environment security with MFA enforcement.
Application Security
CLV and RAP compatibility update for Go applications
Dynatrace OneAgent includes a mechanism that typically allows support for newer Go versions without requiring an immediate OneAgent update. However, for code-level vulnerability detection and Runtime Application Protection (RAP), this mechanism doesn't apply.
If you're using Go 1.24.5+ or 1.23.11+, you need to update to OneAgent version 1.321+. Earlier OneAgent versions don't support these features with the updated Go runtimes, and CLV/RAP will not initialize.
Application Security | Compliance events
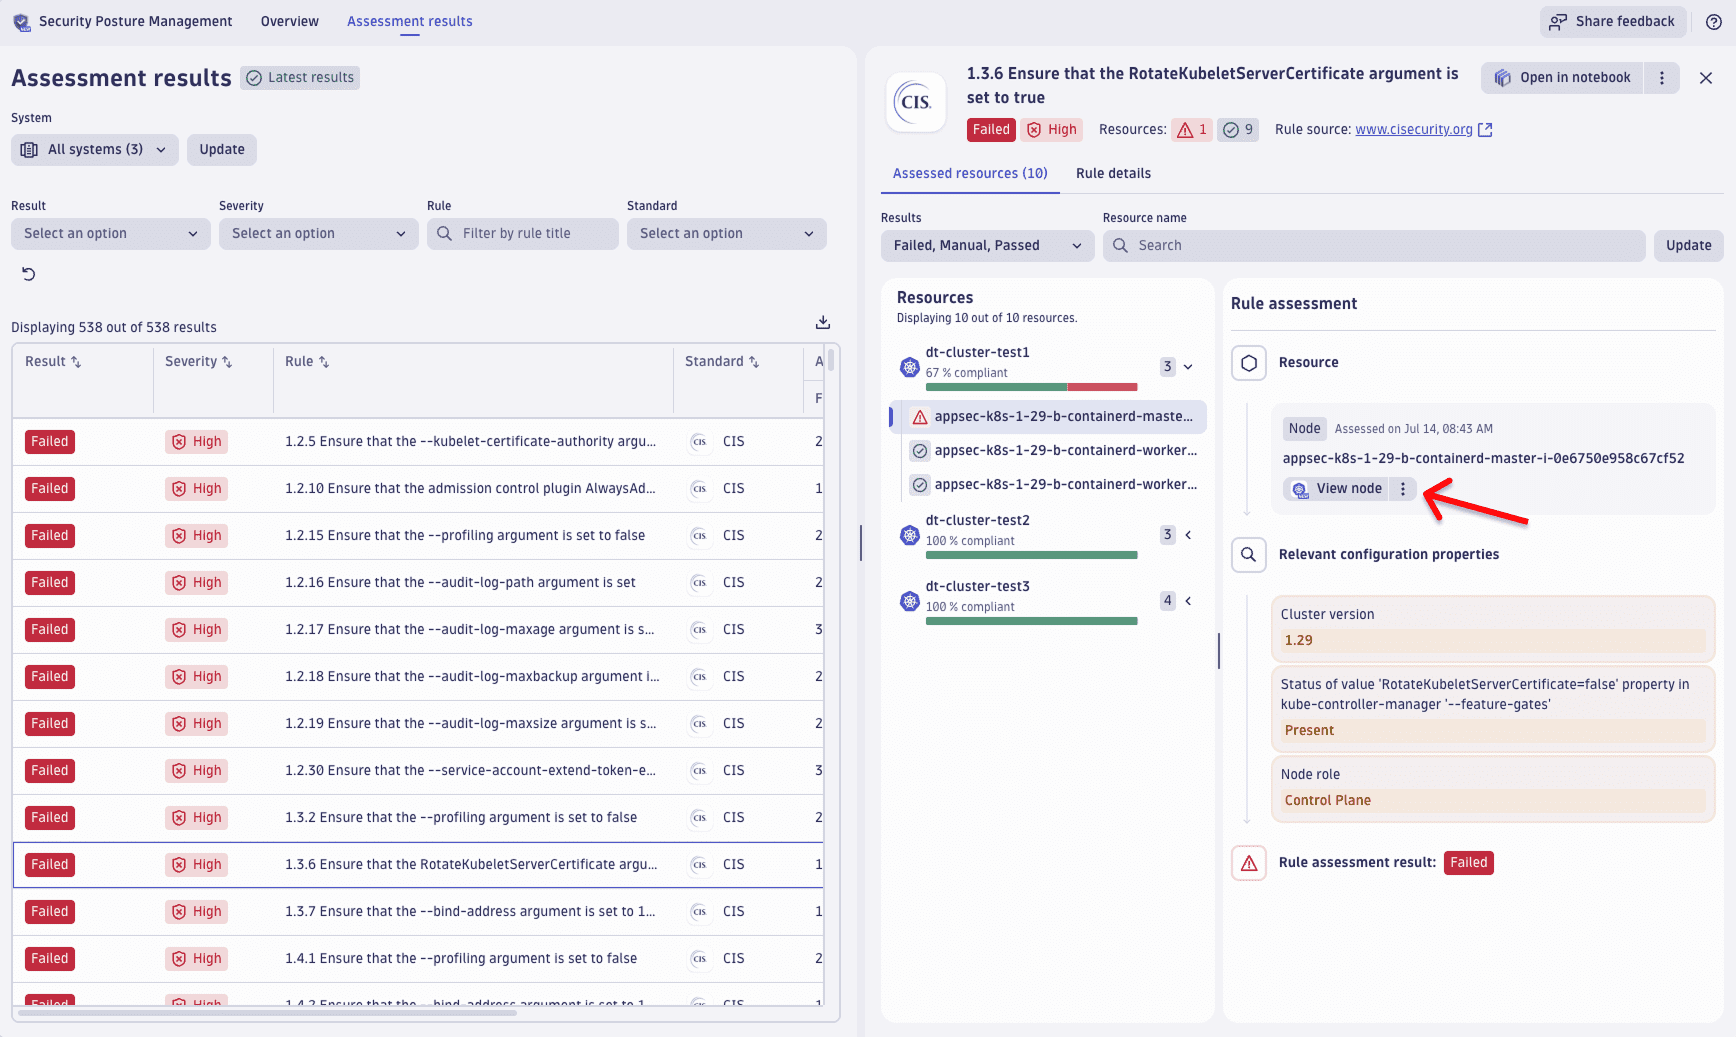
Enhanced compliance event context in Kubernetes Security Posture Management
ActiveGate version 1.321+
We've made it easier to understand and act on compliance findings in Kubernetes Security Posture Management. Compliance events now include details about the affected and related Kubernetes resources, helping you see exactly where issues occur and how they connect within your architecture.
In  Security Posture Management, you can view more information about the affected resource using the new option shown below its name.
Platform | Dashboards and Notebooks
New and enhanced commands when exploring data via the user interface
When exploring your data in  Dashboards and Notebooks via the user interface, you’ll now experience several improvements and additional options available:
- Filters are smarter and easier to use, with operators tailored to the data type (for example, no
>=operator for strings), with support for booleans and timestamps. - Logs and metric tiles both benefit from richer aggregation options: logs now go beyond count to support multiple summarizations, while metrics apply sensible defaults such as percentiles for histogram data.
- New commands bucketize, alias, and global interval have been added to simplify summarization, naming, and creating histogram visualizations. Sorting and limiting logic has also been streamlined to prevent partial or misleading results.
To learn how to use these new capabilities, see Explore data.
Platform | Dashboards and Notebooks
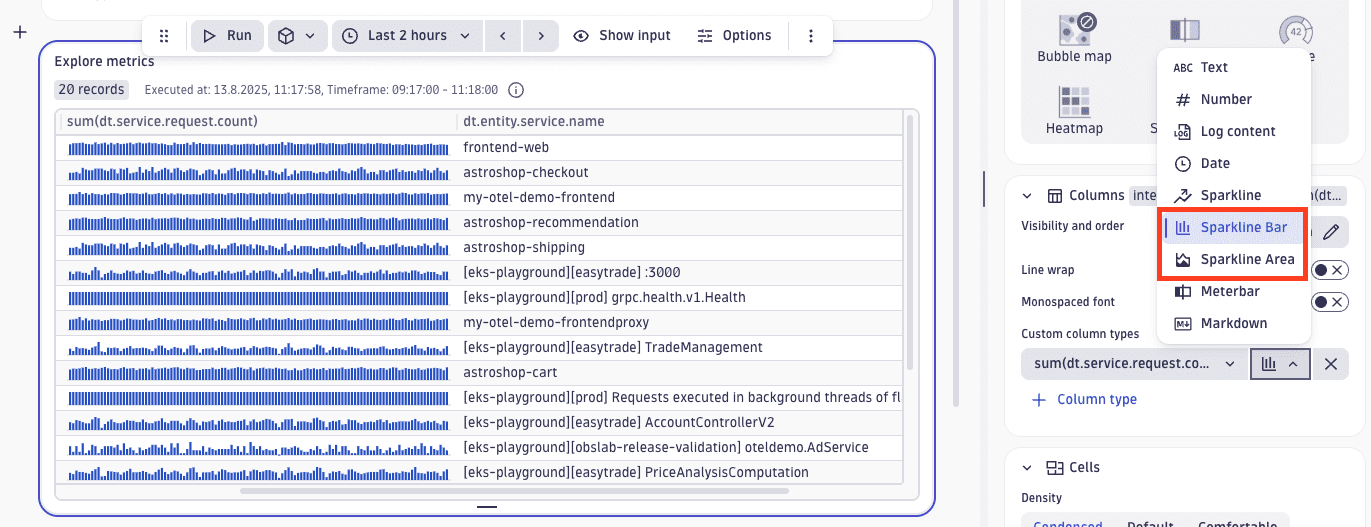
Format columns as bar or area sparklines in the table
In Dashboards and Notebooks, you can now format table columns not only as line sparklines, but also with bar sparklines for comparing magnitudes and area sparklines for emphasizing volume and growth.
Platform | Dashboards and Notebooks
Gauge visualization now supports icons
In the Gauge visualization in Dashboards and Notebooks, you can now display an icon next to the value. Icons are selectable from a list.
For details, see Gauge chart.
Platform
 Settings is centralizing configuration and simplifying setup
We’re strengthening ![]() Settings to make it the single place to configure Dynatrace. Whether you’re an admin setting up and governing the platform, or a regular user tailoring your experience,
Settings to make it the single place to configure Dynatrace. Whether you’re an admin setting up and governing the platform, or a regular user tailoring your experience, ![]() Settings is where you'll start when you want to configure and manage essential Dynatrace features.
Settings is where you'll start when you want to configure and manage essential Dynatrace features.
In this release, we've integrated the OpenPipeline standalone app into ![]() Settings.
Settings.
To access OpenPipeline, go to ![]() Settings > Process and contextualize > OpenPipeline.
Settings > Process and contextualize > OpenPipeline.
The OpenPipeline functionality and your existing configurations remain the same. Use the new location of OpenPipeline going forward and update any bookmarks; no other action is required.
This is a multi‑release initiative. Look for further ![]() Settings improvements in upcoming Dynatrace releases.
Settings improvements in upcoming Dynatrace releases.
Breaking changes
Platform | Dashboards and Notebooks
Data mapping restrictions for event-based graph visualizations
What changed?
To make data mapping easier and more intuitive, we’ve restricted certain fields in the interface for event-based charts—line, bar, and area—showing only the most relevant options.
-
Before: Fields such as
timestamp,interval, anddurationcould be mapped to the "names" option within the data mapping surface. -
After: These fields are no longer available for selection in the "names" option.
Impact
If your Dashboards or Notebooks charts rely on these fields, the affected tiles will display an error message, such as:
Selected field unavailable. The field "" is no longer available. Try adjusting the data, or select another field or visualization.
Resolution
To resolve this issue, replace the existing summarize command with makeTimeseries, and replace the by: { ... 4h } parameter with interval: 4h while using the same interval as with the previous configuration in the by.
After applying these changes, the data mapping will correctly allow suitable fields for the "names" option, and your tiles will function as expected.
For details, see the data mapping documentation for the line, bar, and area charts.
Platform | Grail
Length of dt-client-context header now limited
To ensure consistent and reliable API behavior, the length of the dt-client-context header is now limited to 512 characters for all endpoints of the Grail DQL Query API.
Fixes and maintenance
Resolved issues in this release
- Ensured scrolling by fragment when any event is selected from the timeline. (DEM-12569)
- Fixed an issue in Session Replay where some pages in the recording would appear completely blank. (DEM-13641)
- Restored correct UI flow for OneAgent bulk action settings for environments where new OneAgent communication settings flow is enabled. (MGD-6299)
- Fixed an issue where Distributed Traces Classic was not applying the proper problem timeframe. (APPOBS-9148)
- Resolved an issue where an IllegalArgumentException ("key is not a column in this row") could be thrown by the Settings framework when attempting to read from a Cassandra instance in an inconsistent state. (PS-35837)
- Improved tag parsing in alerting profiles and metric key-based metric events. (DI-21359)
- Synthetic Monitoring: Updated
event.descriptionfield in Grail for Synthetic HTTP monitor outage events to include theapi.failmessage when present, ensuring consistency with problem representation in classic Dynatrace Synthetic monitoring. (DEM-12107) - RUM: Monitors with the
certificateExpiryDatecondition were wrongly allowed by the REST API with"passIfFound": true, which is not allowed and caused unexpected events. The issue is now fixed and API validation matches the web UI to block this setting. (DEM-13306) - Standalone/application-only OneAgents under some circumstances were deactivated when, according to the configuration, they should have been active. This has been corrected; the affected OneAgents should become active automatically again. (MGD-6536)
- Users without IAM read permissions for log agent feature flags can now access the "Log ingest rules" page. (OA-52119)
Dynatrace API
To learn about changes to the Dynatrace API in this release, see Dynatrace API changelog version 1.322.