What's new in Dynatrace SaaS version 1.321
- Release notes
- 10-min read
- Rollout start on Aug 12, 2025
This page showcases new features, changes, and bug fixes in Dynatrace SaaS version 1.321. It contains:
Infrastructure Observability | Kubernetes
Dynatrace telemetry endpoints on Kubernetes for cluster-local data ingest
It's now possible to enable telemetry endpoints on Kubernetes for cluster-local data ingest via the protocols OTLP, Jaeger, StatsD, or Zipkins. For newly monitored Kubernetes clusters, this can be enabled via the ") Kubernetes onboarding page.
Kubernetes onboarding page.
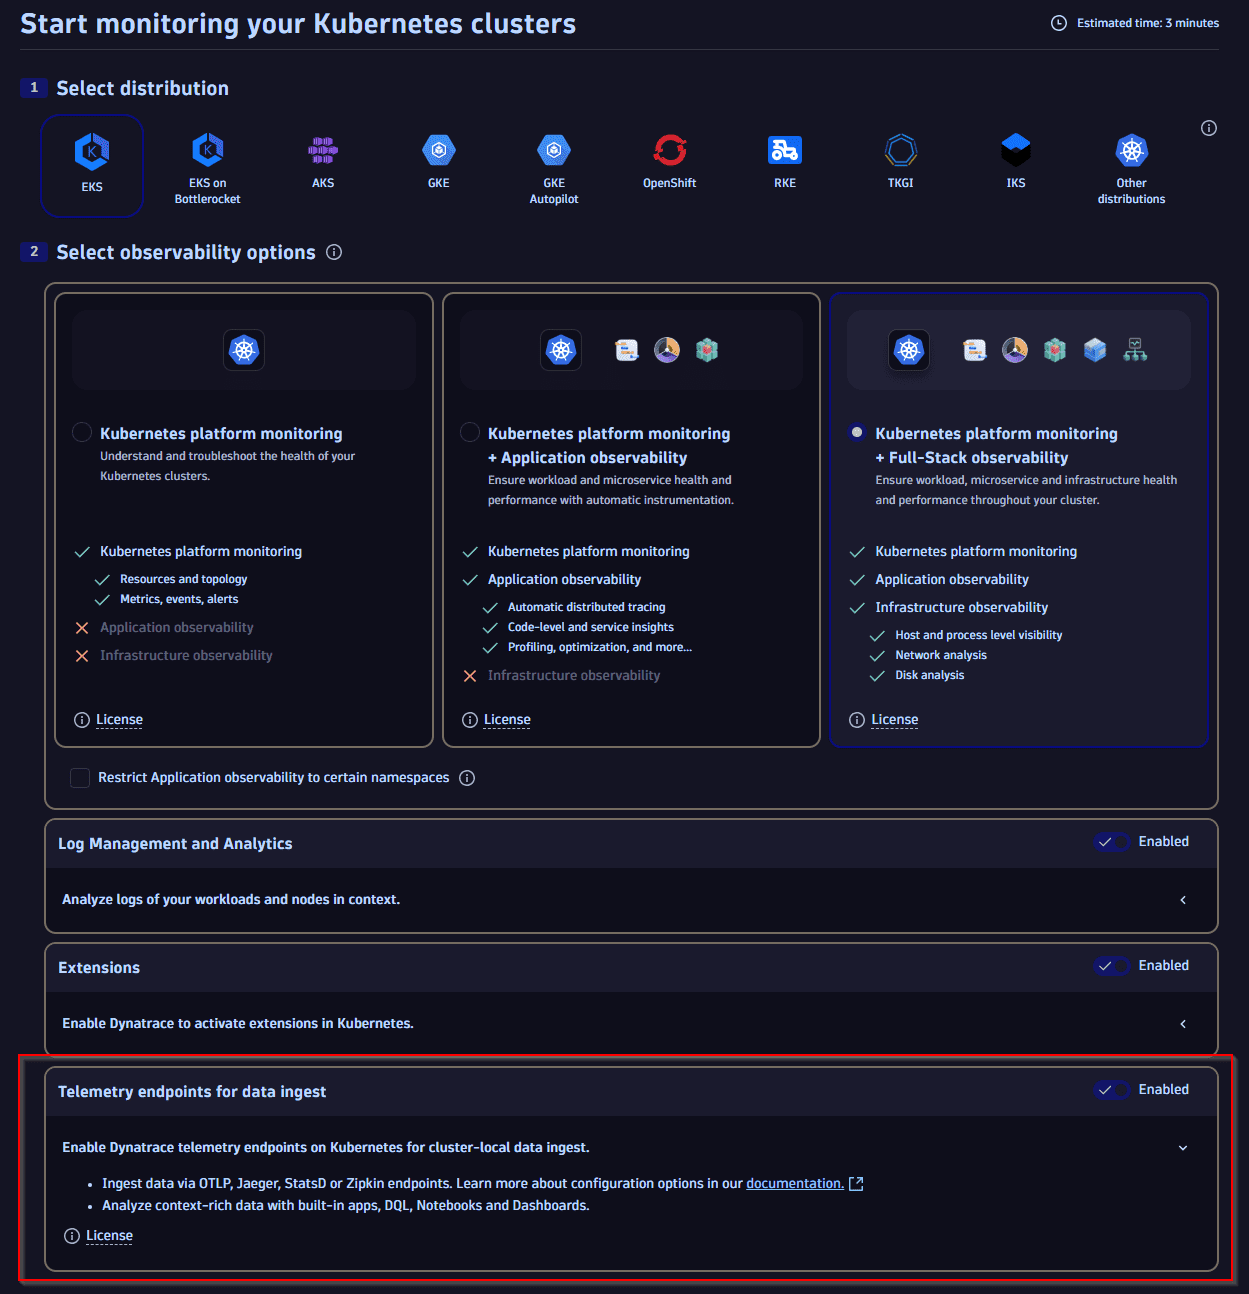
For existing Kubernetes clusters and further documentation, see Enable Dynatrace telemetry ingest endpoints.
Feature updates
Platform
Process your span data at scale with full OpenPipeline support
You can now process spans through all OpenPipeline default stages, enabling metric and event extraction, permission filtering, and flexible storage at scale.
Highlights:
- Span-aware metric extraction with support for sampling, aggregation, and duration metrics
- Default dimensions (for example, Kubernetes metadata, host group, service ID) added automatically for consistent tagging and smarter alerting
- Fallbacks for values and dimensions ensure critical metrics are captured even when data is missing
- Rich types support. Span ingest APIs now support all JSON data types, included nested fields, when ingesting spans into new processing pipelines.
Platform | Platform Services
Documents API
Identifier handling of generated identifiers (the id field) and externally supplied identifiers has been consolidated
- It no longer returns the
id, but the previously setexternalId(if any was set) - The
externalIdproperty is now deprecated, and you can provide anidproperty when creating a new document. - You don’t need to look up a document with the
externalIdto resolve a generatedidbecause you can use your supplied identifier on every endpoint of the document service API to identify a document.
Platform | Settings
Segments now support wildcards for contains and ends-with filtering
When defining segments, you can now use wildcards (*) to cover use cases where you want to filter for fields containing or ending with a specific string.
Example:
-
k8.cluster.name = *PROD* -
k8.namespace.name = *public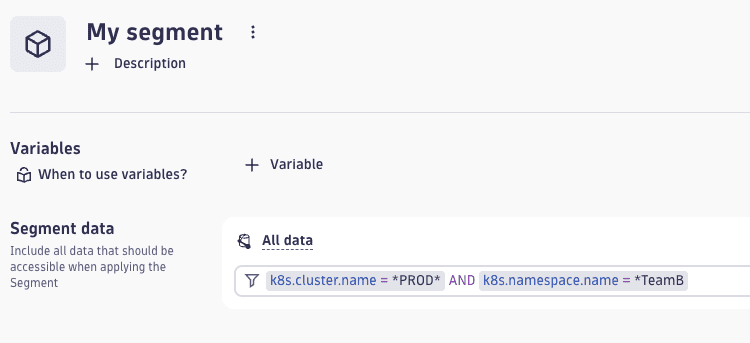 Example: wildcards in Segments
All | Kubernetes
Primary Grail fields available for telemetry originating from Kubernetes workloads and clusters
All telemetry from Kubernetes clusters and workloads is now automatically enriched with attributes about the originating Kubernetes cluster, Kubernetes namespace, Kubernetes workload, host group, and more.
With this update, you can:
- Filter this data in the
 Distributed Tracing,
  Logs,
Logs,  Notebooks,
  Dashboards, and more based on Kubernetes metadata.
 - Route all data for a particular Kubernetes cluster into a single pipeline.
- Set up Grail buckets per Kubernetes cluster.
- Define your permissions and cost allocation based on Kubernetes attributes or labels.
To learn more, see Metadata enrichment of all telemetry originating from Kubernetes.
All | Kubernetes
Primary Grail tags available for all Kubernetes telemetry
This release introduces primary Grail tags, which are tags enriched onto any supported telemetry and enable consistent usage of the product.
With this update, you can:
- Route data to a dedicated pipeline for a dedicated primary Grail tag.
- Store data to a dedicated bucket for a dedicated primary Grail tag.
- Set up permissions via a dedicated source tag by mapping it to a security context.
- Set up cost allocation via a dedicated source tag by mapping it to a security context.
- Filter all telemetry data by primary Grail tag in all applications.
We are initially supporting Kubernetes namespace labels and annotations as source for primary Grail tags. If you already have such labels or annotations that designate your departments, team ownership, application IDs, or cost center, and deployment information like Kubernetes cluster or namespace are not enough, you can now use these to configure and use Dynatrace cohesively. This also means that, instead of setting up tagging in Dynatrace, you can simply leverage your existing Kubernetes labels.
To learn more, see Primary Grail Tags.
Infrastructure Observability | Log Monitoring
Override content type for logs ingested via Logs Ingestion API
There is an option to provide content-type with a query parameter for generic ingest (/logs/ingest) content-type only. The value provided in the query parameter has priority over the type specified in the content-type header.
Application Security
Workflow trigger support for security.events
To trigger workflows, you can now use security.events generated by Dynatrace Application Security, ingested via the v1/security.events endpoint, or ingested via custom/security.events/ endpoints.
Software Delivery | Ecosystem
OAuth support for ServiceNow Connector
The ServiceNow Connector supports the OAuth client credentials grant type for enhanced security with Dynatrace Workflows.
To configure the ServiceNow OAuth authentication type for Workflow connections, see ServiceNow Connector to integrate with Workflows.
Business Observability
Streamlined triage of potential security incidents with links from Compliance Assistant to Threats & Exploits
To streamline the triage of potential security incidents, the  Compliance Assistant Incidents ICT critical services panel now links directly to
  Threats & Exploits from three points.
- The menu in the Incidents ICT critical services panel offers a link to the Threats & Exploits overview page.
- When a security incident is displayed, it redirects to that detection finding in Threats & Exploits.
- All Security incidents now links to the Threats & Exploits overview page.
Application Observability | Services
Endpoint detection rules update
With this release, only service entry points (server/consumer spans) become endpoints, excluding outbound calls to other services. Endpoint names also change to include the HTTP method.
Results:
- Focuses metrics on actual service health rather than total system activity.
- Reduces endpoint counts and improves service performance representation.
Availability:
- New customers get these new rules automatically.
- Existing customers must opt in via Settings.
To preview changes before opting in, use the dashboard attached to our Dynatrace Community post.
For details, see Service Detection v2.
IAM
Dashboards Classic: share classic dashboards with IAM policy–based users and groups
In Dashboards Classic, in addition to sharing classic dashboards with classic role-based users and groups, you can now share dashboards with IAM policy–based users and groups through the dashboard-specific share settings.
Account Management | Subscriptions and Licensing
Licensing documentation restructured to mirror rate card categories
To make it easier to find details about how licensing consumption is calculated, we have restructured the licensing documentation to offer a more intuitive content structure that mirrors the rate card.
This is just one step in a larger effort to improve Dynatrace licensing documentation. More content enhancements from our Account Management team are currently in development.
If you have saved shortlinks to any pages (for example, ...docs.dynatrace.com/docs/shortlink/topic_ID), your links will still work. They are redirected automatically.
If you have saved permalinks (static, non-relative URLs), they will no longer work.
To replace a saved static link with a shortlink
- Use the menu structure (or search functionality) to navigate to the page in your browser.
- Hover over the page title or a subheading and select the Copy shortlink icon.
This copies the shortlink URL to your clipboard. - Edit the saved link to replace the static URL with the shortlink URL.
Breaking changes
Application Security | Vulnerabilities, Attacks
Code-level vulnerabilities and attack protection for Go now generally available
The Dynatrace platform now provides general availability support for detecting and protecting against code-level vulnerabilities and attacks in Go applications. As part of this update, related settings schemas have been revised:
- Runtime Vulnerability Analytics:
- Schema:
builtin:appsec.runtime-vulnerability-detection - Setting via REST API:
globalMonitoringModeGo- Accepted values:
MONITORING_ON,MONITORING_OFF
- Accepted values:
- Schema:
- Runtime Application Protection:
- Schema:
builtin:appsec.attack-protection-settings - Setting via REST API:
blockingStrategyGo- Accepted values:
OFF,MONITOR,BLOCK
- Accepted values:
- Schema:
Application Observability
Profiling metrics use upper case for entity ID dimensions
All profiling metrics (dt.profiling.*) are now consistent with other metrics and report their entity ID context in upper case. This may break your DQL queries if you used the metrics with the entity ID filters, for example in Dashboards.
For example, dt.entity.process_group_instance is now always reported as PROCESS_GROUP_INSTANCE-123AB45C6DEF7G89 with the dt.profiling.jvm.threads.count metric.
timeseries { avg(dt.profiling.jvm.threads.count) },by: { dt.entity.process_group_instance, thread.state_category },filter: { matchesValue(thread.state_category, "locking") and matchesValue(dt.entity.process_group_instance, "PROCESS_GROUP_INSTANCE-123AB45C6DEF7G89") }| fieldsAdd name = entityName(dt.entity.process_group_instance), state = thread.state_category
Fixes and maintenance
Resolved issues in this release
- ATM migration logger has been changed back from the throttled logger to the general one. This is necessary for log monitoring. (APPOBS-8865)
- Resolved an issue that caused slow loading of distributed traces in the web UI for on-demand analysis. (MGD-6243)
- Prevented throwing an exception in migration of the request timeout property for HTTP monitors. (DEM-11978)
- Fixed an issue in Session Replay where some pages in the recording would appear completely blank. (DEM-13641)
Dynatrace API
To learn about changes to the Dynatrace API in this release, see Dynatrace API changelog version 1.321.