Dynatrace SaaS release notes version 1.257
- Latest Dynatrace
- Release notes
- Published Jan 01, 2020
Rollout start: Jan 2, 2023
Announcements
Log Management and Analytics
Infrastructure Monitoring | Log Management and Analytics
Log Management and Analytics powered by Grail documentation now covers the full lifecycle from setting up Log powered by Grail, bringing in your log data to Dynatrace, configuring options like masking, buckets and processing log data, to analytics. You can pick your preferred method for ingesting log data—OneAgent with all the scalable configuration options like autodiscovery of logs or Kubernetes support, or integrating the generic log ingestion API with your existing log shippers. Whether you're upgrading from the earlier Log Monitoring solution or are a new user, you can configure log metrics or events with support for DQL-based matchers. Get answers from log data with the Logs and events viewer or by creating automations and dashboards.
Davis Assistant end of life
Dynatrace Davis Assistant will reach end of life on January 31, 2023. After this date, the service will be shut down, and interactions with Davis Assistant will no longer be possible. Existing integrations, for example, with Slack or Microsoft Teams, will cease to work at that time.
For options and best practices on managing the push of problem notifications to your preferred third-party incident management or ChatOps service, see problem notifications documentation.
New features and enhancements
Improved metric browsing in Data Explorer
Cross Solutions | Data Explorer
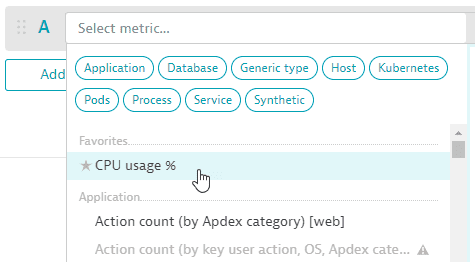
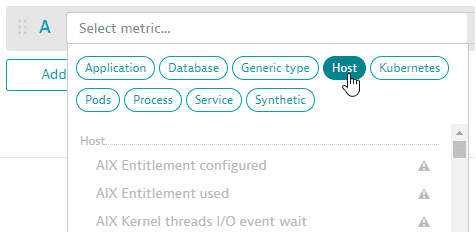
The metric selector in Data Explorer has been improved to make it easier to find and select metrics for your data queries.
-
If you have favorited any metrics in the Metrics browser browser, those metrics are displayed at the top of the list in the metric selector.

-
You can select a metric category to focus the list of metrics.

Previously deprecated metrics are no longer available
Digital Experience | RUM Mobile
The two previously deprecated metrics—builtin:apps.other.reportedErrorCount.osAndVersion and builtin:apps.other.sessionCount—are no longer available in Data Explorer and Dynatrace API. Instead, use the following metrics:
- For mobile apps
builtin:apps.mobile.reportedErrorCountbuiltin:apps.mobile.sessionCount
- For custom apps
builtin:apps.custom.reportedErrorCountbuiltin:apps.custom.sessionCount
Fail on-demand HTTP monitor executions for SSL certificate issues
Digital Experience | Synthetic Monitoring
The new Fail on missing or expiring SSL certificate toggle enables you to fail on-demand HTTP monitor executions when HTTP requests encounter expired, missing, or expiring SSL certificates. Note that this setting only works if SSL expiration date verification has already been enabled for an HTTP request in monitor settings; it uses the request-level setting to check for SSL certificate validity within the specified number of days.
90-character limit for blocking requests in browser monitors
Digital Experience | Synthetic Monitoring
In transitioning to Manifest Version 3, the latest iteration of the Chrome extension platform, the Block specific requests setting for browser monitors is now limited to URLS or regular expressions with a maximum length of 90 characters. For browser monitors with URL/regex strings exceeding 90 characters:
-
The Block specific requests setting is not being applied and needs to be fixed to meet the 90-character length requirement.

-
You will not be able to save certain changes to browser monitor configuration such as adding a request or validation. You can, however, change monitor name, frequency, outage handling, and thresholds. The Block specific requests setting needs to be fixed before you can save all changes.
Compare execution details for on-demand HTTP monitor executions
Digital Experience | Synthetic Monitoring
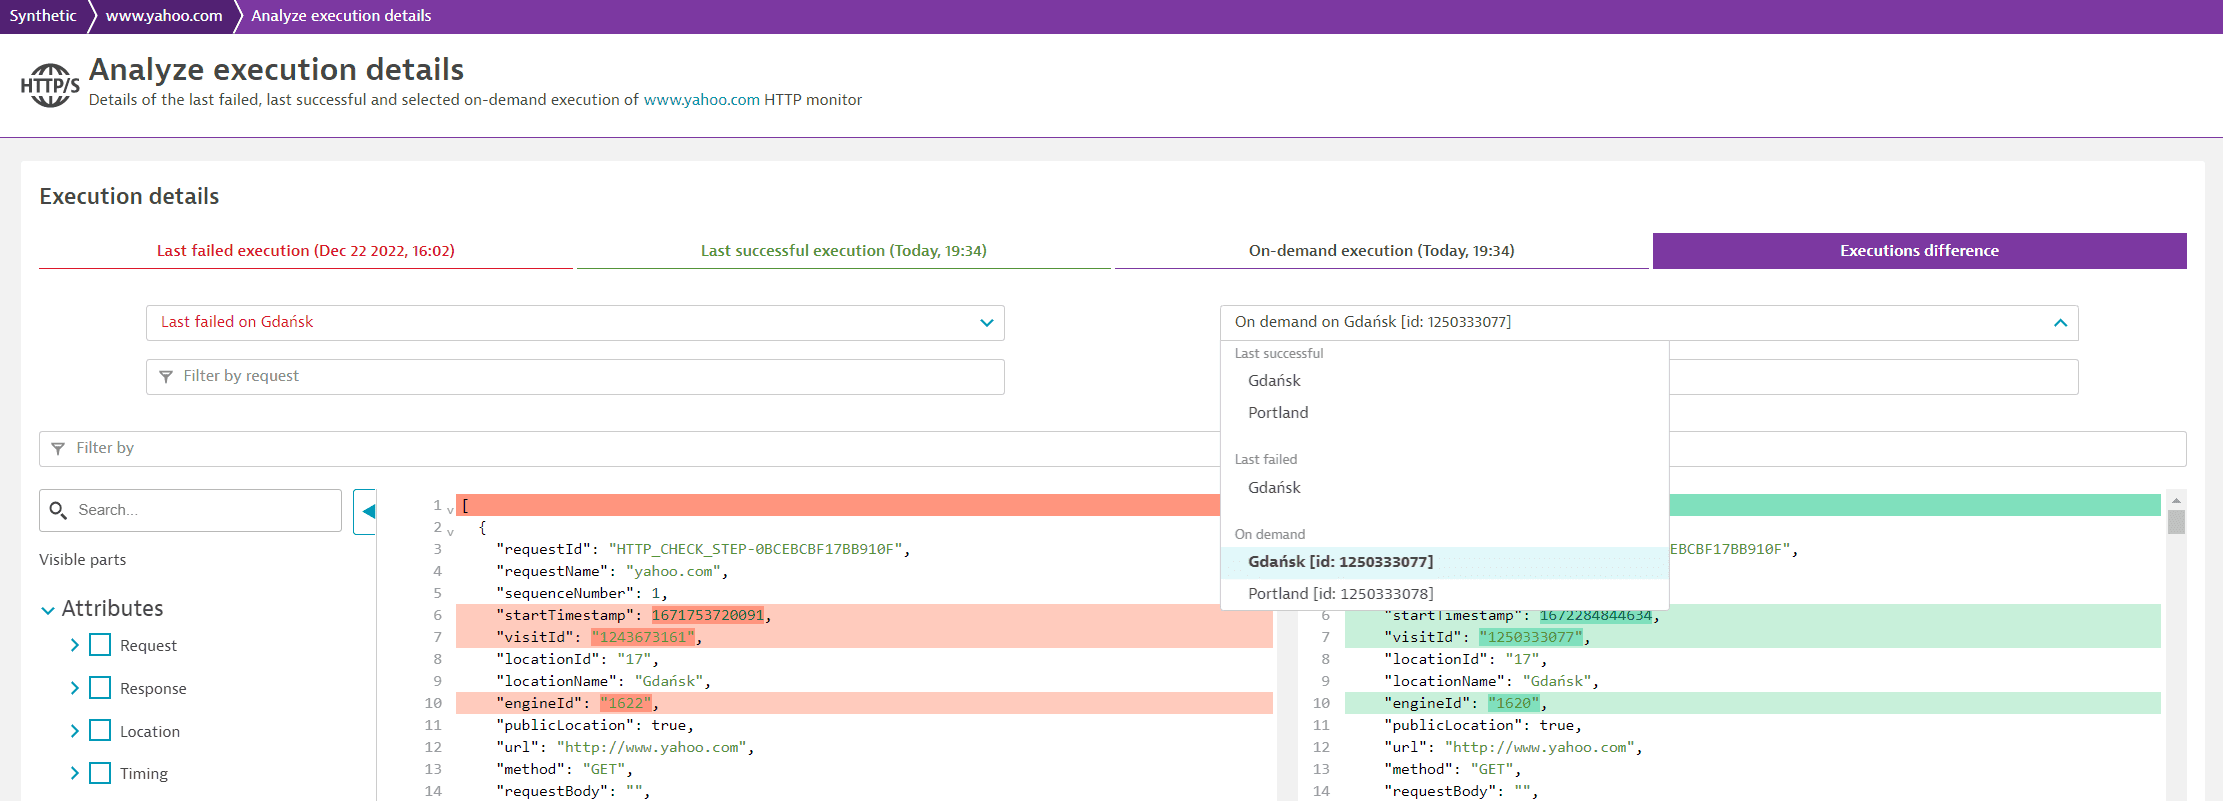
Now when you Analyze execution details for HTTP monitors, in addition to the last successful and failed executions per location, you can also compare the on-demand executions from the last six hours.

Tags on the OS Service page
Infrastructure Monitoring | Hosts
You can now see the tags assigned to a specific service on the OS service page.
Query-level visibility and log events support in SQL Datasource
Infrastructure Monitoring | Extensions
Oracle monitoring extensions are extended with query-level visibility. It leverages the SQL DataSource's new capability of collecting log-based data, such as query execution statistics, execution plans, or audit logs.
Updated JRE version in ActiveGate installer
Infrastructure Monitoring | ActiveGate
ActiveGate installer now uses Adoptium JRE version 11.0.17.
Business event metric extraction
Business Observability | Metrics
Business event metric extraction is a convenient way to create your business metrics. It enables you to:
-
Create custom alerts, such as when a certain value surges or drops. Alerts can be based on attribute values or specific business events occurrences.
-
Reduce your DDU consumption and lower your costs.
Additional DQL functions
Cross Solutions | DQL
Now you can include the following functions in your DQL queries:
-
Mathematical functions
-
String functions
Dynatrace API
To learn about changes to the Dynatrace API in this release, see Dynatrace API changelog version 1.257.
Resolved issues
General Availability (Build 1.257.164)
The 1.257 GA release contains 12 resolved issues.
| Component | Resolved issues |
|---|---|
| RUM | 1 |
| Cluster | 8 |
| Autonomous Cloud | 1 |
| User interface | 1 |
| unknown | 1 |
RUM
- Fixed single value visualization of USQL. (APM-392812)
Cluster
- Previously, when querying the Problems API v2 using a problem selector with 'severityLevel(INFO)', a 500 internal server error occurred. Now a 400 error is correctly returned with a proper error message. (A problem, by definition, never has severity level INFO.). (DAVIS-2809)
- To prevent a timeout when creating a JMX/PMI extension (Settings > Monitoring > Monitored technologies > Add new technology monitoring > Add JMX/PMI extension > Use JMX/PMI extensions editor), the number of example processes used as a metrics source for the JMX extensions creator is now limited to 1000. (TI-4138)
- Fixed an issue in which the entity extraction and remapping (for generic topology) from event properties worked only via the v2 Event REST API. Now all event ingest channels (such as log events or metric events) are supported. (DAVIS-2922)
- Calculated service metrics API update operations can now be made even when the metrics limit has been reached. (Solves `Limit reached for service metrics`.). (TI-4214)
- Calculated service metric dimensions with more than 21,845 characters now will be truncated to that size instead of not booking the metric data point. (TI-4116)
- Fixed a problem that caused a queue name to unexpectedly change from trace to trace. (TI-4184)
- Fixed a page crash appearing when a user lacking permission opens the Dynatrace environment page. (DAVIS-3036)
- Fixed metric schema pagination problem that was discarding metadata selector. (Solves Metrics API NextPageKey not working when applying metadataSelector.). (APM-391833)
Autonomous Cloud
- The deployment page now references the newly released Dynatrace Operator v0.10.1. (K8S-4385)
User interface
- Filter suggestions have been improved to avoid issues when fetching data. (Solves problem with inconsistent results from user session filters.). (RUM-8036)
unknown
- Fixed an issue in which the use of the partition operator in the metric selector would sometimes return an error. (Solves `Angular Log Unexpected response during SLO evaluation`.). (CLUSTER-3394)