Enable endpoint-level metrics for SDv1 services
- Latest Dynatrace
- How-to guide
- 8-min read
With Enhanced endpoints for SDv1, every detected endpoint on your Service Detection v1 (SDv1) services automatically produces metrics: response time, throughput, and failure count. No key request configuration is needed. These metrics are available in  Dashboards,
  Notebooks,
  Service-Level Objectives, alerting, and
  Services. They're the same
 dt.service.request.* metrics produced by Service Detection v2 (SDv2) and OpenTelemetry services, so a single dashboard query works across all service detection versions.
HTTP requests from services with http.route automatically get descriptive endpoint names. HTTP requests without http.route receive stable endpoint names thanks to the automatic naming heuristic, and fall back to generic names like GET /* otherwise. Review Naming for HTTP-related endpoints in SDv1 and Fine-tune endpoint names before activating the Enhanced endpoints feature.
For a guided walkthrough that connects Enhanced endpoints, request naming rules, and custom placeholders, see the Enhanced Endpoints Guide in the Dynatrace Community.
Benefits
The Enhanced endpoints feature replaces the need to configure key requests. Existing key requests are preserved—any endpoint you previously configured as a key request keeps its name and appears alongside the new automatically detected endpoints. Every detected endpoint gets its own response time, throughput, and failure count automatically, with no manual selection needed.
- Automatic metrics for every endpoint: Previously, only manually configured key requests got individual metrics, while everything else was aggregated into a single
NON_KEY_REQUESTbucket. Enhanced endpoints eliminates that limitation. - One query across all detection versions: SDv1 and SDv2 services use the same
dt.service.request.*metric keys. Build a dashboard once, and it works for all your services regardless of detection version. - Full endpoint visibility in Services: See every endpoint for your SDv1 services in Services, so you can pinpoint which endpoint is degrading instead of investigating an aggregated bucket.
No endpoints are created for external services, background activity services, queue listener services, or key value store services. In Services, these service types have dedicated views (such as Database queries, Messaging, and Outbound calls) instead of endpoints.
Use endpoints and metrics
Endpoints and their metrics appear in Services.
- Go to Services > Explorer.
- Select a service.
- On the Overview tab, scroll to the Endpoints section.
Go to the Explorer Preview tab > Endpoints to instantly see the list of endpoints for your services. For more details on this new tab in Services, refer to this blog post in the Dynatrace Community.
From there, you can view endpoint metrics, open traces for each endpoint, and perform more actions using the Actions menu.
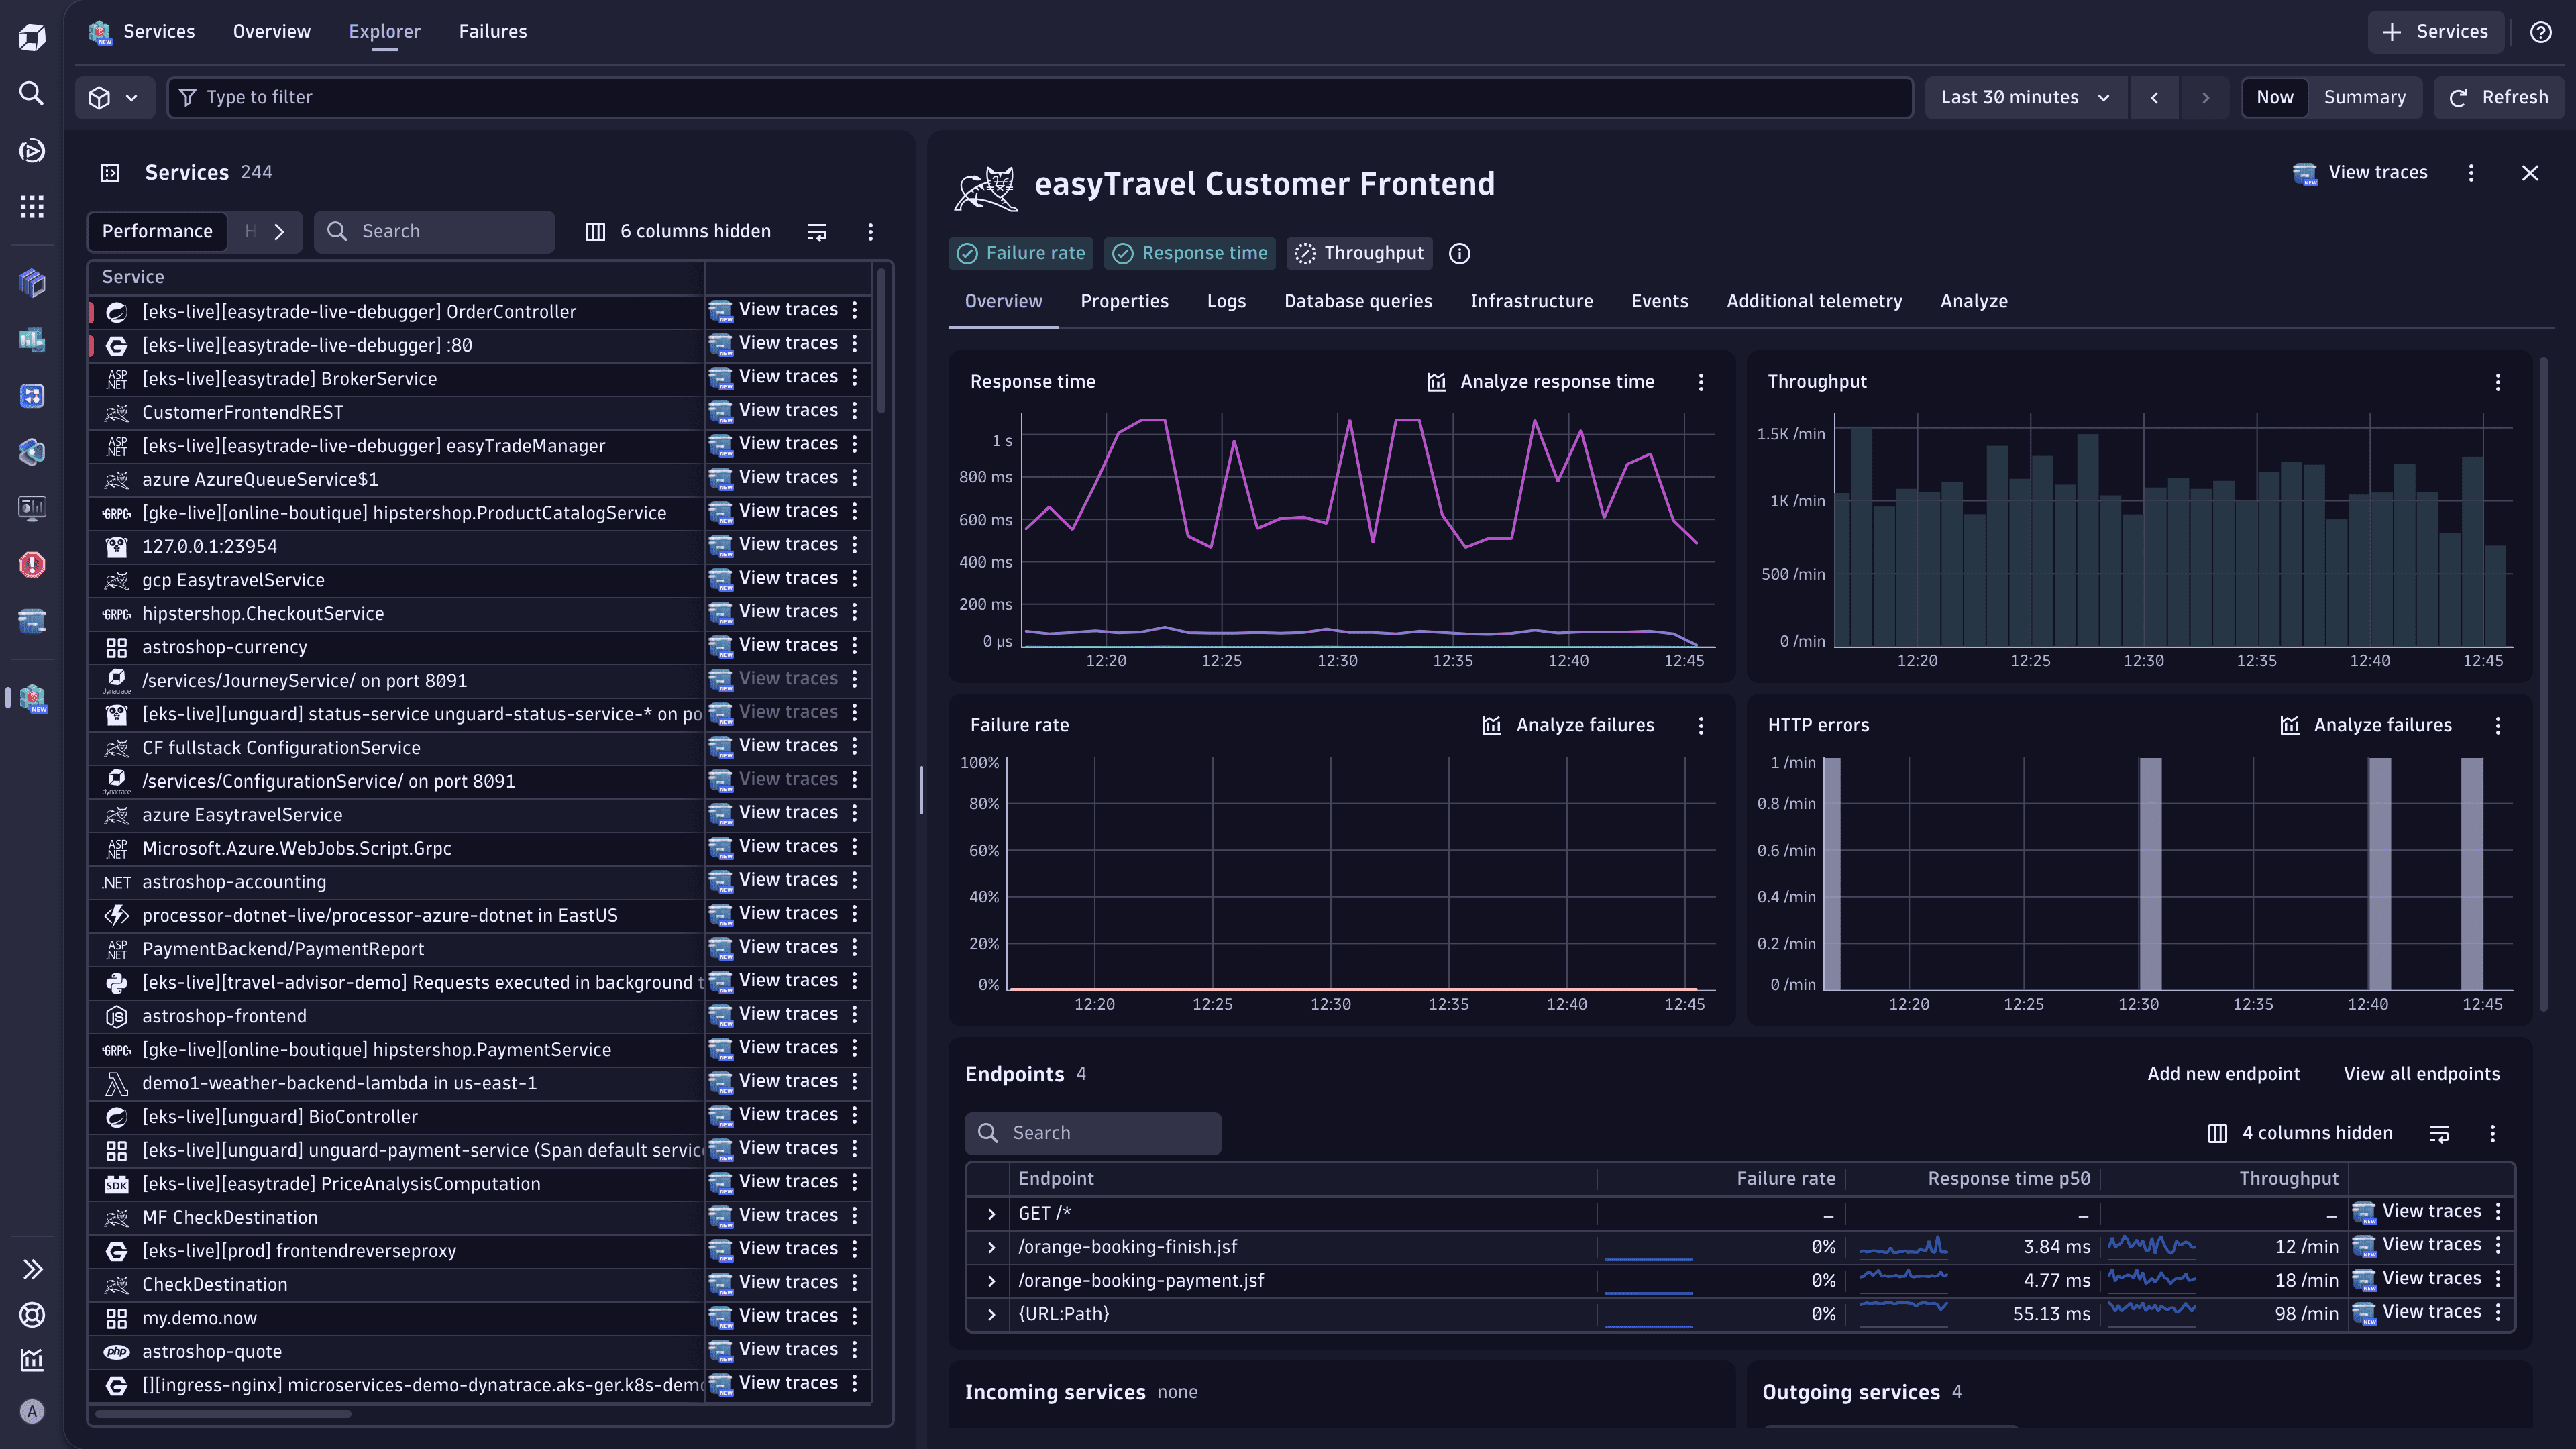
The Endpoints section shows each endpoint with its response time, throughput, and failure rate. You can sort by any column to find your slowest or most-called endpoints. To investigate a specific endpoint, select it to see its time-series charts and traces. To see the underlying URL paths, select an endpoint and select View all URLs to open  Distributed Tracing. For more information on how endpoints differ from URLs, see Endpoints vs URLs.
You can also use endpoint metrics in:
- Dashboards: Query
dt.service.request.response_timefiltered by endpoint name to track performance trends. The same query works whether the service uses SDv1 or SDv2. - Service-Level Objectives: Create SLOs targeting a specific endpoint response time or failure rate.
- Alerting: Configure alerts on individual endpoint metrics to detect when a single endpoint degrades.
Metric keys
| Metric | Key |
|---|---|
Throughput |
|
Failure count |
|
Response time |
|
Feature availability
| Environment created in | Available in | Default | Configurable? |
|---|---|---|---|
Dynatrace version 1.329 and earlier | Dynatrace version 1.333+ | Off | Yes |
Dynatrace version 1.330 – Dynatrace version 1.332 | Dynatrace version 1.330+ | On | Yes |
Dynatrace version 1.333+ | Dynatrace version 1.330+ | On | No |
Enable Enhanced endpoints
You can activate Enhanced endpoints for the entire environment, a specific host group, or a Kubernetes namespace and cluster.
Enable for the entire environment
- Go to
 Settings > Process and contextualize > Services.
 - Under Service detection v1, select Enhanced endpoints for SDv1.
- Turn on Enable enhanced endpoints for SDv1.
- Recommended Turn on Resolve request attributes for SDv1 request naming rules. For details, see Request attribute values in endpoint names.
Enable for a host group
- Go to Settings.
- In the upper-left corner, select Go to entity, filter by Host group, and select the target host group.
- Go to Process and contextualize > Services > Enhanced endpoints for SDv1.
- Turn on Enable enhanced endpoints for SDv1.
- Recommended Turn on Resolve request attributes for SDv1 request naming rules. For details, see Request attribute values in endpoint names.
Enable for a Kubernetes namespace or cluster
- Go to
") Kubernetes.
Kubernetes. - Select the namespace or cluster.
- Select (Actions menu) > Service detection settings.
- Go to Process and contextualize > Services > Enhanced endpoints for SDv1.
- Turn on Enable enhanced endpoints for SDv1.
- Recommended Turn on Resolve request attributes for SDv1 request naming rules. For details, see Request attribute values in endpoint names.
The settings page is not available for environments created in Dynatrace version 1.333+ because Enhanced endpoints is always on.
Naming for HTTP-related endpoints in SDv1
Dynatrace uses the http.route span attribute to generate names for HTTP-related endpoints.
Services that provide http.route—Spring Boot, Express, FastAPI, ASP.NET Core, Django, Flask, and similar frameworks—get descriptive endpoint names automatically. Services that don't emit http.route (NGINX, Apache, IIS, and most reverse proxies and gateways) get a stable name from the automatic naming heuristic, and fall back to generic names like GET /* otherwise. For the general naming mechanism, see Naming for HTTP-related endpoints.
For SDv1 services specifically, existing request naming rules continue to apply to endpoint names. Existing key requests are also preserved—any endpoint you previously configured as a key request keeps its name and appears alongside the automatically detected endpoints. You don't need to create new key requests because every endpoint gets individual metrics automatically.
Automatic naming for services without http.route
Dynatrace SaaS version 1.341+
For services that don't emit an http.route span attribute, Dynatrace derives a fallback route based on the URL path. The derived value is stored as http.route and used in endpoint names. Dynatrace also adds the supportability.is_http_route_derived attribute to mark routes that were derived this way (not received from instrumentation).
Dynatrace derives a fallback route value by scanning the URL path segment by segment and truncating at the first "volatile-looking" segment. Four rules detect volatile segments:
-
Rule 1: Segment contains more than one digit character.
Matching examples:
entry12,2data7.
URL path and derived route:/products/electronics/94827-samsung-galaxy-s24>/products/electronics/ -
Rule 2: Segment is a hex code—all characters in
[0-9a-fA-F]with length ≥ 4. The length threshold prevents matching short words that are valid hex (for example,add).Matching examples:
AEB1,cb3ff,ABCD.
URL path and derived route:/hex/1a3b9f>/hex/ -
Rule 3: Segment contains mixed-case tokens or base64—both upper- and lowercase letters, with 2 or more distinct uppercase clumps (runs of 2 or more consecutive uppercase letters) and a minimum lowercase run of less than 4 characters. This rule catches base64-encoded content and different kinds of tokens, such as authentication or session tokens.
Matching examples:
KoBuRHxSMr,eTTecXY.
URL path and derived route:/checkout/orders/0WcY-R\_uVpWUJbujPPtpAA>/checkout/orders/ -
Rule 4: Segment contains an all-uppercase token—only
[A-Z0-9]with length ≥ 4.Matching examples:
1NEW,SEMP,ROADWORKS.
URL path and derived route:/resource/BAHE4/details>/resource/
If the first segment of the URL path matches one of the rules, the derived route falls back to the /* value, which resembles the previous endpoint naming behavior.
Only the first four segments of the URL path are scanned. If no rules match within those four segments, the full four-segment path becomes the derived http.route. For example, /company/department/unit/team/group results in /company/department/unit/team.
If you activated Enhanced endpoints in Dynatrace SaaS version 1.340 and earlier, automatic naming for services without http.route is not enabled by default. Contact your Dynatrace account team to activate the automatic naming behavior.
If you're activating Enhanced endpoints for the first time in Dynatrace SaaS version 1.341+, the automatic naming for services without http.route is included out of the box.
Volatile and non-volatile placeholders in naming rules
Naming rule placeholders are either non-volatile (stable values like {HTTP-Method}) or volatile (high-cardinality values like {URL}). Dynatrace handles them differently to prevent endpoint explosion.
| Web request services | All other service types | |
|---|---|---|
Non-volatile placeholders only | Placeholders are replaced with actual values.1 | Placeholders are replaced with actual values.2 |
Contains volatile placeholders | Volatile placeholders are kept as is in the endpoint name.2 | Volatile placeholders are kept as is in the endpoint name.2 |
For example, the {HTTP-Method} - {Request:IsKeyRequest} - user authentication endpoint template results in the GET - yes - user authentication endpoint endpoint name. Both {HTTP-Method} and {Request:IsKeyRequest} are replaced with their values, as these are non-volatile placeholder attributes.
For example, the {HTTP-Method} - {URL} - user authentication endpoint template results in the GET - {URL} - user authentication endpoint endpoint name. {HTTP-Method} (non-volatile) is replaced with GET, while {URL} (volatile) is not replaced and is used as is. The volatile placeholder attributes are: {OneAgentAttribute:} (except http.route), {Relative-URL}, {URL:Path}, {URL:Query}, {URL}, and customer-defined patterns based on these.
Include low-cardinality URL path in endpoint names
Dynatrace version 1.339+
When you want endpoint names based on the URL path without a separate endpoint for every unique value, use the {URL:Path-Clean} placeholder. With this placeholder, you get per-path endpoints while keeping cardinality under control.
The {URL:Path-Clean} placeholder works similarly to the {URL:Path} placeholder, except Dynatrace replaces volatile segments—UUIDs, IPv4 and IPv6 addresses, and IBANs—with stable markers before the URL path becomes the endpoint name. It applies the same logic as the Remove UUIDs, IP addresses and IBANs from URLs option available in the request naming settings, plus any custom cleanup rules you've defined.
The following table compares the output of both placeholders.
| URL path | {URL:Path} used | {URL:Path-Clean} used |
|---|---|---|
|
|
|
|
|
|
If a volatile pattern isn't removed automatically, create a custom placeholder with a regex to extract the stable portion of the URL path.
Request attribute values in endpoint names
If your naming rules use the {RequestAttribute:_} placeholder, turn on Resolve request attributes for SDv1 request naming rules to replace the placeholder with actual values. This produces separate endpoints per request attribute value, giving you finer-grained metrics. See Enable Enhanced endpoints for detailed instructions.
| Environment created in | Available in | Default | Configurable? |
|---|---|---|---|
Dynatrace version 1.333+ | Dynatrace version 1.333+ | On | No |
Dynatrace version 1.332 and earlier | Dynatrace version 1.333+ | Off | Yes |
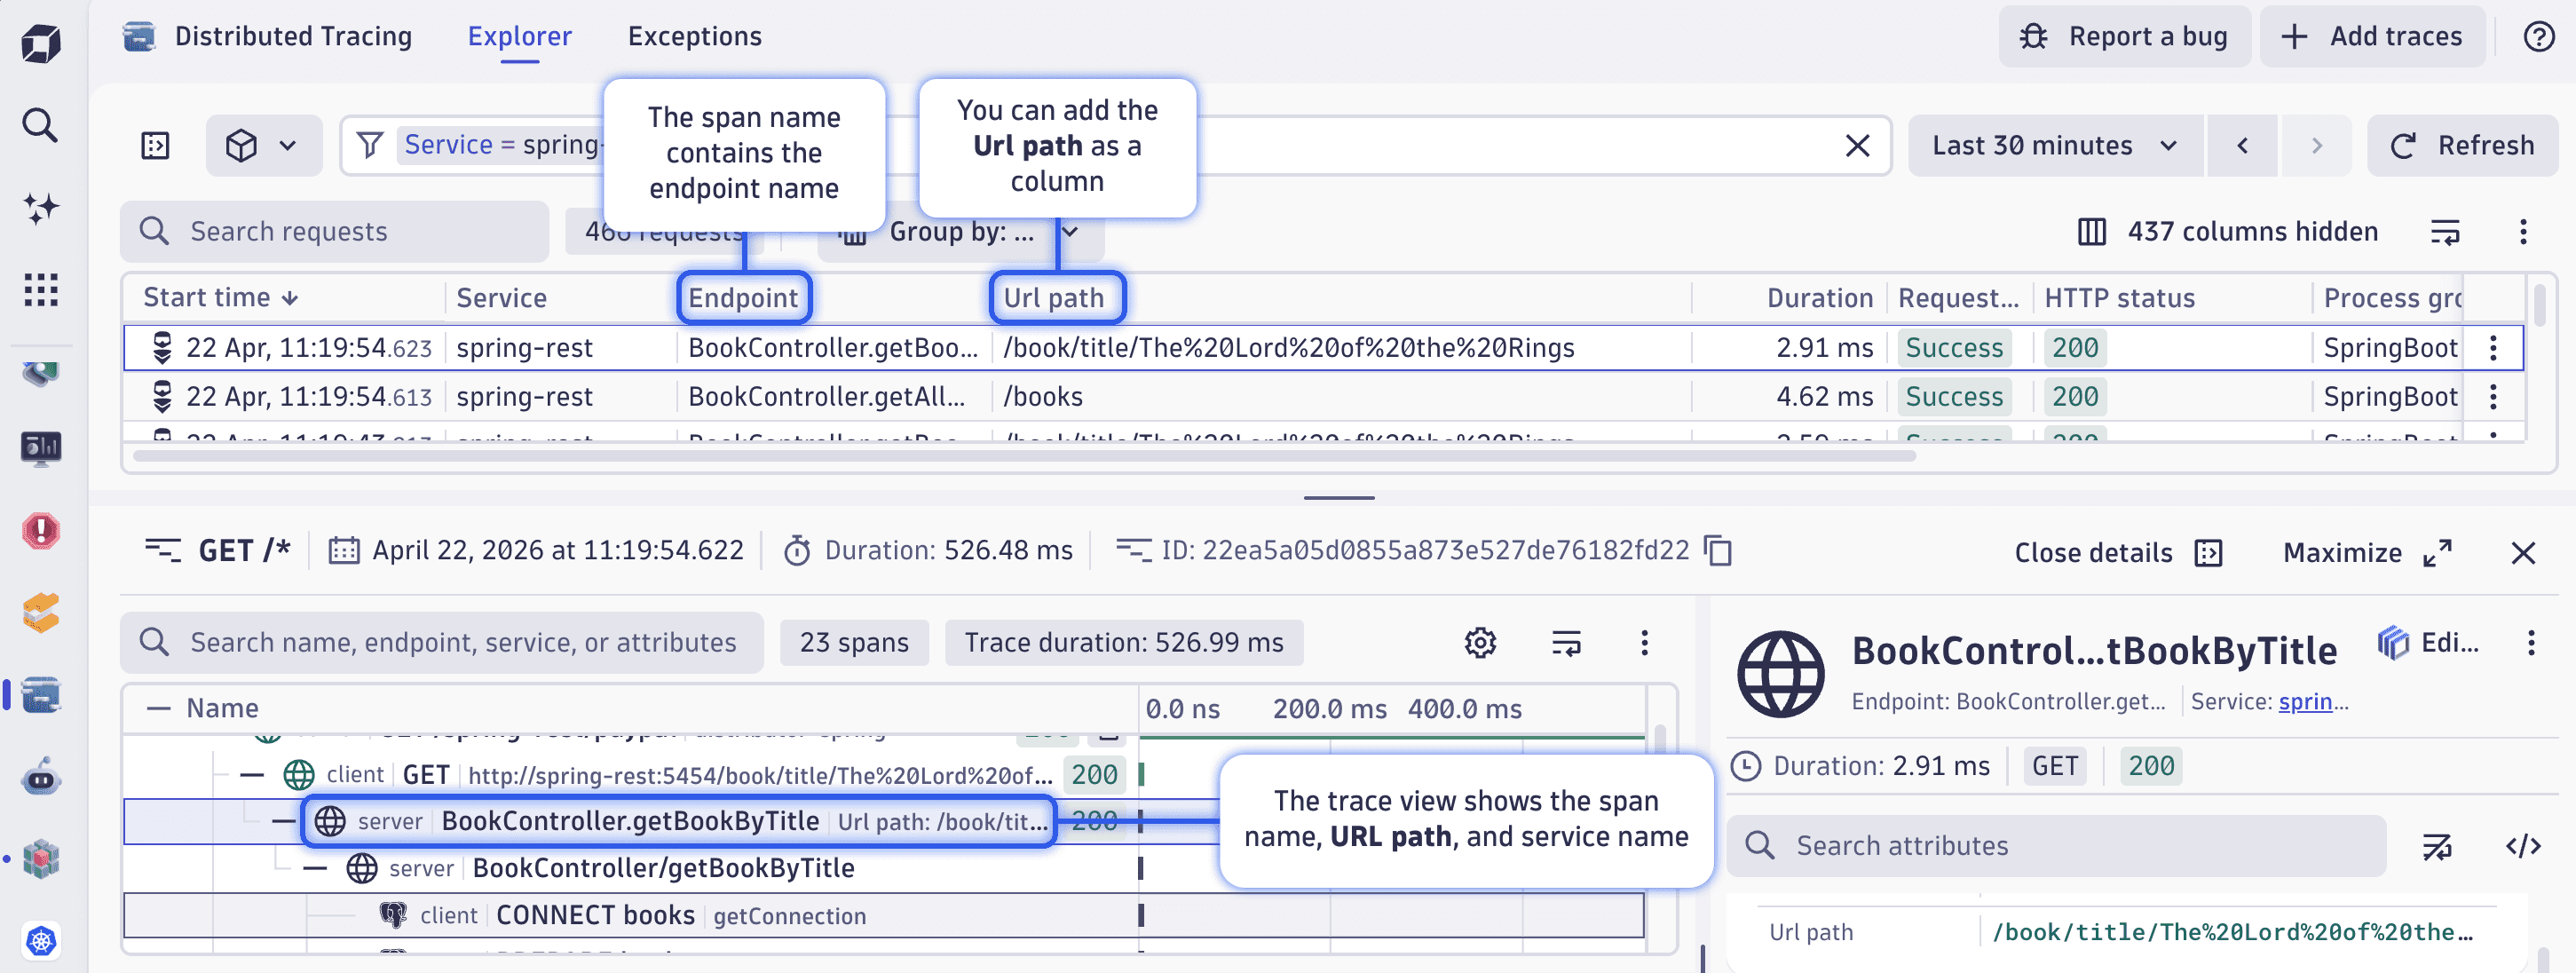
Changes to span names in Distributed Traces
With all web requests now covered by an endpoint, span names in Distributed Tracing show the endpoint name rather than the URL path.
- Trace list: To see the full URL path alongside the endpoint name, add a Url path column.
- Single-trace view: The URL path and service name appear alongside the span name, as shown below.
Enabling Enhanced endpoints doesn't change a service's total load—it changes how that load is distributed across endpoints. When a generic endpoint splits into specific endpoints, the same requests are distributed across them. For example, a service that previously reported all traffic under GET /* (100%) might now report GET /shop/products/{id} (50%) and GET /shop/cart (50%). The combined throughput is identical; only the per-endpoint breakdown changes. If a service appears to lose traffic after you activate Enhanced endpoints, check the per-endpoint breakdown (the load has moved to more specific endpoints, not disappeared).
Fine-tune endpoint names
Services that use generic endpoint names like GET /* group all traffic under a single endpoint, which limits your ability to set targeted SLOs, alerts, and dashboard filters. To get per-endpoint visibility for these services, identify which services need attention and then create request naming rules to produce specific endpoint names.
Identify services with generic endpoint names using DQL
Run this query in Notebooks to find services that lack http.route and see how many distinct URL paths each one handles:
fetch spans| filter isNull(`http.route`)and request.is_root_span == trueand isNotNull(`http.request.method`)| summarize urls_without_http_route = countDistinct(url.path), by: {dt.entity.service, dt.service.name}| sort urls_without_http_route desc| limit 1000
Example results:
dt.entity.service | dt.service.name | urls_without_http_route |
|---|---|---|
SERVICE-03694216F69B651D | :6767 | 607 |
SERVICE-A4365F245D125CDF | go-gorilla-mux | 606 |
SERVICE-352C0D90592C8454 | frontend-proxy | 36 |
Each row shows a service and how many distinct URL paths are grouped under generic endpoints. Services with high counts are good candidates for request naming rules.
To see the actual URLs for a specific service, copy its service ID from the results and run this follow-up query (replace SERVICE-XXXXXXXXXXXXXXXX with the service ID):
fetch spans| filter isNull(`http.route`)and request.is_root_span == trueand isNotNull(`http.request.method`)and dt.entity.service == "SERVICE-XXXXXXXXXXXXXXXX"| summarize request_count = count(), by: {http.request.method, url.path}| sort request_count desc| limit 100
Example results:
http.request.method | url.path | request_count |
|---|---|---|
GET | /books | 605 |
POST | /books | 602 |
The results show you the individual URL paths and HTTP methods, helping you decide what request naming rules to create.
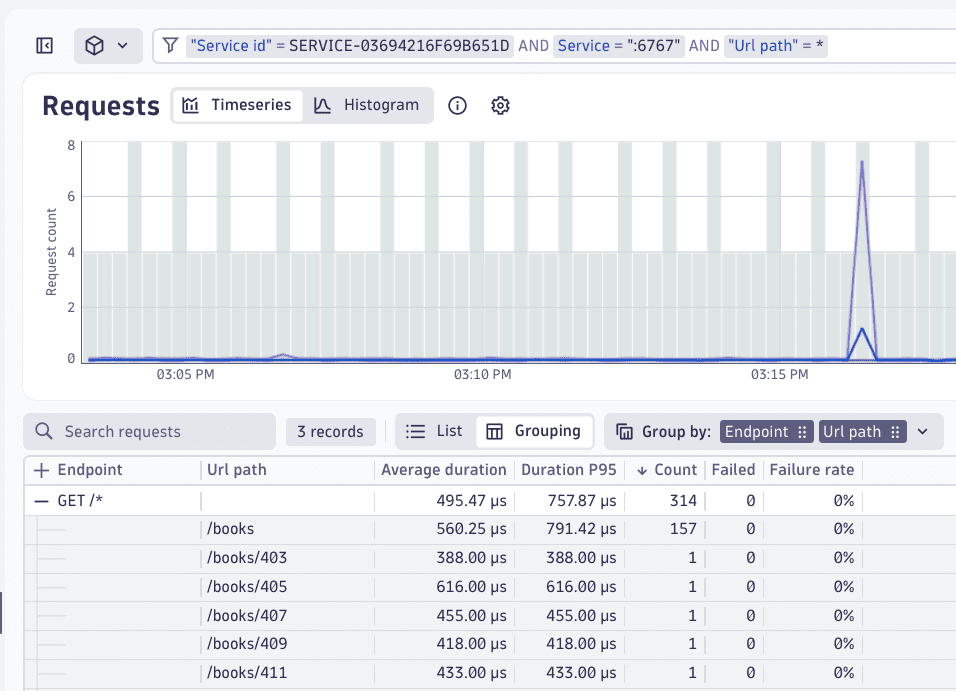
Find URL paths for a specific service in the Services app
- Go to Services > Explorer and select your service.
- In the Endpoints section, select the
GET /*endpoint. - Select View all URLs to open Distributed Tracing with URL paths visible.
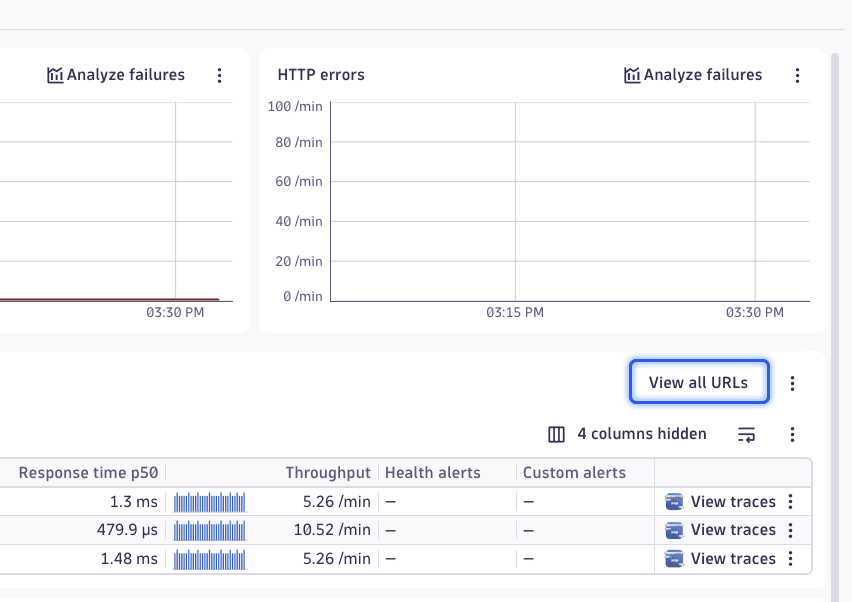
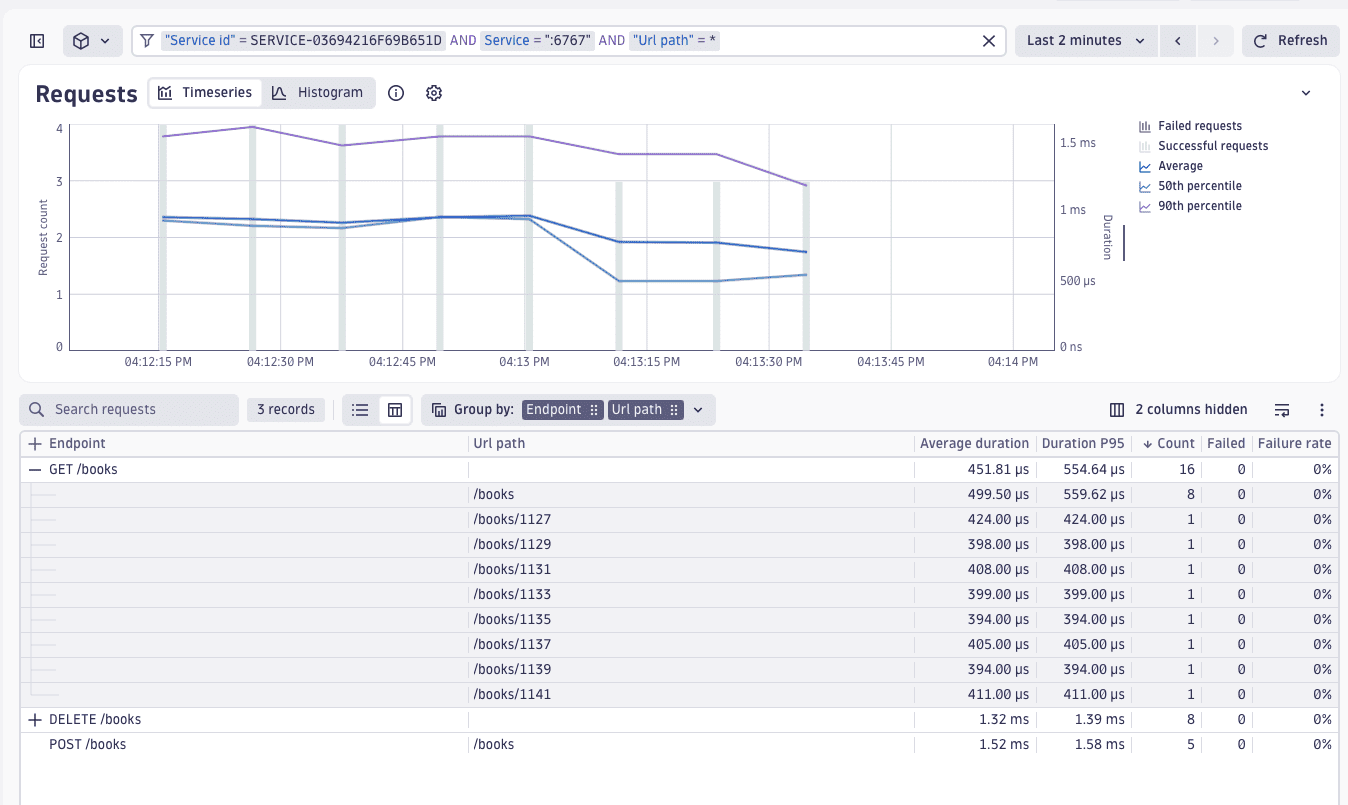
The results show you the actual traffic patterns. For example, you might see /books, /books/403, /books/405, and other paths grouped under a single GET /* endpoint. These distinct URL paths are good candidates for a request naming rule.
Create a request naming rule
Create request naming rules to define specific endpoint names based on URL conditions. Request naming rules are configured per service—your existing per-service naming rules continue to apply when Enhanced endpoints is active. For example, if your service handles /books/* requests, you can create a rule that produces GET /books, POST /books, and DELETE /books endpoints instead of a single GET /*.
-
Go to
Services and select the service you want to configure. -
In the Endpoints section header, select (Actions menu) > Configure request naming.
Alternatively, select (Actions menu) > Settings in the upper-right corner, then go to Request naming or Web request naming.
-
Select Add rule.
-
Define a naming pattern using placeholders. For example,
{HTTP-Method} /bookscaptures the HTTP method and uses a fixed path segment. -
Set conditions to match the target URLs. For example, URL path begins with
/books.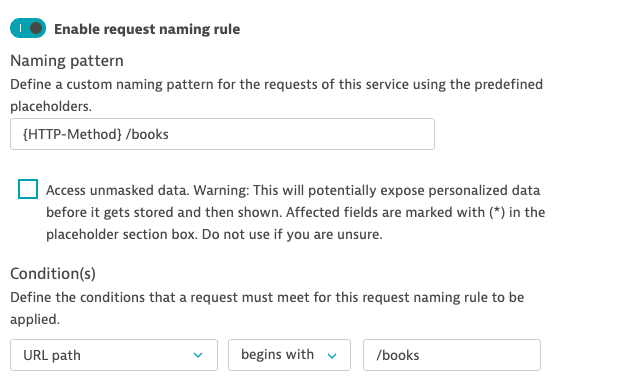 Request naming rule configuration with the pattern {HTTP-Method} /books and a condition for URL path begins with /books
To get stable endpoint names, use non-volatile placeholders (like {HTTP-Method}) combined with fixed path segments. This produces a small, predictable set of endpoint names. Avoid volatile placeholders like {URL} or {URL:Path} in naming patterns, as they contain high-cardinality values (order IDs, session tokens, or GUIDs) that create a new endpoint for every unique URL, which defeats the purpose of grouping.
When you want to include the URL path in endpoint names, use the {URL:Path-Clean} placeholder instead of {URL:Path}.
More examples: Extract stable endpoint names from URLs
API with versioned paths: If your service handles /api/v1/users/123, /api/v1/users/456, /api/v2/orders/789, you can create rules to group by resource type:
- Pattern:
{HTTP-Method} /api/v1/users
Condition: URL path begins with/api/v1/users - Pattern:
{HTTP-Method} /api/v2/orders
Condition: URL path begins with/api/v2/orders
This produces endpoints like GET /api/v1/users and POST /api/v2/orders instead of a unique endpoint per user or order ID.
Multiple path segments: If your service has /checkout/cart, /checkout/payment, and /checkout/confirmation, a single rule handles all three:
- Pattern:
{HTTP-Method} /checkout
Condition: URL path begins with/checkout
As an alternative, if you want separate endpoints per checkout step, create one rule per path.
Using the View all URLs workflow: The most effective approach is to first find the actual URL paths your service handles, then create rules that match the patterns you see. The URLs in Distributed Tracing results show you what to group.
View your new endpoints
After the naming rule takes effect, you should see specific endpoints that match your rule. Each endpoint has its own metrics for response time, throughput, and failure rate.
With specific endpoints in place, you can use them in dashboards, SLOs, and alerting as described in Use endpoints and metrics.
Manage endpoint cardinality
After configuring request naming rules, use the Endpoint Cardinality Dashboard to monitor how many endpoints each service produces and identify where you may need to tune your rules.
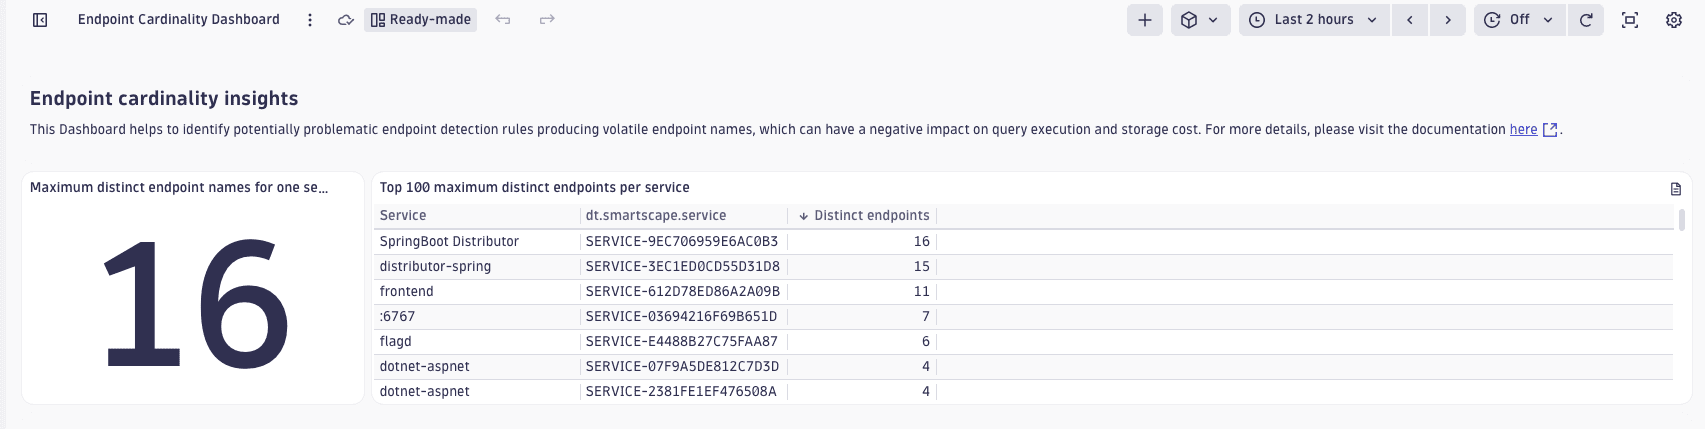
The dashboard shows the maximum distinct endpoint names across all services and ranks services by their endpoint count. If a service produces an unexpectedly high number of endpoints, review its request naming rules to ensure volatile placeholders aren't creating excessive cardinality.
The Endpoint Cardinality Dashboard ranks your services by endpoint count, helping you identify where to adjust naming or detection rules to control cardinality.
To view services with the most endpoints
- Go to Dashboards.
- In the Dashboards panel on the left, select All dashboards.
- In Search by name, enter Endpoint Cardinality Dashboard.
- Select the dashboard to open it.
To display additional endpoint-heavy services, duplicate this dashboard and edit the DQL query behind the service list (for example, change 100 in limit 100 to the required value). Alternatively, you can add this query to Notebooks and modify it there.
If high-cardinality request attributes produce an excessive number of endpoints, turn off Resolve request attributes for SDv1 request naming rules to reduce endpoint volume. See Enable Enhanced endpoints for detailed instructions.
Static resource requests
When the Enhanced endpoints feature is active, static resource requests (Image, Binary, CSS, and JavaScript) are unmuted and grouped into a single Static resources endpoint with the same metrics as other endpoints.
To mute static resource requests, follow the steps in Mute monitoring of service requests. After muting, the Static resources endpoint no longer appears in the endpoint list, and these requests don't count toward overall service metrics.
Whether static resources are muted or not, you can always use Distributed Tracing to view and analyze spans for CSS, images, or binary requests.
You can add or edit filename extensions that count toward the Static resources endpoint. For details, see Configure resource request detection. Existing resource request detection configuration still applies.
Licensing considerations
The Enhanced endpoints for SDv1 feature collects per-endpoint metrics individually rather than aggregating non-key-request endpoints into a single NON_KEY_REQUEST entry. The additional metric volume is typically within the included allowance for Full-Stack Monitoring.
 Services