Understand and manage Kubernetes Platform Monitoring consumption (DPS)
- Latest Dynatrace
- Explanation
- 5-min read
Kubernetes Platform Monitoring is a DPS capability that provides platform visibility into Kubernetes clusters, nodes, namespaces, workloads, pods, and containers.
This page explains how Kubernetes Platform Monitoring consumption is calculated, how to track your usage, and how to optimize your spend.
How consumption is calculated
Kubernetes Platform Monitoring consumption is measured in pod-hours, using the Kubernetes Platform Monitoring rate card item.
OneAgent version 1.301+ When Kubernetes Platform Monitoring is run in combination with host-based Full-Stack Monitoring, pod-hour consumption for all pods running on Full-Stack monitored hosts is included with host-based Full-Stack Monitoring at no additional charge.
Pods on non-Full-Stack hosts, as well as pods stuck in Pending, still contribute to your consumption of pod-hours, as described on this page.
Key terms
- Pod
The smallest deployable unit in Kubernetes. Each running pod is the unit that generates pod-hour consumption.
- Pod-hour
The unit of measure for Kubernetes Platform Monitoring. One pod-hour represents one hour of monitoring for a single pod. Consumption is independent of pod memory size, CPU allocation, or number of containers in the pod.
What's included in a pod-hour
-
Each pod-hour of Kubernetes Platform Monitoring includes:
-
Metrics: A comprehensive set of resource and health metrics for clusters, namespaces, pods, containers, and nodes.
-
Events: Kubernetes warning events are included under fair use1.
-
-
A pod-hour does not include Kubernetes info events, Prometheus metrics, Istio metrics, or any other custom metrics in Kubernetes.
Fair use means usage that aligns with typical customer patterns, your contracted consumption, and the feature's intended purpose. As a guideline, this means 60 events per pod-hour (pooled across all pods, measured in 15-minute intervals). If your usage materially exceeds fair use, Dynatrace may notify you and subsequently apply charges at the applicable Events powered by Grail rate.
Counting rules and billing granularity
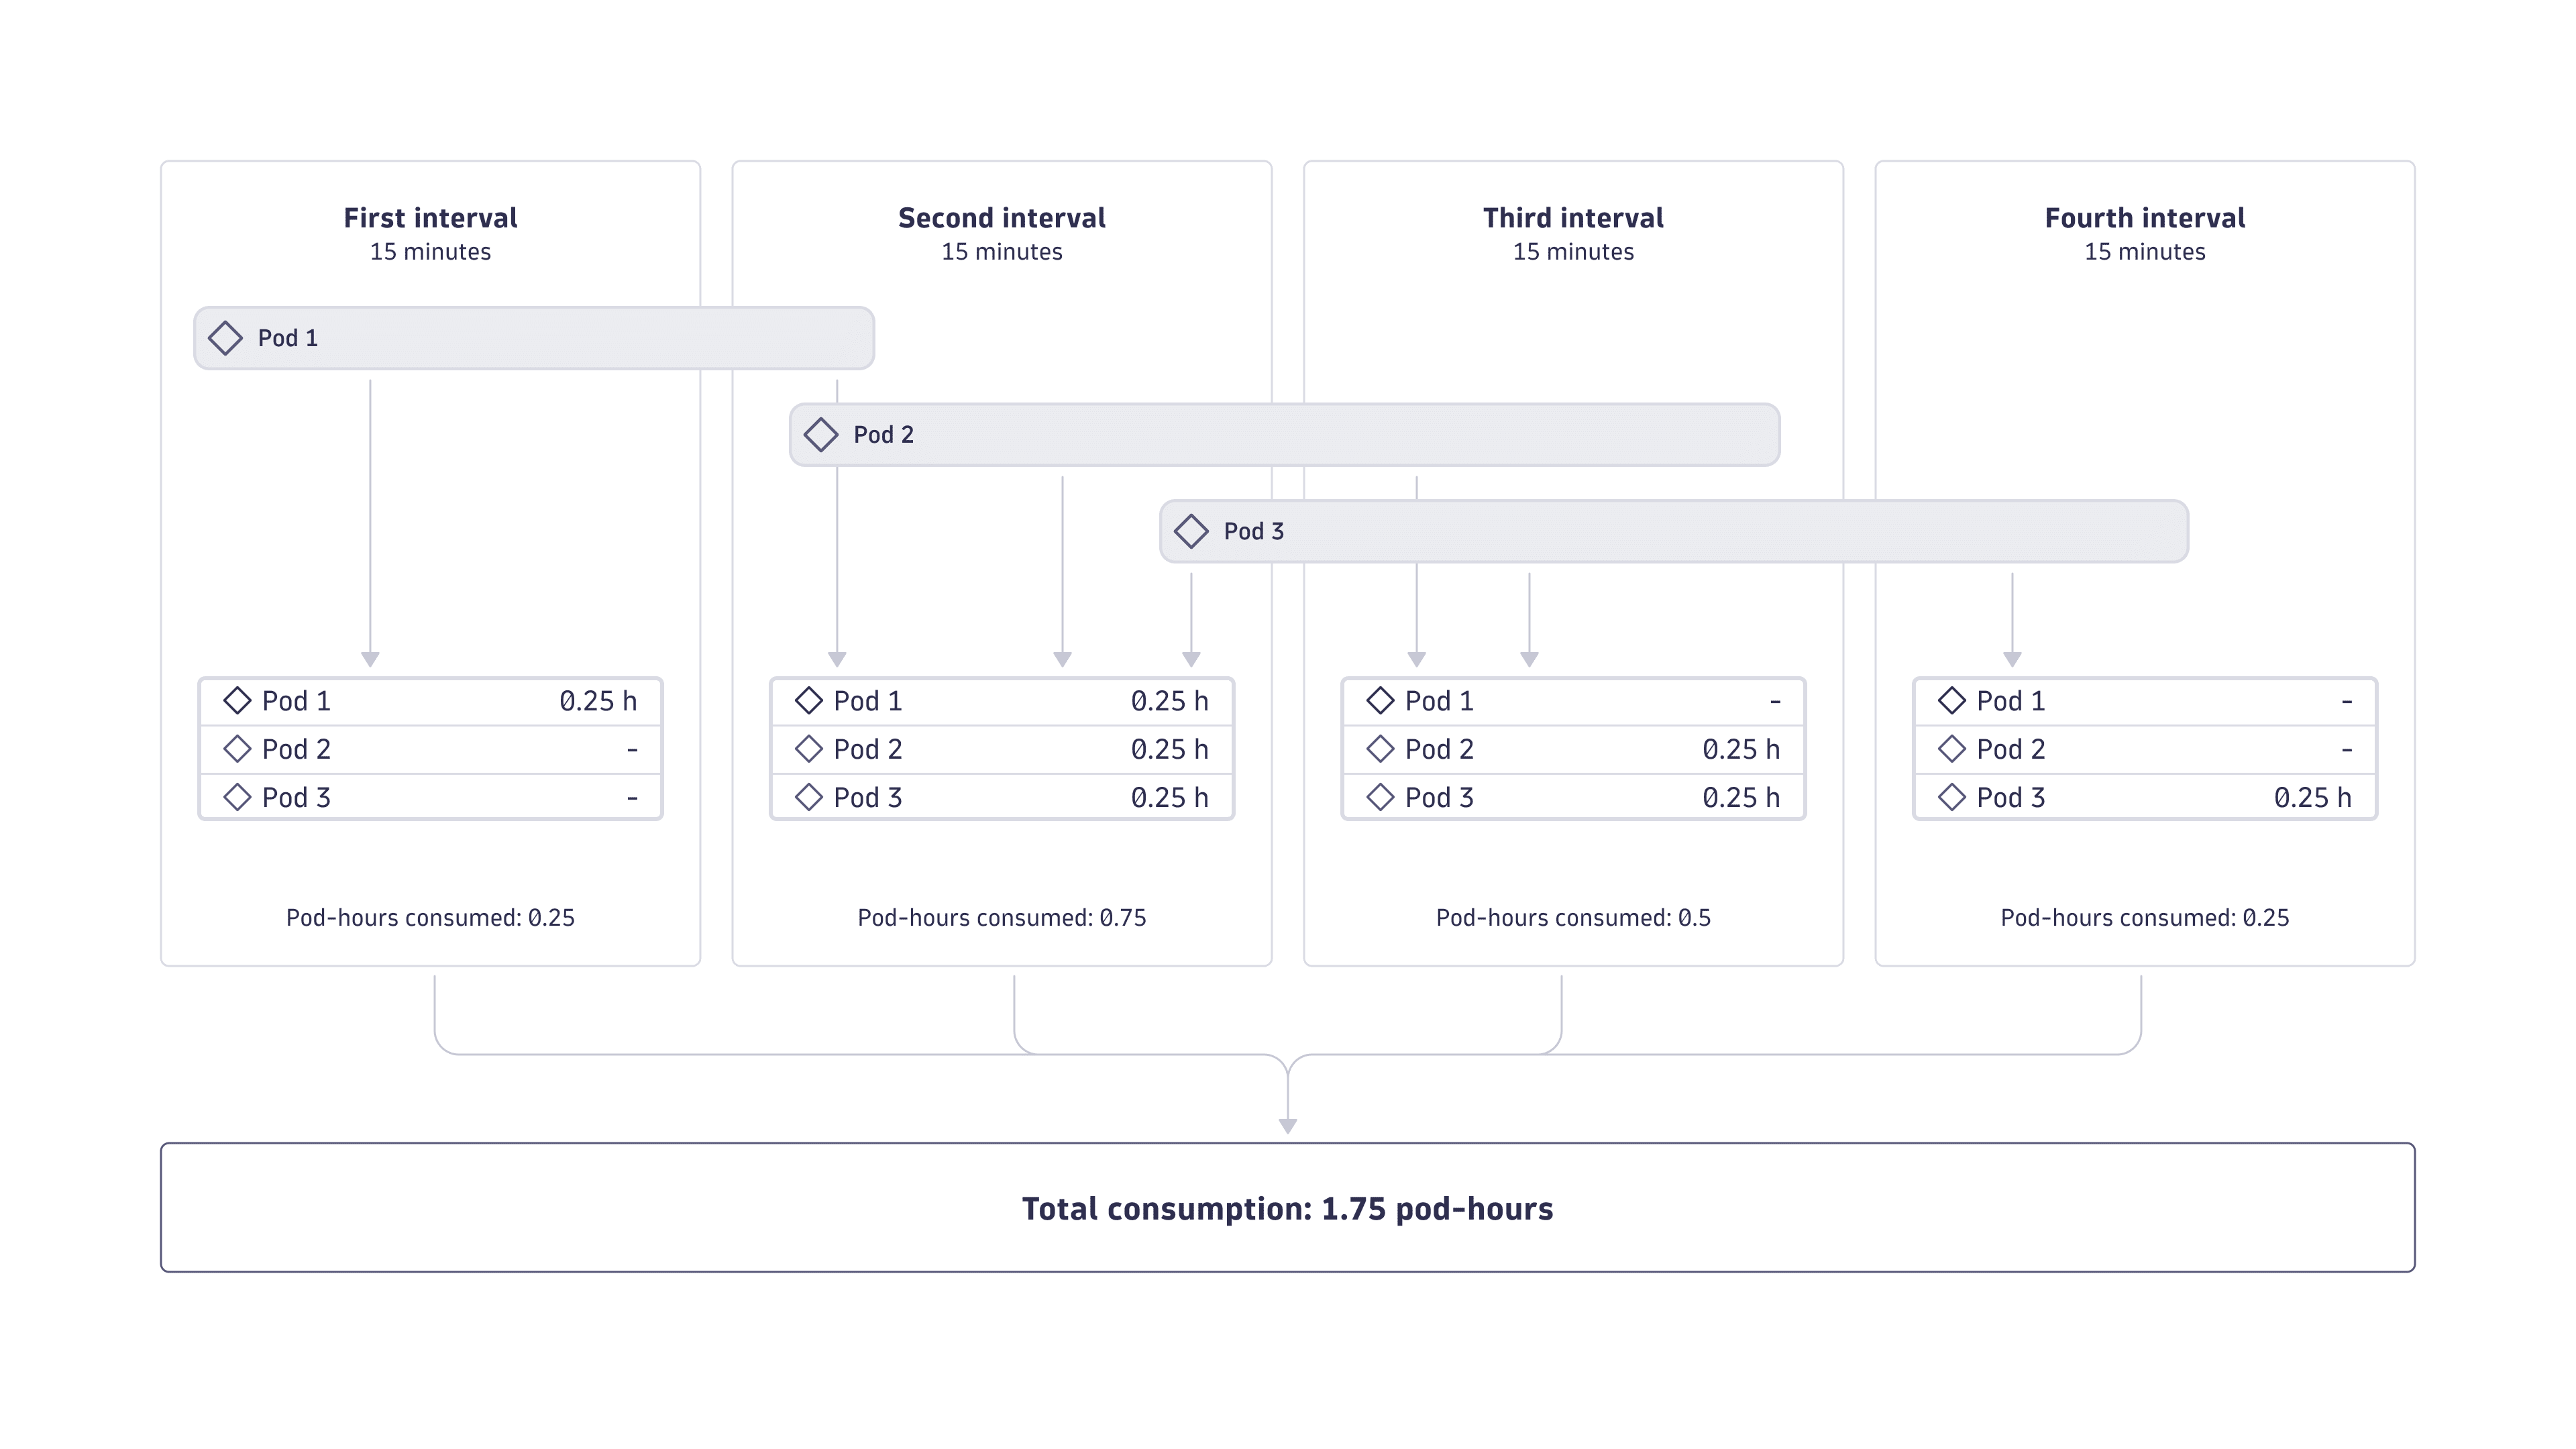
Each pod that is actively monitored generates one pod-hour of consumption per hour. Consumption begins when a pod starts being monitored and stops when it terminates or monitoring ends.
Dynatrace is built for elastic cloud-native environments where services are often short-lived, which is the case for pods running in Kubernetes environments. Therefore, billing granularity for pod-hour consumption is calculated in 15-minute intervals. If a pod is monitored for fewer than 15 minutes in a given interval, its consumption is rounded up to 15 minutes.
Estimate your cost
The following example demonstrates how costs are calculated for Kubernetes Platform Monitoring.
-
Calculations are based on the following list prices (which may differ from your rate card prices):
- Kubernetes Platform Monitoring: $0.002 per pod-hour.
- All costs are in USD.
-
One month is equivalent to 30 days, 24 hours per day.
-
500 pods are running continuously.
-
500 pods × 24 hours × 30 days = 360,000 pod-hours per month
-
360,000 pod-hours × $0.002 = $720 per month
Understand and manage your consumption
Dynatrace provides several ways to monitor and analyze your Kubernetes Platform Monitoring consumption.
Insights via Account Management
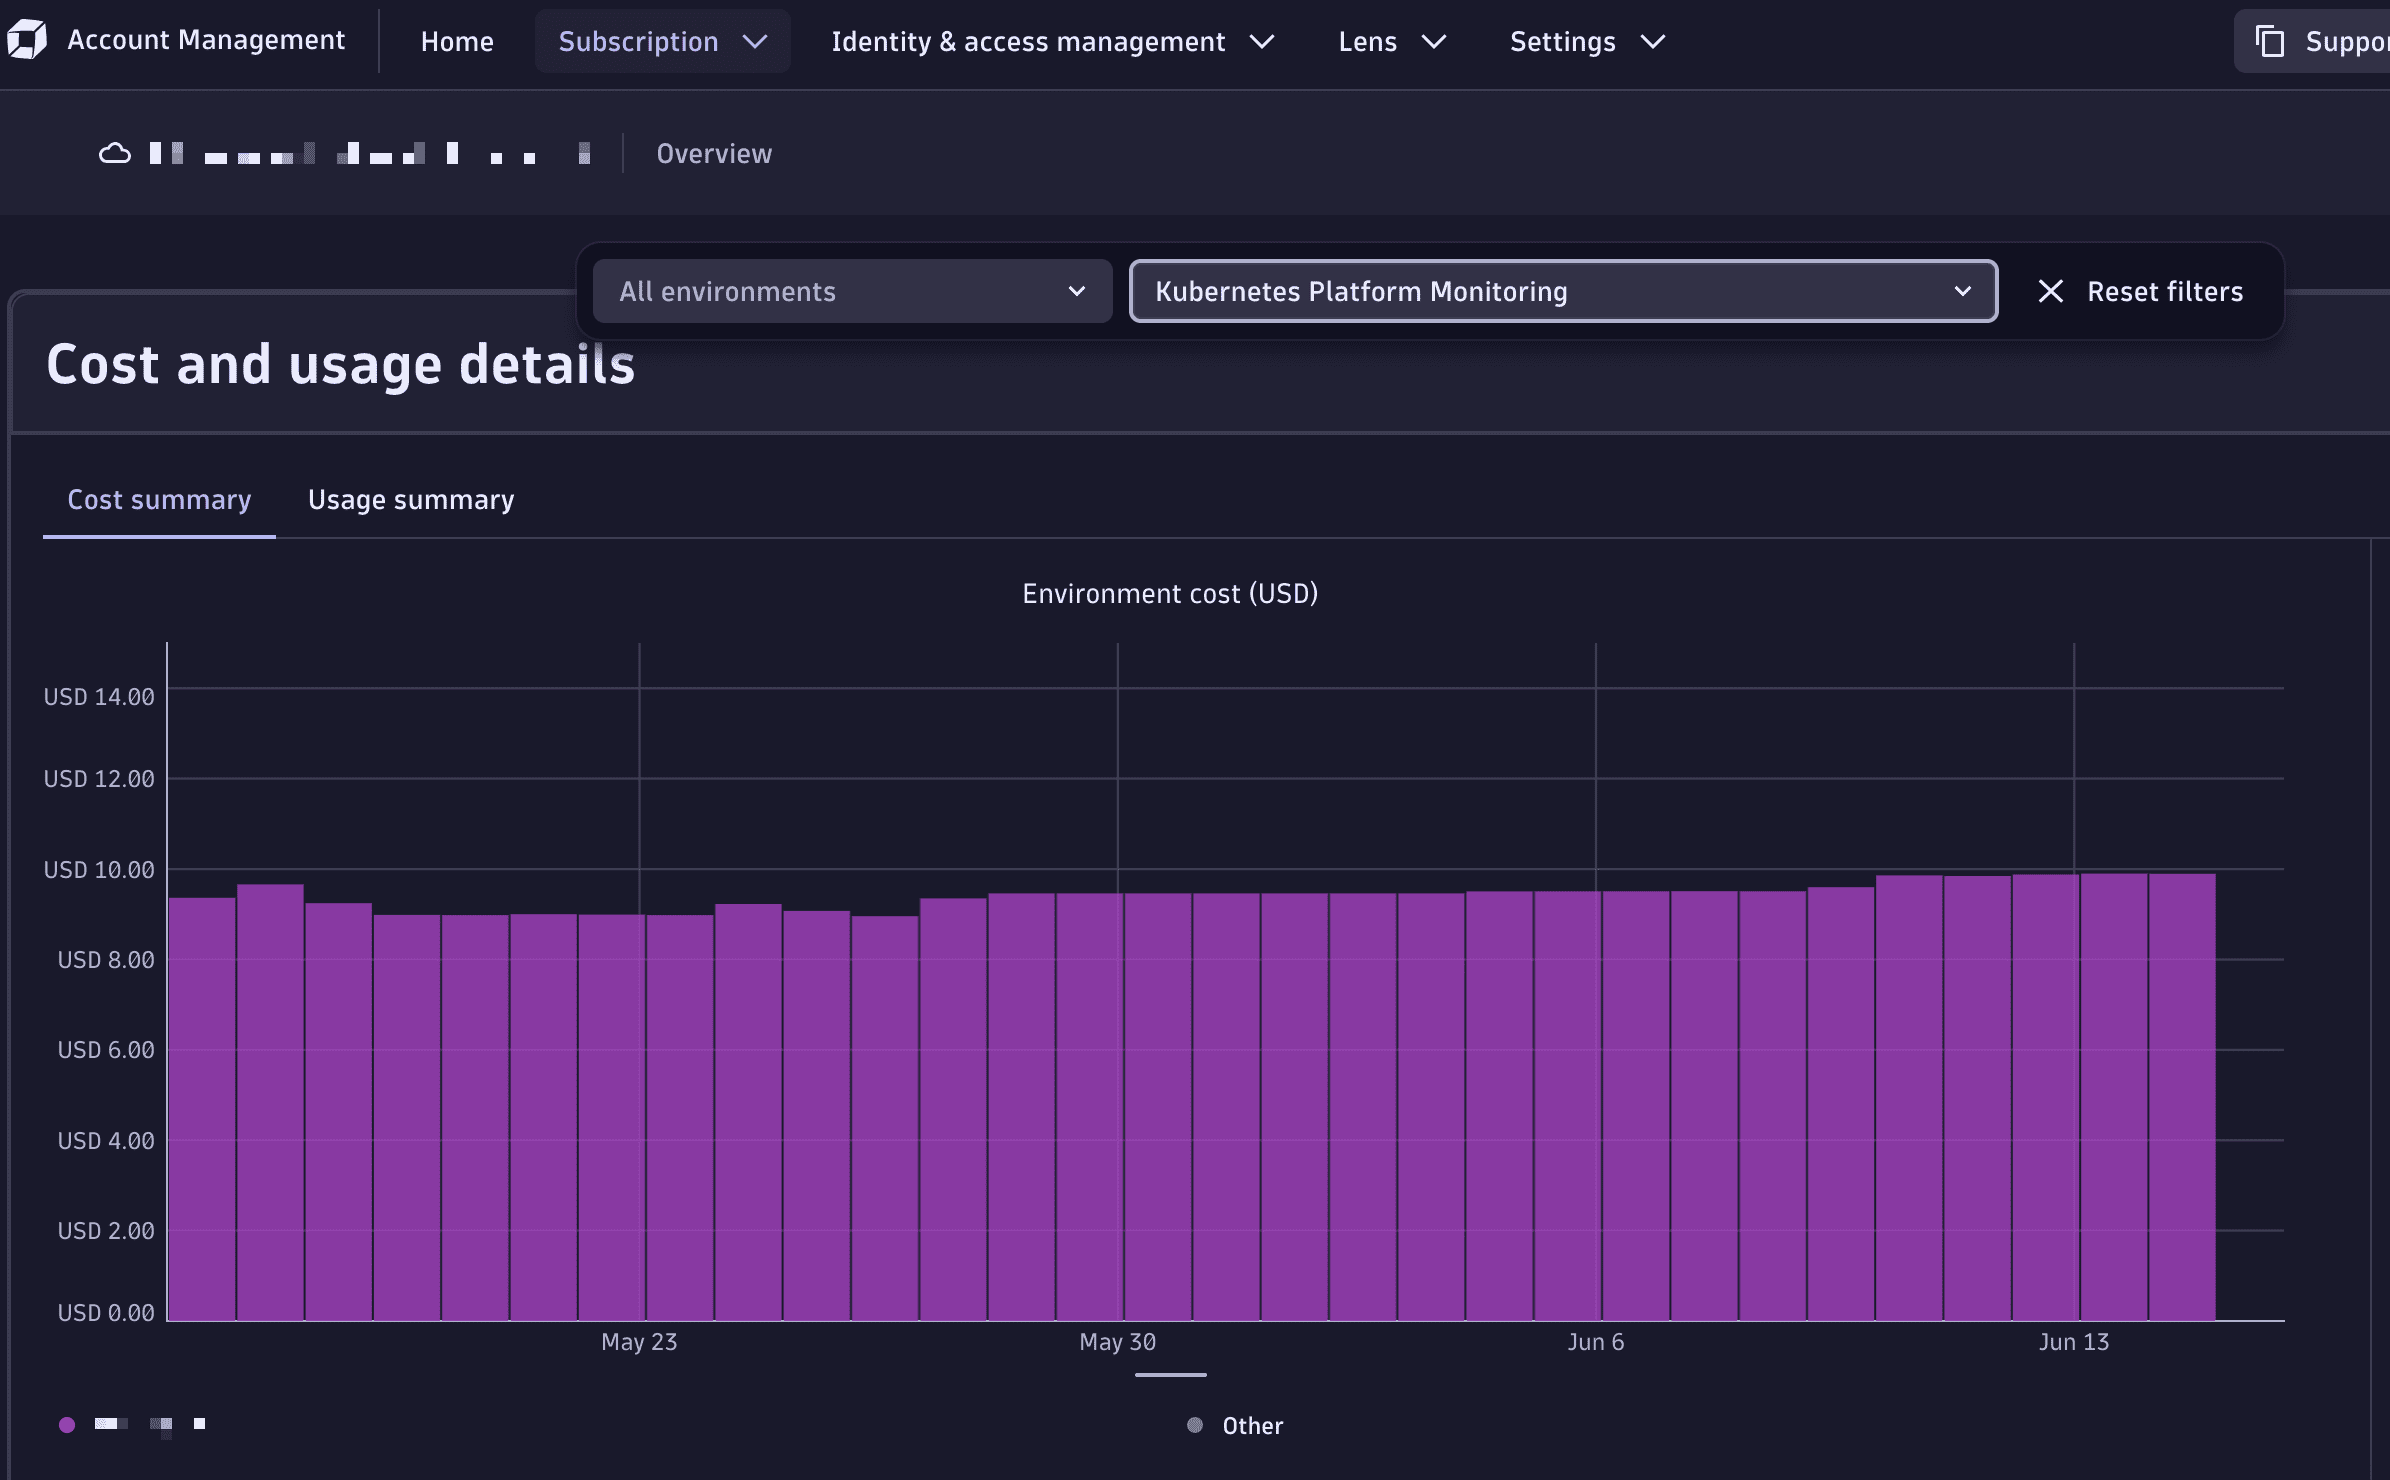
License managers can view usage and costs in Account Management.
-
Go to Account Management > Subscription > Overview > Cost and usage details > Usage summary.
-
Select Kubernetes Platform Monitoring > View details.
-
From this screen, you can also drill down into usage detail on the capability and environment level.
- Capability level: Select View Details next to the capability you want to explore.
- Environment level: In the Environments table, select … > Open details with Notebooks.
For more information, see Overview (Dynatrace Platform Subscription).
Insights via billing usage events
Billing usage events (billing_usage_event) are system events emitted by Dynatrace that represent the authoritative record of billable usage.
Use them to build reliable cost dashboards and chargeback reports by namespace or cluster.
Each billing usage event for Kubernetes Platform Monitoring contains:
- The DPS capability consumed (Kubernetes Platform Monitoring).
- The usage amount in pod-hours that contributes to billing.
- The time window the usage belongs to.
- The entity context (Kubernetes cluster and namespace).
Query billing usage events with DQL
-
Total Kubernetes Platform Monitoring usage over time:
fetch dt.system.events| filter event.kind == "BILLING_USAGE_EVENT" and event.type == "Kubernetes Platform Monitoring"| dedup event.id| summarize totalUsage = sum(billed_pod_hours), by:{bin(timestamp, 1d)} -
Total usage per cluster, excepting clusters with zero usage, over time:
fetch dt.system.events| filter event.kind == "BILLING_USAGE_EVENT"and event.type == "Kubernetes Platform Monitoring"| dedup event.id| summarize totalUsage = sum(billed_pod_hours),by: {day = bin(timestamp, 24h),dt.entity.kubernetes_cluster}| filter totalUsage > 0 -
Total usage per cluster and namespace:
fetch dt.system.events| filter event.kind == "BILLING_USAGE_EVENT" and event.type == "Kubernetes Platform Monitoring"| dedup event.id| fieldsAdd cluster = entityAttr(dt.entity.kubernetes_cluster, "entity.name")| fieldsAdd namespace = entityAttr(dt.entity.cloud_application_namespace, "entity.name")| makeTimeseries usage = sum(billed_pod_hours), by:{cluster, namespace}, interval: 24h, time: usage.start| sort usage DESC
Insights via API
Query Kubernetes Platform Monitoring consumption programmatically via the Account Management API for integration with external reporting systems.
Insights via Dynatrace Assist
Use Dynatrace Assist to surface usage trends for your Kubernetes environment. For example:
- "Which Kubernetes namespaces are consuming the most pod-hours this month?"
- "How has my pod-hour consumption changed compared to last month?"
Frequently asked questions
Is it possible to monitor just parts of a cluster?
No. The whole cluster is monitored with Kubernetes Platform Monitoring.
Can I combine Kubernetes Platform Monitoring with other rate-card items?
Yes. Kubernetes Platform Monitoring can be combined with any other rate-card item, such as:
- Container-based application-only Full-Stack Monitoring (for application insights).
- Code Monitoring (for Live Debugging and developer insights).
- Log Analytics.
- Real User and Synthetic Monitoring.
- Application Security.
Which Dynatrace components does Kubernetes Platform Monitoring require?
Kubernetes Platform Monitoring requires:
- A Dynatrace Platform Subscription (DPS) license.
- A SaaS deployment.
- Dynatrace ActiveGate, which monitors the Kubernetes APIs. It is typically rolled out and managed by Dynatrace Operator.
What if I want to use a pure OpenTelemetry setup?
With pure OpenTelemetry setups, no pod-hours are consumed. However, Metrics powered by Grail and Events powered by Grail charges apply for the observed Kubernetes environments.
Is pod-hour consumption affected by pod memory size or CPU?
No. A pod-hour is independent of the pod's memory size, CPU requests, or resource limits. Each monitored pod contributes one pod-hour per hour, regardless of its size.
For each hour of monitoring, a single monitored pod contributes one pod-hour per hour regardless of its size. Billing is calculated in 15-minute intervals, for more information see Counting rules and billing granularity.
Are pods on Full-Stack monitored hosts billed separately?
Not for pods running on Full-Stack monitored hosts with OneAgent version 1.301+. With that version, pod-hour consumption for all pods on Full-Stack monitored hosts is included with Full-Stack Monitoring.
Pods on non-Full-Stack hosts, and pods stuck in Pending, are still billed as pod-hours under Kubernetes Platform Monitoring as described on this page.
How do I attribute Kubernetes usage to specific teams or applications?
Although Cost Allocation is not natively supported on Kubernetes Platform Monitoring usage, you can allocate usage related to Kubernetes Platform Monitoring.
To attribute Kubernetes Platform Monitoring costs to specific teams or applications:
-
Latest Dynatrace Use Billing Usage Events (BUEs) as described in Insights via billing usage events.
-
Dynatrace Classic: The
builtin:billing.kubernetes_monitoring.usagemetric is dimensioned by Kubernetes cluster and namespace, making it straightforward to attribute costs.
For more information, see Set up Cost Allocation.