Understand and manage Infrastructure Monitoring consumption (DPS)
- Latest Dynatrace
- Explanation
- 1-min read
Dynatrace Infrastructure Monitoring is a OneAgent monitoring mode that provides comprehensive host-level observability for physical and virtual machines. This page explains how Infrastructure Monitoring consumption is calculated, how to track and analyze your usage, and how to optimize your spend.
In addition to all features of Foundation & Discovery, Infrastructure Monitoring also includes detailed process performance metrics, disk performance metrics, process-to-process network analysis, and per process memory analysis. Dynatrace Extensions can be enabled on hosts with Infrastructure Monitoring mode and may consume custom metric data points and Log Analytics.
How consumption is calculated
Infrastructure Monitoring consumption is measured in host hours, using the Infrastructure Monitoring rate card item.
Key terms
- Host
An operating system instance (physical or virtual machine) on which Dynatrace OneAgent is installed and running.
- Metric data point
A single measurement value stored in Dynatrace that belongs to a metric identified by a metric key and has a timestamp.
Counting rules and exceptions
A host hour represents one hour of active monitoring for a single host.
Consumption is independent of the host's memory size. Each monitored host contributes one host hour per hour regardless of how much RAM it has.
Billing granularity
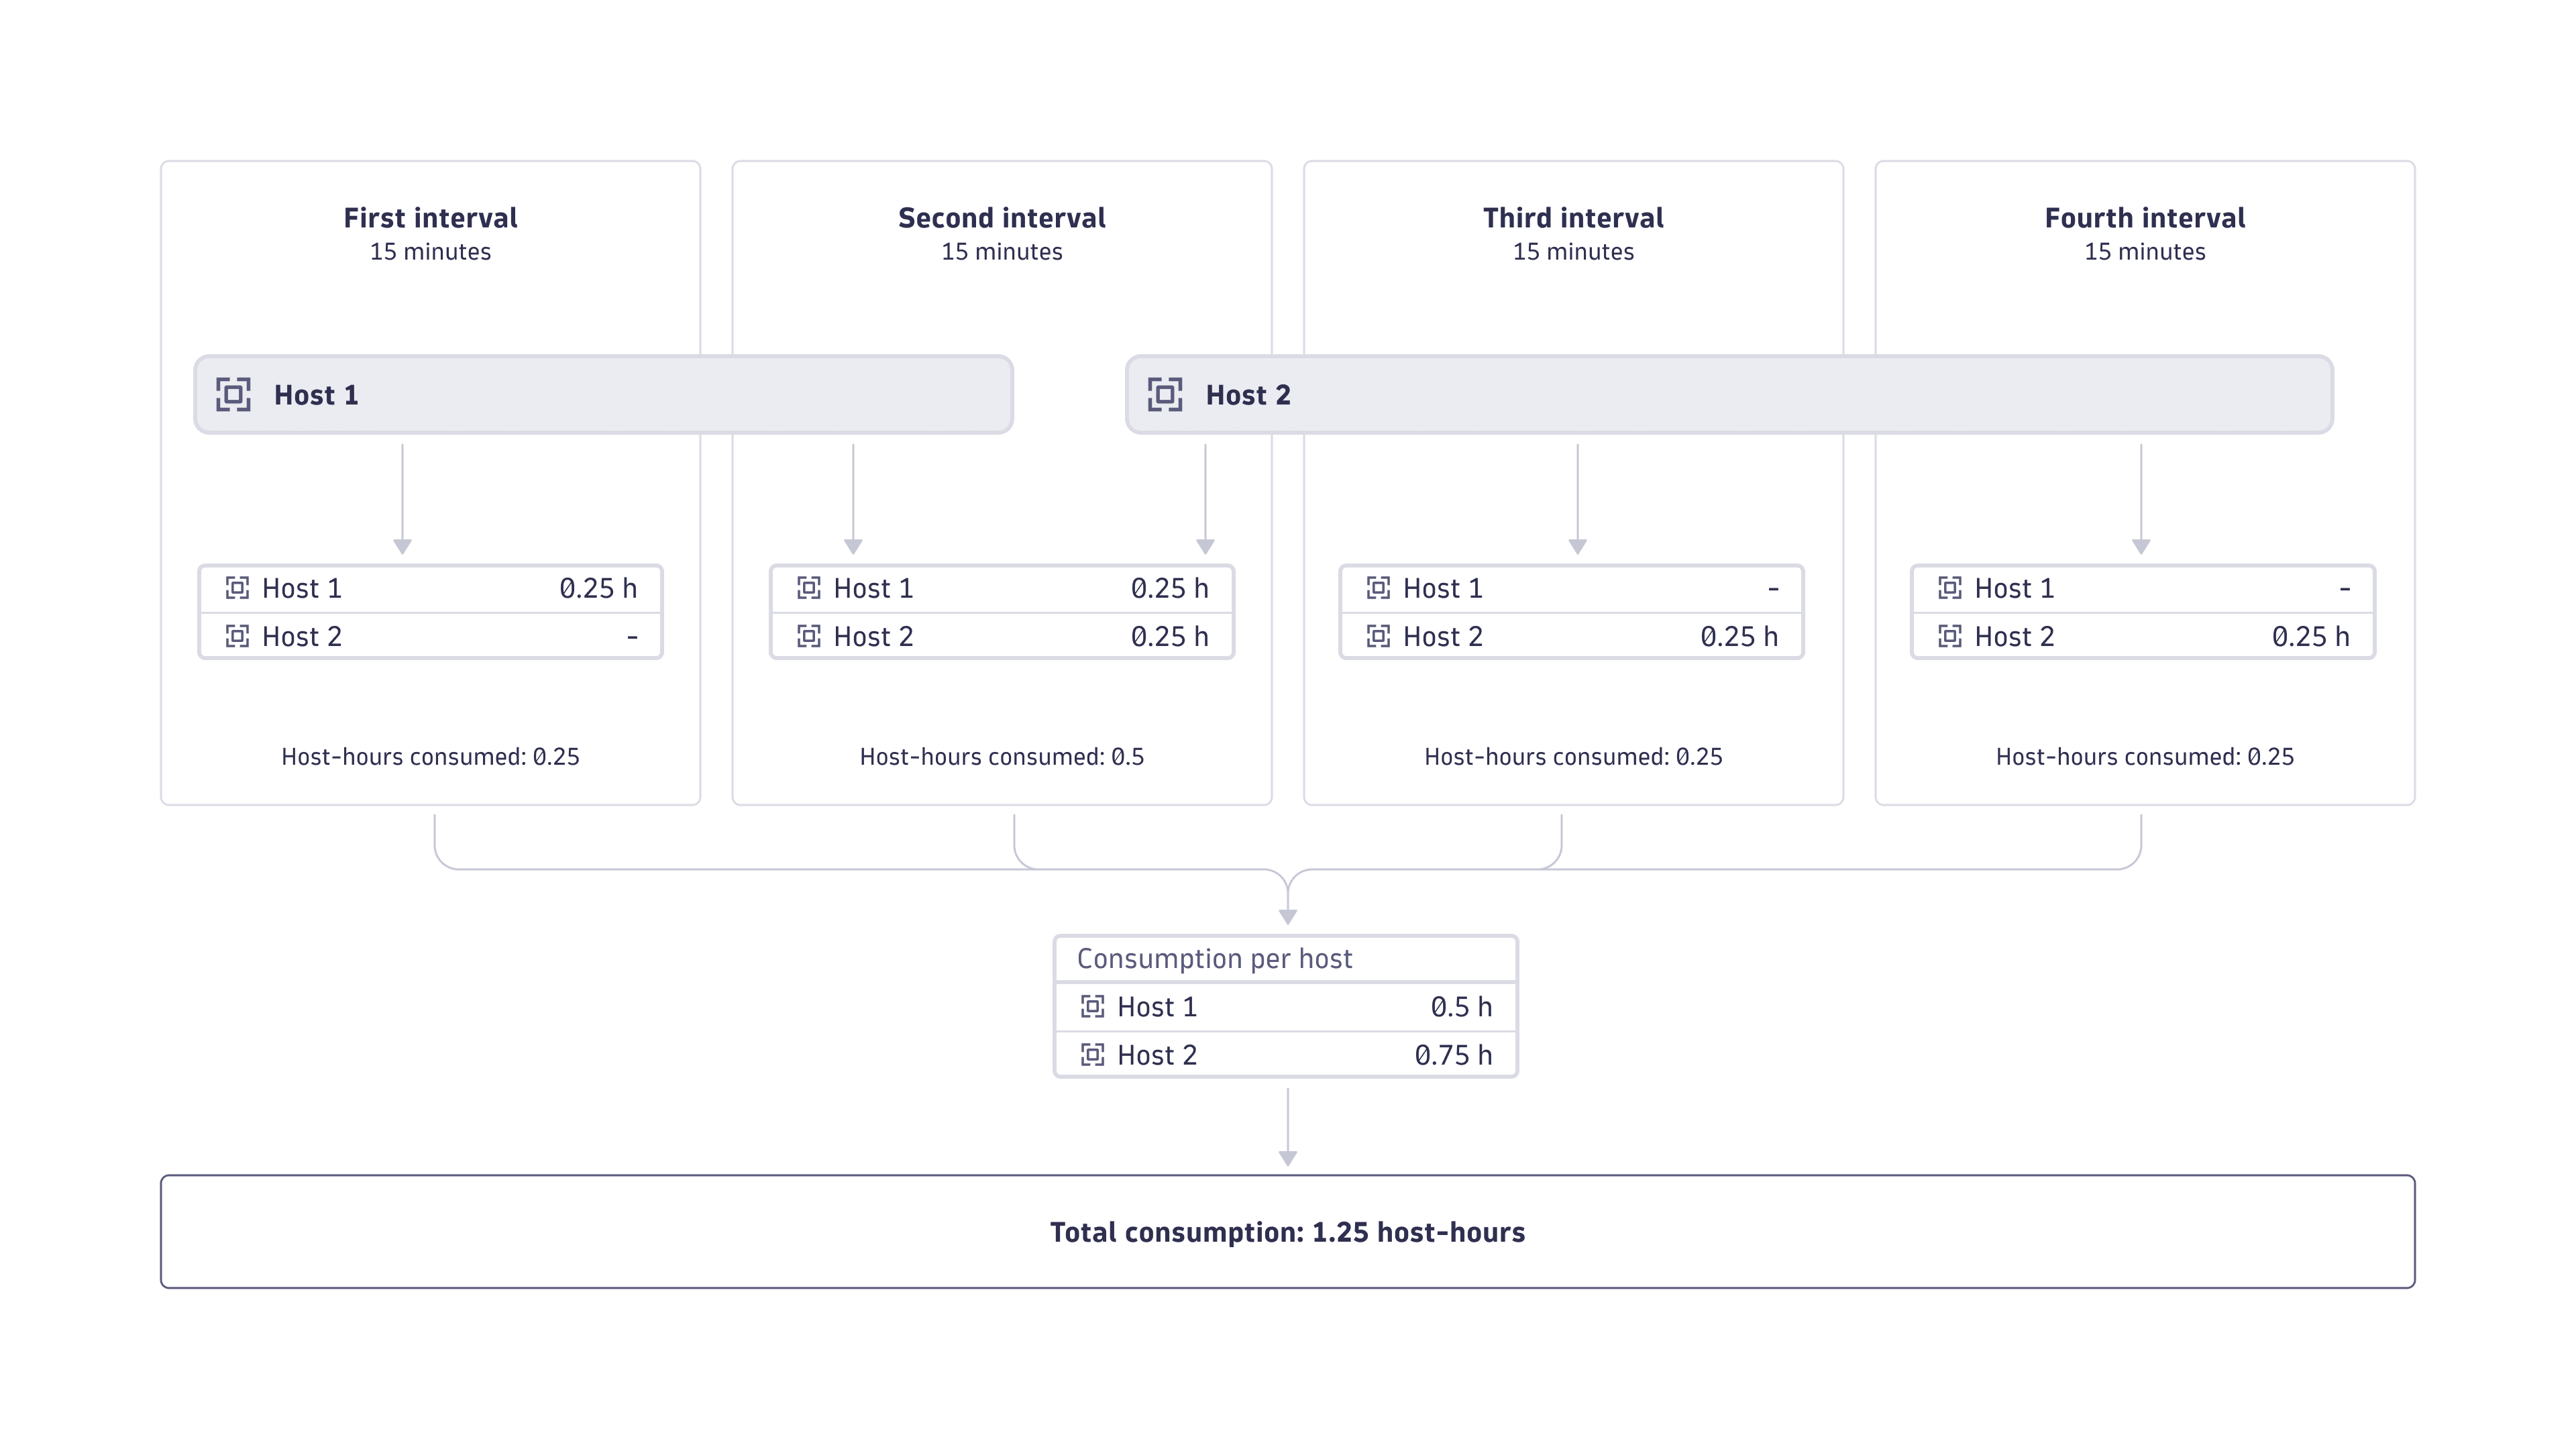
Dynatrace is built for dynamic cloud-native environments where hosts and services are rapidly spun up and destroyed. Therefore, billing granularity for host-hour consumption is calculated in 15-minute intervals. When a host is monitored for fewer than 15 minutes in an interval, host-hour consumption is rounded up to 15 minutes before consumption is calculated.
The figure below illustrates how host-hour consumption per host is calculated at 15-minute intervals.
Bundled functionality
Metrics
This section assumes that you have followed the Dynatrace-recommended deployment options. If you implement a custom deployment, the charging of included metrics may still work as described—but this is not guaranteed by Dynatrace.
Infrastructure Monitoring includes:
-
Infrastructure monitoring metrics and other built-in metrics is included at no additional cost on Infrastructure Monitoring-enabled hosts.
-
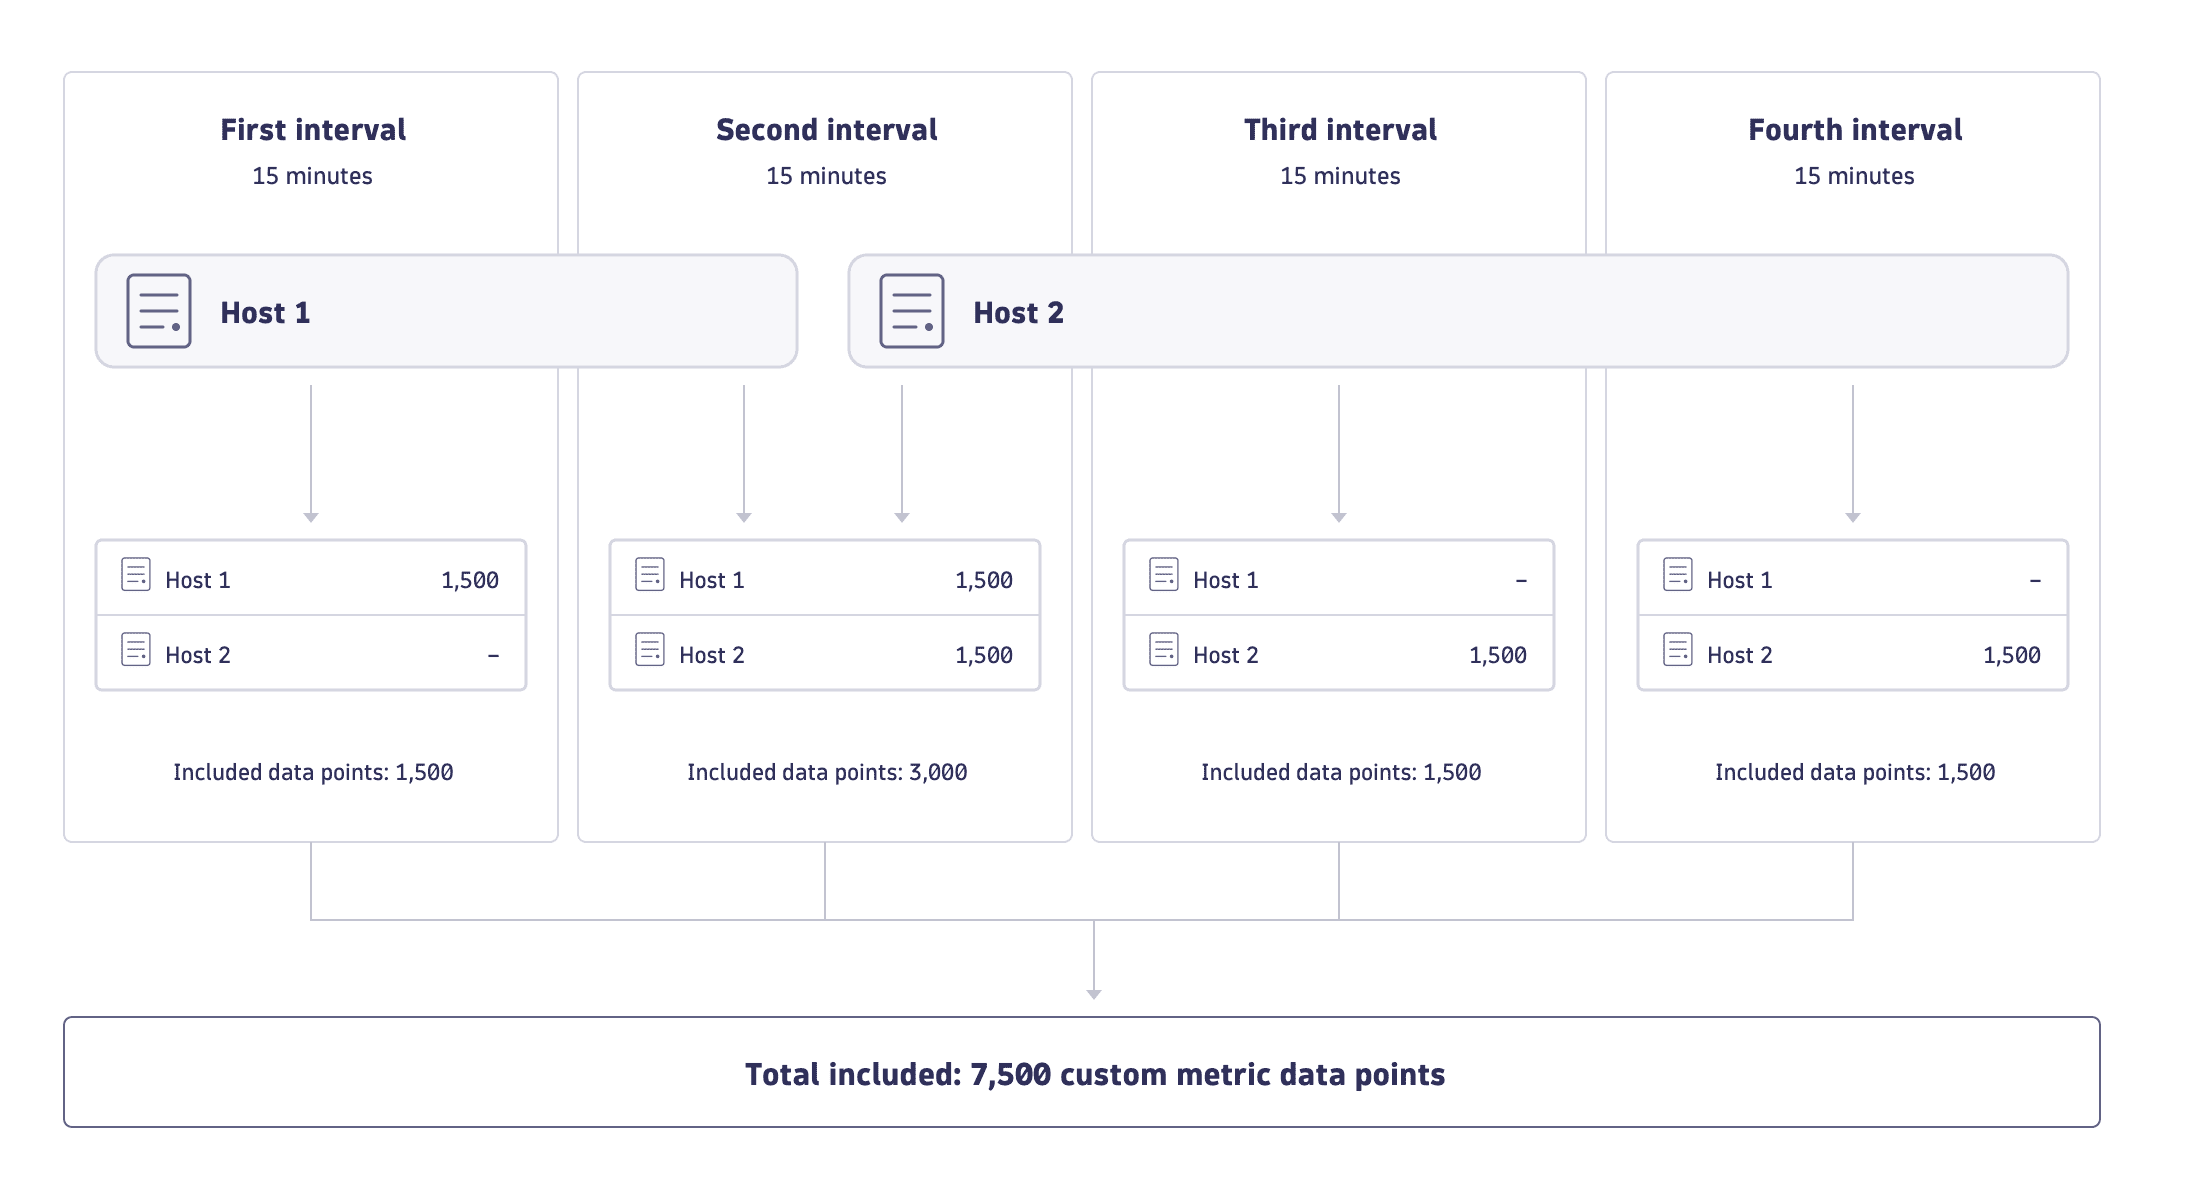
For each host, 1,500 custom metric data points are included in each 15-minute interval. Unused custom metric data points don't roll over to subsequent intervals. For examples of included custom metrics, see Included custom metric data points.
Metric data points that exceed your included volume are charged as:
- If Metrics powered by Grail exists on your rate card, these are charged as Metrics powered by Grail.
- If Metrics powered by Grail doesn't exist on your rate card, these are charged as Custom Metrics Classic.
Included custom metric data points
Your volume of included custom metric data points is applied automatically to metrics that originate at hosts that are monitored by OneAgent in Infrastructure Monitoring mode. Originating hosts include:
-
An Infrastructure-monitored host and sent via the OneAgent metric API, with metrics including for example:
- OpenTelemetry metrics
- Spring Micrometer
- StatsD
- JMX
- Extensions run locally on the host by OneAgent
- a host-local Telegraf
-
An Infrastructure-monitored Kubernetes node, with metrics including for example:
- OpenTelemetry metrics
- Spring Micrometer
- JMX
- Prometheus metrics via ActiveGate
- Metrics sent via the Dynatrace Collector (if Metrics powered by Grail exists on your rate card).
- Metrics sent via the OpenTelemetry Collector (if Metrics powered by Grail exists on and the OpenTelemetry Collector has been configured as described in Enrich OTLP requests with Kubernetes data).
Included metric data point calculation
Custom metric data point consumption takes many forms. An equal number of custom metric data points can be consumed:
- By a few high-resolution metrics or numerous low-resolution metrics.
- Equally across multiple 15-minute intervals or all at once in a single minute.
- By all Infrastructure-monitored hosts, a subset of all Infrastructure-monitored hosts, or a single infrastructure-monitored host.
Included custom metric data points are calculated according to 15-minute intervals, as shown in the figure below.
Estimate your cost
The following example uses a list price of $0.04 per host-hour. This may differ from your rate card price.
This example assumes 100 hosts are monitored 24 hours per day for 30 days:
100 hosts × $0.04 × 24 hours × 30 days = $2,880 per month
Understand your consumption
Dynatrace provides various options to help you understand and analyze your organization's consumption of Infrastructure Monitoring.
Insights via Account Management
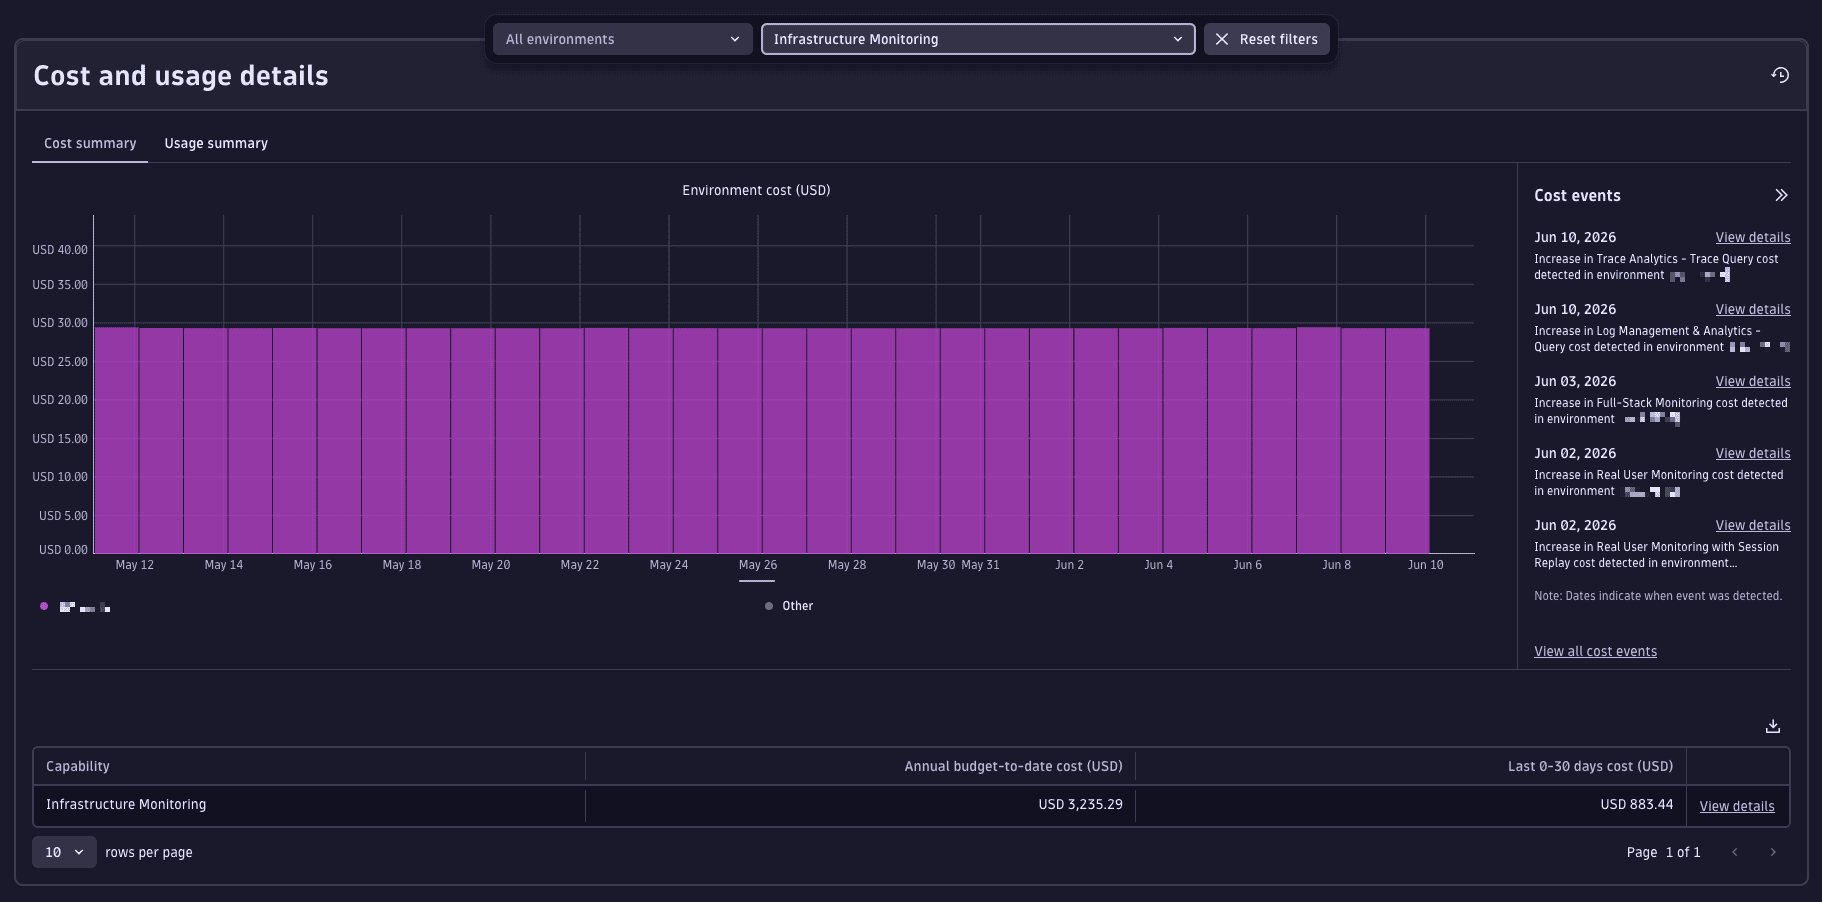
License managers can view usage and costs in Account Management.
-
Go to Account Management > Subscription > Overview > Cost and usage details > Usage summary.
-
Select the Infrastructure Monitoring capability.
-
From this screen, you can also drill down into usage detail on the capability and environment level.
- Capability level: Select View Details next to the capability you want to explore.
- Environment level: In the Environments table, select … > Open details with Notebooks.
For more information, see Overview (Dynatrace Platform Subscription).
Insights via billing usage events
Billing usage events (billing_usage_event) are system events emitted by Dynatrace that capture already-calculated, billable usage for DPS capabilities. Billing usage events are the most reliable source for building cost dashboards and allocation reports.
Billing usage events contain the host hours billed at the Infrastructure Monitoring rate, for the given host and time window. All counting rules are already applied: 15-minute intervals, rounded up.
Query billing usage events with DQL
Use these DQL queries as a starting point for dashboards, notebooks, or automated reports.
-
Total Infrastructure Monitoring host hours over time:
fetch dt.system.events| filter event.kind == "BILLING_USAGE_EVENT"and event.type == "Infrastructure Monitoring"| dedup event.id| summarize totalUsage = sum(usage), by:{bin(timestamp, 1d)} -
Infrastructure Monitoring host hours by host (top consumers):
fetch dt.system.events| filter event.kind == "BILLING_USAGE_EVENT"and event.type == "Infrastructure Monitoring"| dedup event.id| summarize totalUsage = sum(usage), by:{dt.entity.host}| sort totalUsage desc
Insights via API
You can query insights via the Environment API – Grail Query. Example DQL queries are provided in Query billing usage events with DQL.
Insights via the Account Management API
Query Infrastructure Monitoring consumption programmatically via the Account Management API (GET /subscriptions/{subscriptionId}/usage) to integrate into external reporting or automate cost allocation.
Insights via Dynatrace Assist
Use Dynatrace Assist to surface usage trends and recommendations. For example:
- "Which hosts are consuming the most Infrastructure Monitoring hours this month?"
- "Are any hosts regularly exceeding their included custom metric data point budget?"
Attributing costs
Use Cost Allocation to allocate specific Infrastructure Monitoring costs to your organization's cost centers or products.
- Tag resources: Apply cost-center, team, or application tags to host entities. Tags flow to Account Management reporting.
- Chargeback / showback: Use Account Management > Subscription > Cost management > Cost allocation to add business units, cost centers, and products.
Optimize your consumption
Configuration best practices
- Monitor your included custom metric budget. Each host includes 1,500 custom metric data points per 15-minute interval. If extensions or custom instrumentation regularly generate more, review whether all metrics are required and consider removing low-value metrics.
- Audit host inventory regularly. Look for decommissioned hosts, duplicate OneAgent instances, or hosts that are auto-scaled down and no longer active. Removing inactive hosts immediately stops consumption.
Ongoing optimization
- Use the
builtin:billing.infrastructure_monitoring.metric_data_points.ingested_by_hostmetric to identify high-consuming hosts and correlate with their business value. - Disable OneAgent on idle non-production hosts (for example, staging environments outside working hours) to avoid paying for unused monitoring.
- Review Dynatrace Extensions running on Infrastructure Monitoring hosts. Each extension can generate custom metric data points. Disable extensions that no longer provide value.
Automation
You can use Dynatrace to automate some of your optimization efforts:
- Anomaly alerts: Get notified of unexpected spikes in Infrastructure Monitoring host-hour consumption. To do this, set up Cost Monitors in Account Management.
- Scheduled reports: Deliver automated consumption reports to stakeholders on a regular cadence. To do this, use
 Notebooks and
  Workflows.
 - Remediation workflows: Automatically respond to cost threshold events, such as disabling non-critical hosts when a budget limit is reached. To do this, use AutomationEngine.
FAQs
Is Infrastructure Monitoring consumption affected by host memory size?
No. Host-hour consumption is independent of host memory size. Each monitored host contributes one host hour per hour of monitoring regardless of how much RAM it has. This is different from Full-Stack Monitoring, which scales with memory.
How does Infrastructure Monitoring compare to Foundation & Discovery?
Both use host hours as the unit of measure, but Infrastructure Monitoring provides significantly deeper observability:
- Foundation & Discovery: Basic host health, OS service status, topology and process discovery. No custom metrics. Lower cost per host hour.
- Infrastructure Monitoring: Everything in Foundation & Discovery, plus detailed process performance metrics, disk performance, network traffic analysis, per-process memory analysis, and 1,500 included custom metric data points per host per 15 minutes.
What happens if my custom metric data points exceed the included quota?
Data points beyond the 1,500 per host per 15-minute interval are billed as Metrics powered by Grail (or Custom Metrics Classic if that capability is not on your rate card).
- Use
builtin:billing.infrastructure_monitoring.metric_data_points.includedandbuiltin:billing.infrastructure_monitoring.metric_data_points.ingestedto stay within budget. - Use
builtin:billing.infrastructure_monitoring.metric_data_points.ingested_by_hostto identify which hosts are the source of the overage.
How does billing granularity work?
Consumption is calculated in 15-minute intervals. If a host is monitored for fewer than 15 minutes in a given interval, its consumption is rounded up to 15 minutes. This ensures short-lived cloud instances are billed accurately.
Does Infrastructure Monitoring include log ingestion?
OneAgent automatically ingests logs in all monitoring modes, including Infrastructure Monitoring. However, log ingestion doesn't consume Infrastructure Monitoring host hours; it is billed separately as Log Management and Analytics.
Can I run Dynatrace Extensions with Infrastructure Monitoring?
Yes. Dynatrace Extensions can be enabled on Infrastructure Monitoring hosts. Extensions may generate custom metric data points, which are counted against the 1,500 included data points per host per 15-minute interval. Any excess is billed separately.