Ingest SonarQube security and quality events, metrics, and audit logs
- Latest Dynatrace
- Extension
Prioritize SonarQube code risks with runtime context from production.
Get started
Overview
The Dynatrace integration with SonarQube allows you to unify and contextualize vulnerability findings across DevSecOps tools and products, enabling central prioritization, visualization, and automation of security findings.
SonarQube generates vulnerability findings on development artifacts like code and configuration files. The Dynatrace platform observes the corresponding runtime entities associated with those artifacts. Ingesting and enriching vulnerability findings helps users to better focus on the top risks that affect their production applications.
In this integration, in addition to the audit logs and security events, Dynatrace ingests various SonarQube quality metrics and generates Software Development Lifecycle (SDLC) events to represent assessments of artifacts done within the SDLC pipeline. This allows Dev teams to get a more exhaustive overview of the quality of their applications and services. It also allows SREs to have better visibility and control over the quality of the deployed artifacts from various quality perspectives.
Use cases
With the ingested data, you can accomplish various use cases, such as
Requirements
SonarQube requirements
- Generate an API token with the system administrator and
Browsepermissions on the projects to monitor.
Dynatrace requirements
-
ActiveGate version 1.313+ that needs to be able to
- Run Extensions 2.0 framework
- Reach the SonarQube API endpoint URL
-
Permissions: For a list of permissions required, go to Hub, select
 Extensions, and display Technical information.
 -
Generate an access token with the
openpipeline.events_securityandopenpipeline.events_sdlcscopes and save it for later. For details, see Dynatrace API - Tokens and authentication.
Activation and setup
-
In Dynatrace, search for SonarQube and select Install.
-
Follow the on-screen instructions to configure the extension.
-
Verify configuration by running the following queries in
 Notebooks:
-
For audit logs:
fetch logs| filter log.source=="SonarQube" -
For security finding events:
fetch security.events| filter dt.system.bucket == "default_securityevents"| filter event.provider=="SonarQube"AND event.type=="VULNERABILITY_FINDING" -
For security scan events:
fetch security.events| filter dt.system.bucket == "default_securityevents"| filter event.provider=="SonarQube"AND event.type=="VULNERABILITY_SCAN" -
For SDLC events:
fetch events| filter event.kind == "SDLC_EVENT"AND event.type == "control"| filter event.provider=="SonarQube" -
For metrics:
timeseries {Vulnerabilities = sum(sonarqube.code.vulnerabilities),Hotspots = sum(sonarqube.security.hotspots),`Hotspots reviewed` = sum(sonarqube.security.hotspots.reviewed),Bugs = sum(sonarqube.bugs),Coverage = sum(sonarqube.code.coverage),`Duplicated lines` = sum(sonarqube.code.duplication),`Code smells` = sum(sonarqube.code.smells)}, interval:3h
-
-
Once the extension is installed and working, you can access and manage it in Dynatrace via
Extensions. For details, see About Extensions.
Details
How it works
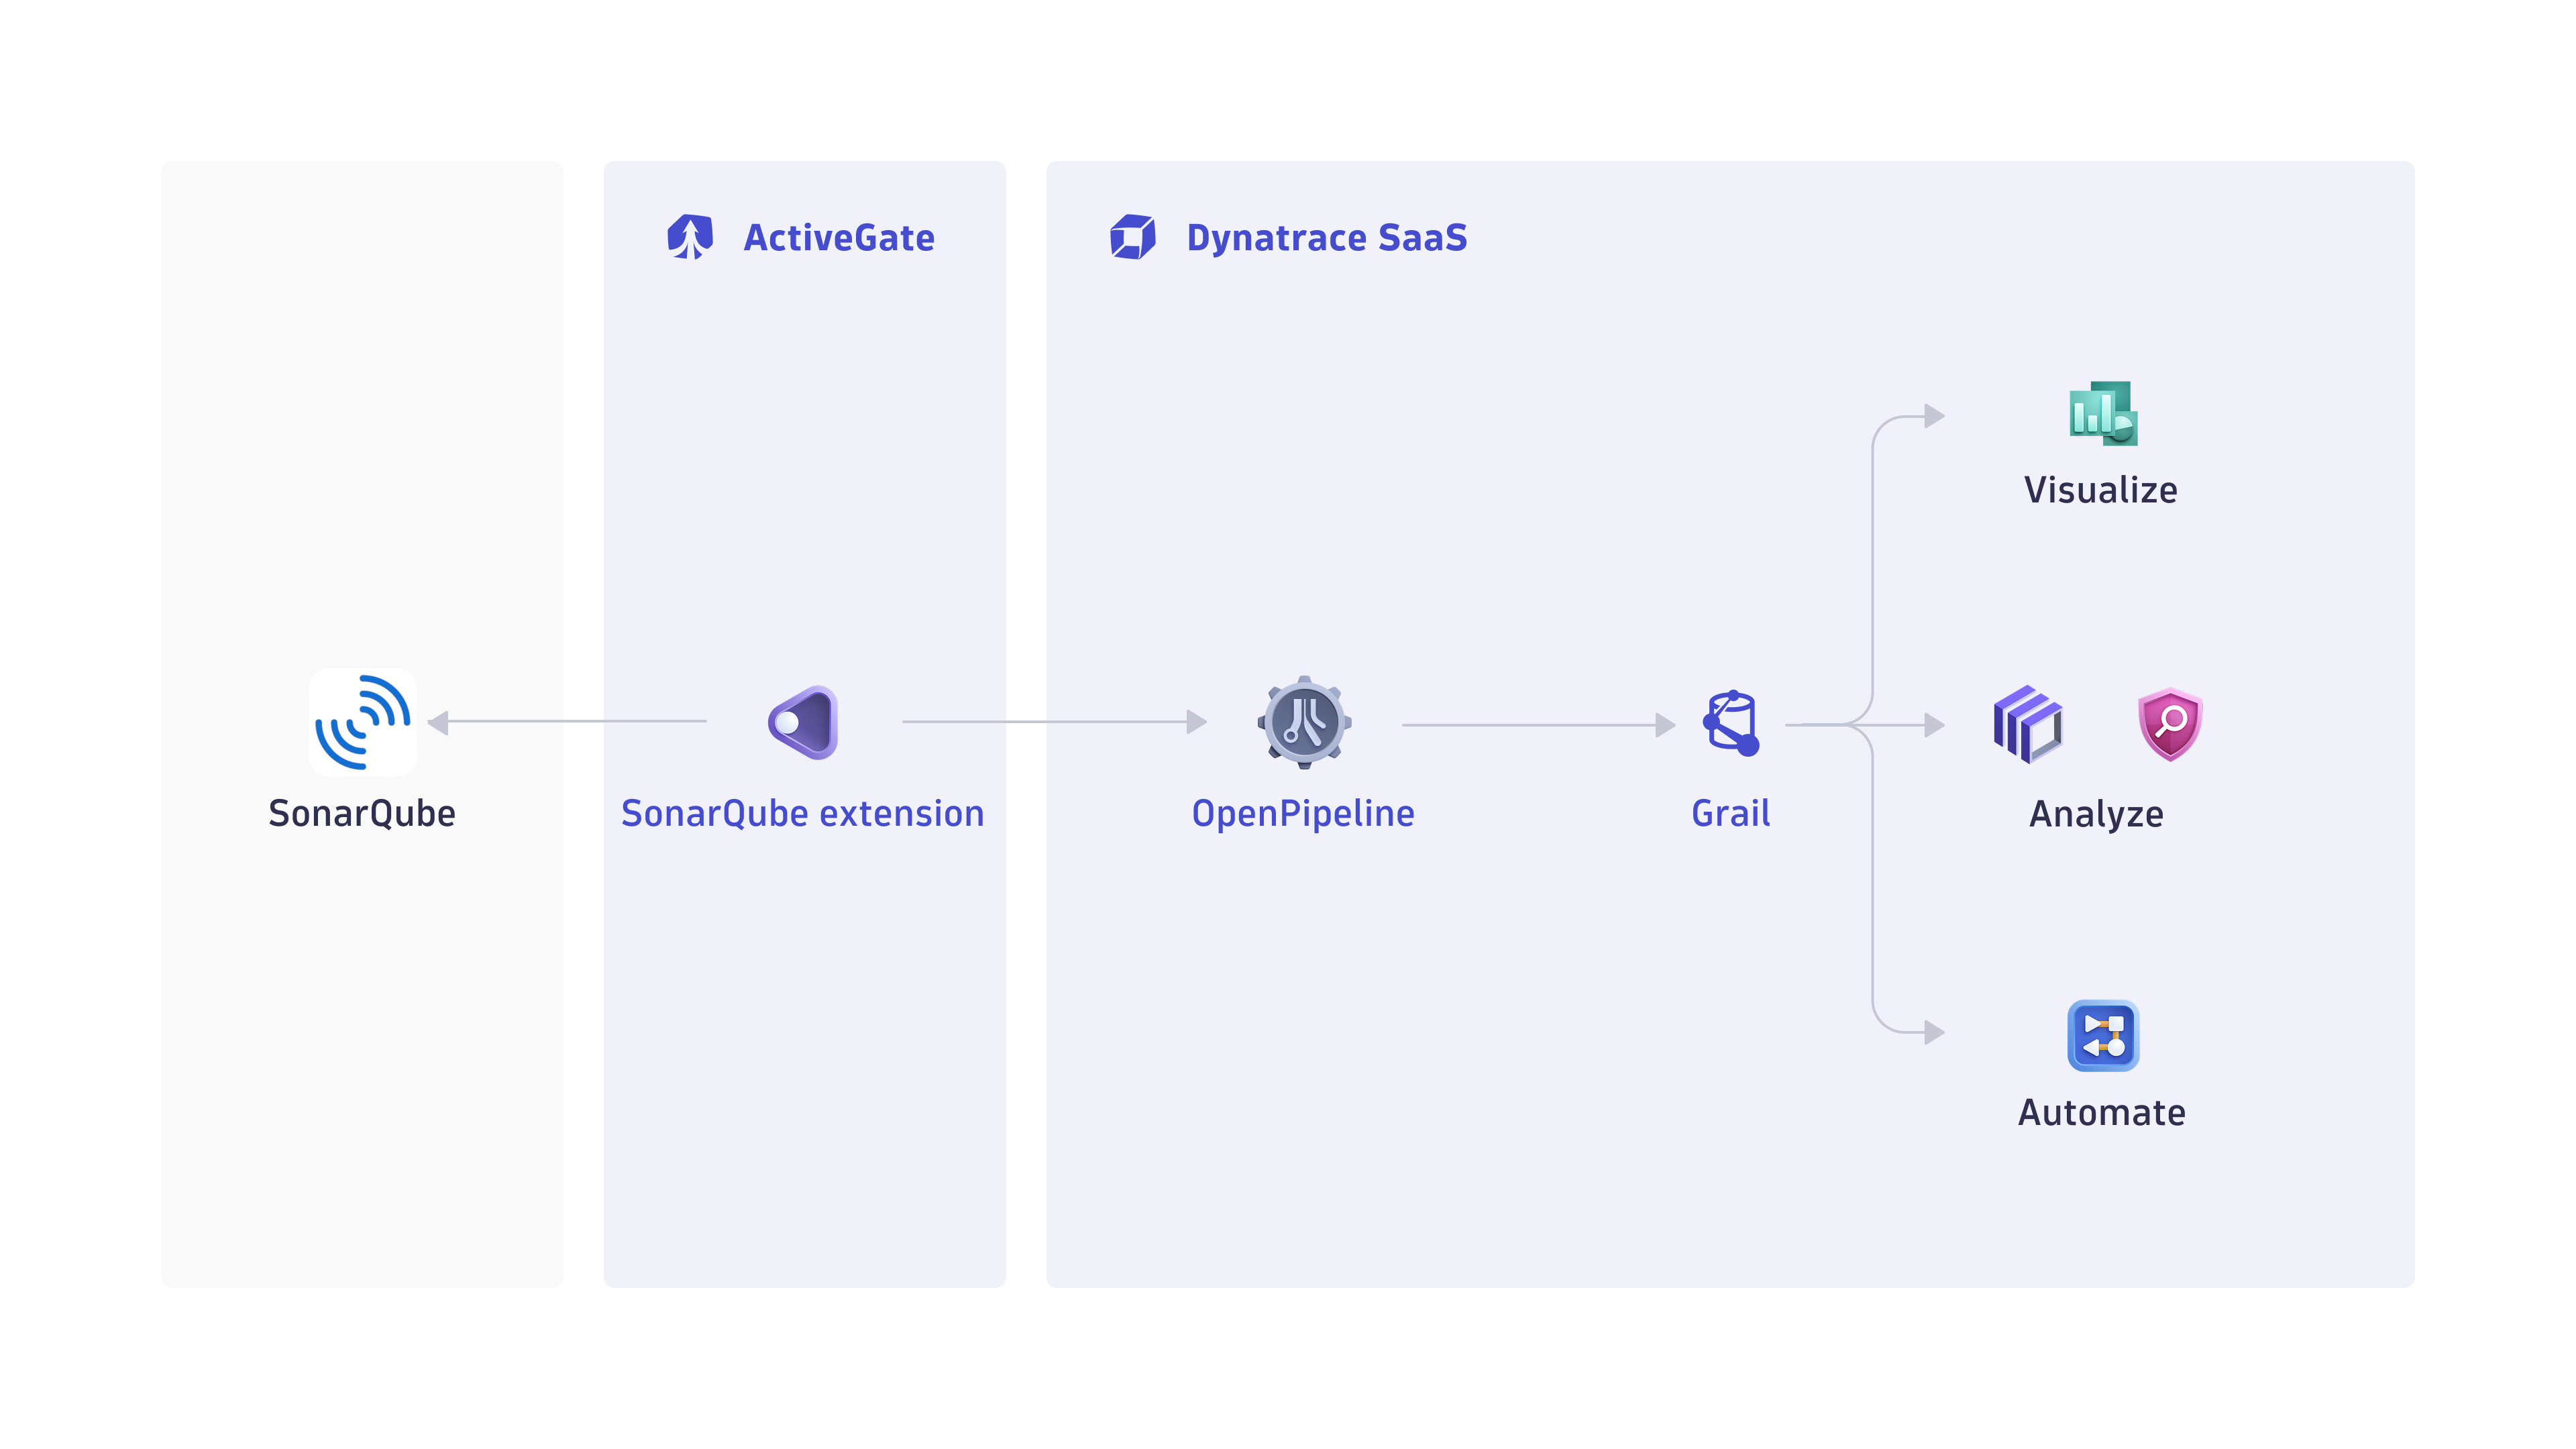
Dynatrace integration with SonarQube is an extension running on Dynatrace ActiveGate. Once you enable and configure the Dynatrace SonarQube extension
-
It periodically collects security findings and audit logs using SonarQube Web API v1.
-
The fetched data is ingested into Dynatrace and mapped to the Dynatrace Semantic Dictionary.
-
Data is stored in a bucket called
default_securityevents(for details, see Built-in Grail buckets).
Licensing and costs
For billing information, see Events powered by Grail.
FAQ
Which data model is used for the security logs and events coming from SonarQube?
-
Vulnerability finding events store the individual vulnerability findings reported by SonarQube per affected artifacts and component.
-
Vulnerability scan events indicate coverage of scans for individual artifacts.
-
Audit logs represent user activity logs in SonarQube.
-
SDLC control events indicate a control validation run.
Which SonarQube security findings are imported into Dynatrace?
-
If the extension is configured to ingest data at an interval of
nhours, whenever the extension runs, all security findings generated in the lastnhours will be ingested. -
On the first ingest, all findings updated in the last
mhours are considered, wheremis the first ingest interval configured in the monitoring configuration. -
If no scans occurred, no findings are ingested, even if the project has open issues.
Which extension fields are added on top of the core fields of the events ingested from SonarQube?
The sonarqube namespace is added for extracting several SonarQube-specific attributes for user convenience on top of the original issue JSON, which is stored in the dt.raw_data field.
Example fields:
-
sonarqube.project.name -
sonarqube.project.id -
sonarqube.revision -
sonarqube.revision.author -
sonarqube.tags -
sonarqube.component
What SonarQube asset types are supported by Dynatrace for runtime contextualization?
CODE_ARTIFACT: All findings from SonarQube are generated by vulnerability assessments of code artifacts set with the CODE_ARTIFACT value in the object.type field. The artifact and code namespaces are added with the corresponding fields:
-
artifact.repository.name: the repository name which hosts the artifact. -
artifact.path: the full path of the file representing the code artifact. -
code.filepath: includes the version of the vulnerable component. -
code.line.number: the line number where issue has been detected. -
code.line.offset.start: the first character number within the line with the issue. -
code.line.offset.end: the last character number within the line with the issue. -
code.line.start: the line number where the issue starts. Same ascode.line.number. -
code.line.end: the line number where the issue ends.
How do we normalize the risk score for SonarQube findings?
Dynatrace normalizes severity and risk scores for all findings ingested through the current integration. This helps you to prioritize findings consistently, regardless of their source.
For details on how normalization works, see Severity and score normalization.
The Dynatrace risk levels and scores are mapped from the original SonarQube severities.
-
dt.security.risk.levelis taken from the SonarQube severity level and mapped from the original values infinding.severity. -
dt.security.risk.scoreis mapped from the SonarQube provided severity level to static scores.
dt.security.risk.level (mapped from finding.severity) | dt.security.risk.score (mapped from dt.security.risk.level) |
|---|---|
BLOCKER CRITICAL | 10.0 |
CRITICAL/HIGH HIGH | 8.9 |
MEDIUM/MAJOR MEDIUM | 6.9 |
MINOR/INFO/LOW LOW | 3.9 |
INFO NONE | 0.0 |
