Ingest Black Duck security findings and scan events
- Latest Dynatrace
- Extension
- Published May 29, 2026
Ingest Black Duck findings and scan events into Dynatrace as security events. With runtime context from Dynatrace, you can focus on the vulnerabilities that affect running production applications.
Get started
Overview
Dynatrace integration with Black Duck allows you to unify and contextualize Black Duck security findings for visualization, analysis, and automation in Dynatrace.
Black Duck provides Black Duck Software Composition Analysis (SCA) capabilities that scan open-source dependencies across your projects and versions to identify known security vulnerabilities.
Dynatrace ingests and enriches Black Duck findings with runtime context to help DevSecOps teams filter and prioritize the risks that affect production applications and code artifacts.
Use cases
With the ingested data, you can accomplish various use cases, such as
Requirements
See below for the Black Duck and Dynatrace requirements.
Black Duck requirements
-
An active Black Duck instance with Software Composition Analysis enabled.
-
An API token for authentication. Generate it in Black Duck under User Preferences → Access Tokens. The user generating the token must have read access to projects, project versions, and vulnerability data.
Dynatrace requirements
-
ActiveGate version 1.330+ that must
- Run the Extensions 2.0 framework
- Reach the Black Duck API endpoints on your Black Duck instance
-
Permissions: For required permissions, go to Hub, select
 Extensions, and display Technical information.
 -
Generate an access token with the
openpipeline.events_securityscope and save it for later. For details, see Dynatrace API - Tokens and authentication.
Activation and setup
-
In Dynatrace, search for Black Duck and select Install.
-
Follow the on-screen instructions to configure the extension.
-
Verify configuration by running the following queries in
 Notebooks:
-
For finding events:
fetch security.events| filter dt.system.bucket == "default_securityevents"| filter event.provider=="Black Duck"AND event.type=="VULNERABILITY_FINDING" -
For scan events:
fetch security.events| filter dt.system.bucket == "default_securityevents"| filter event.provider=="Black Duck"AND event.type=="VULNERABILITY_SCAN"
-
-
After the extension is installed and working, you can access and manage it in Dynatrace via
Extensions. For details, see About Extensions.
Details
How it works
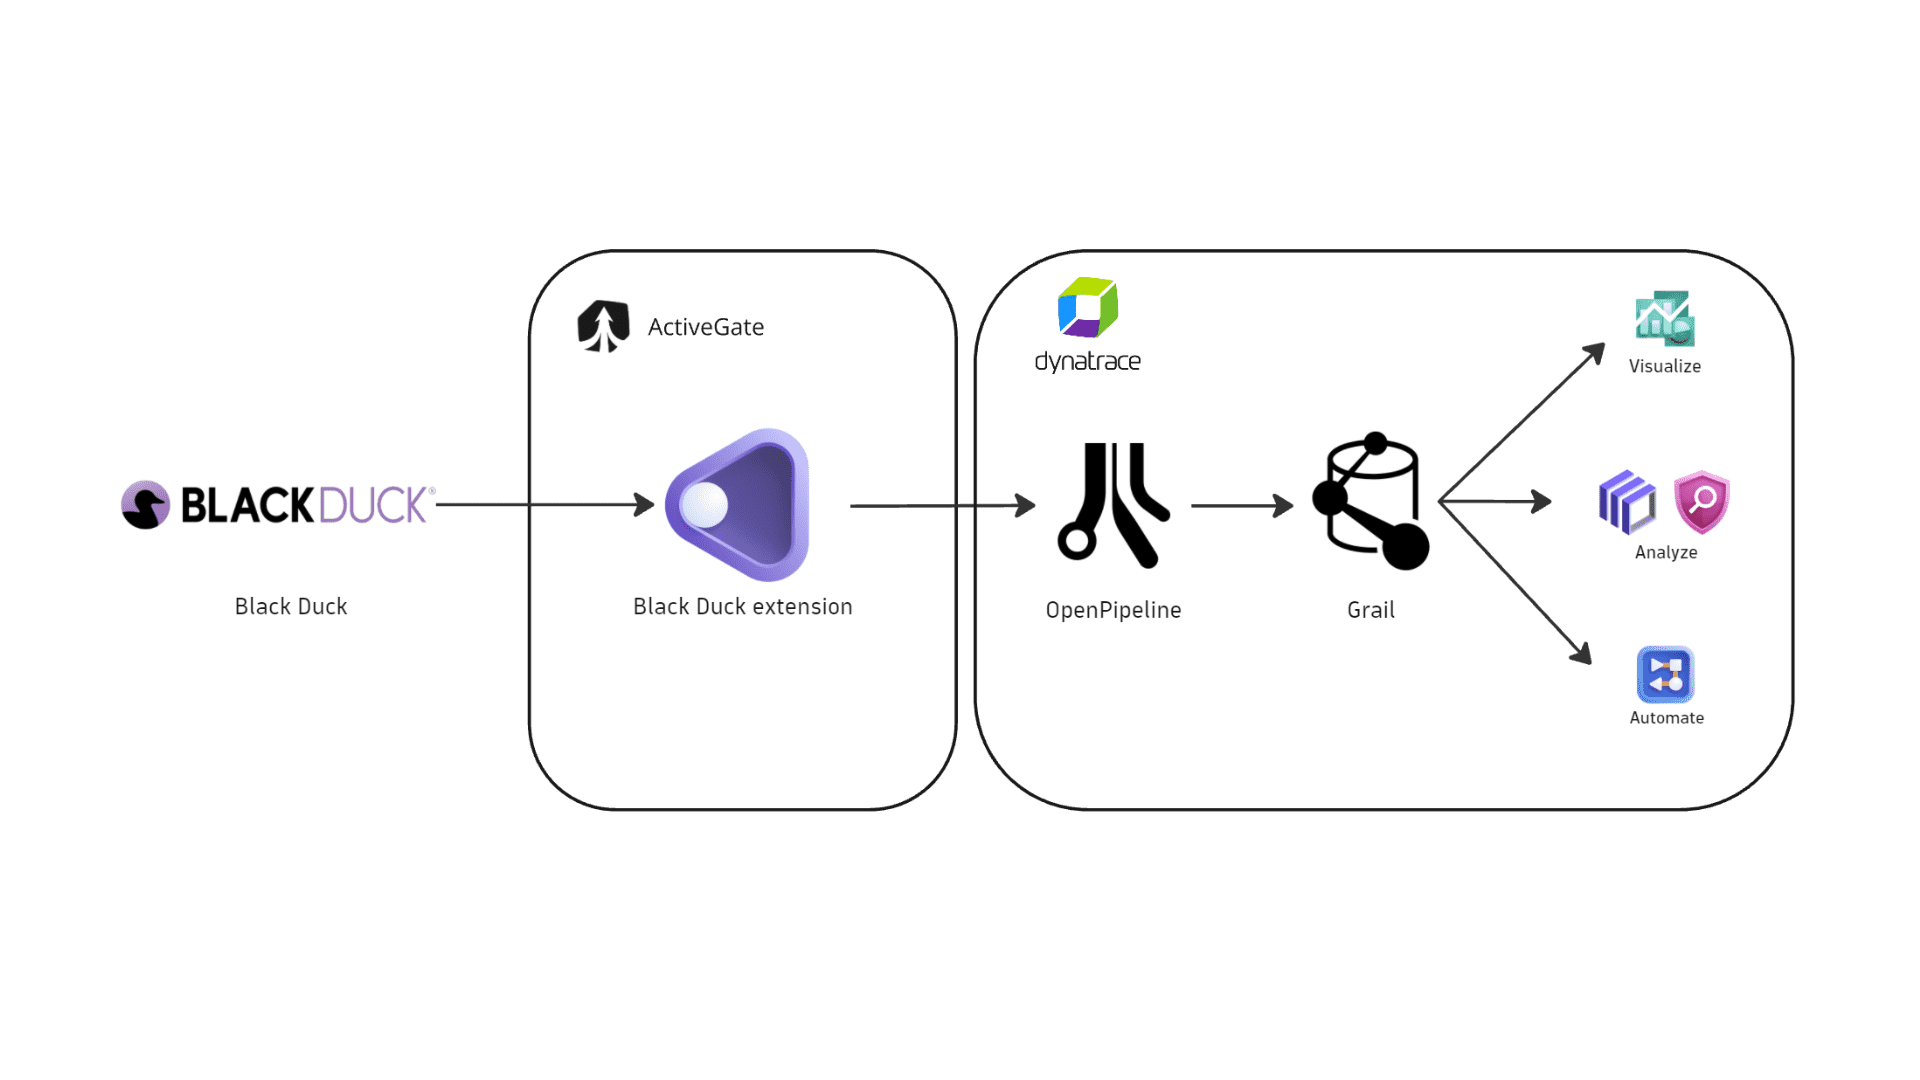
Dynatrace integration with Black Duck is an extension running on Dynatrace ActiveGate. After you enable and configure the Dynatrace Black Duck extension:
- It periodically polls Black Duck APIs to collect the bill of materials (BOM) for each project version and identifies vulnerable components.
- It uses the Black Duck journal to detect which project versions have new or updated scan activity since the last ingestion cycle.
- Dynatrace ingests the fetched data and maps it to the Dynatrace Semantic Dictionary.
- Dynatrace stores the data in a bucket called
default_securityevents(for details, see Built-in Grail buckets).
Licensing and costs
For billing information, see Events powered by Grail.
FAQ
Which Black Duck products does Dynatrace integrate with?
This integration ingests security findings and scan events from Black Duck Software Composition Analysis (SCA).
Which data model is used for the security events coming from Black Duck?
-
Vulnerability finding events store individual vulnerability findings reported by Black Duck per affected component and project version.
-
Vulnerability scan events indicate scan coverage for individual project versions, including aggregated finding counts by severity.
Which Black Duck security findings does Dynatrace import?
-
If you configure the extension to ingest data at an interval of
nhours, each run re-ingests a project version if Black Duck journal activity (such as a scan, rescan, or component addition) is detected within the lastnhours. -
On the first ingest, Dynatrace ingests all project versions regardless of recent journal activity.
-
If Dynatrace detects no new or updated findings for a project version, it ingests none for that version.
Which extension fields are added to the core fields of events ingested from Black Duck?
The blackduck namespace is added for Black Duck-specific attributes on top of the core security event schema. The full upstream payload is stored in event.original_content.
Example fields:
blackduck.project.id: Black Duck project identifier.blackduck.project.name: Project name.blackduck.project.version.id: Black Duck project version identifier.blackduck.project.version.name: Project version name.blackduck.project.owner.name: Display name of the project owner in Black Duck.blackduck.project.owner.id: Identifier of the project owner in Black Duck.blackduck.project.version.journal.latest.id: Event ID of the latest Black Duck journal entry for this project version.blackduck.project.version.journal.latest.update: Timestamp of the latest Black Duck journal entry.blackduck.finding.createdAt: Timestamp when the remediation record was first created in Black Duck.blackduck.ignored: Boolean flag indicating whether the finding is marked as ignored in Black Duck.blackduck.component.ecosystem: Package ecosystem of the affected component (for example,npm,maven,pypi).blackduck.component.path: Path to the component within the scanned artifact.blackduck.codelocation.urls: List of Black Duck code location URLs associated with this scan.
Which Black Duck asset types are supported by Dynatrace for runtime contextualization?
CODE_ARTIFACT: All findings from Black Duck are generated by vulnerability assessments of code artifacts and are mapped with the CODE_ARTIFACT value in the object.type field. These findings aren't natively mapped to runtime entities monitored by Dynatrace.
How is risk score normalized for Black Duck findings?
Dynatrace normalizes severity and risk scores for all findings ingested through this integration. This helps you prioritize findings consistently, regardless of their source. For details, see Severity and score normalization.
dt.security.risk.level is mapped directly from the Black Duck BOM component severity (CRITICAL, HIGH, MEDIUM, or LOW).
dt.security.risk.score is derived from dt.security.risk.level using the following mapping:
dt.security.risk.level (mapped from Black Duck BOM severity) | dt.security.risk.score (mapped from dt.security.risk.level) |
|---|---|
CRITICAL | 10.0 |
HIGH | 8.9 |
MEDIUM | 6.9 |
LOW | 3.9 |