Collaborate with other apps
- Latest Dynatrace
- How-to guide
 Investigations lets you interact with other apps to enrich your analysis, correlate data across domains, and streamline workflows. You can:
- Navigate to other apps directly from query results or nodes.
- Open Investigations from other Dynatrace apps.
- View references to the source of an investigation to quickly navigate back to where it was opened.
Download nodes as a Notebooks document
From Investigations, you can download nodes and results as a new  Notebooks document. For details, see Download nodes.
Navigate to other apps
For example, from Investigations, you can
-
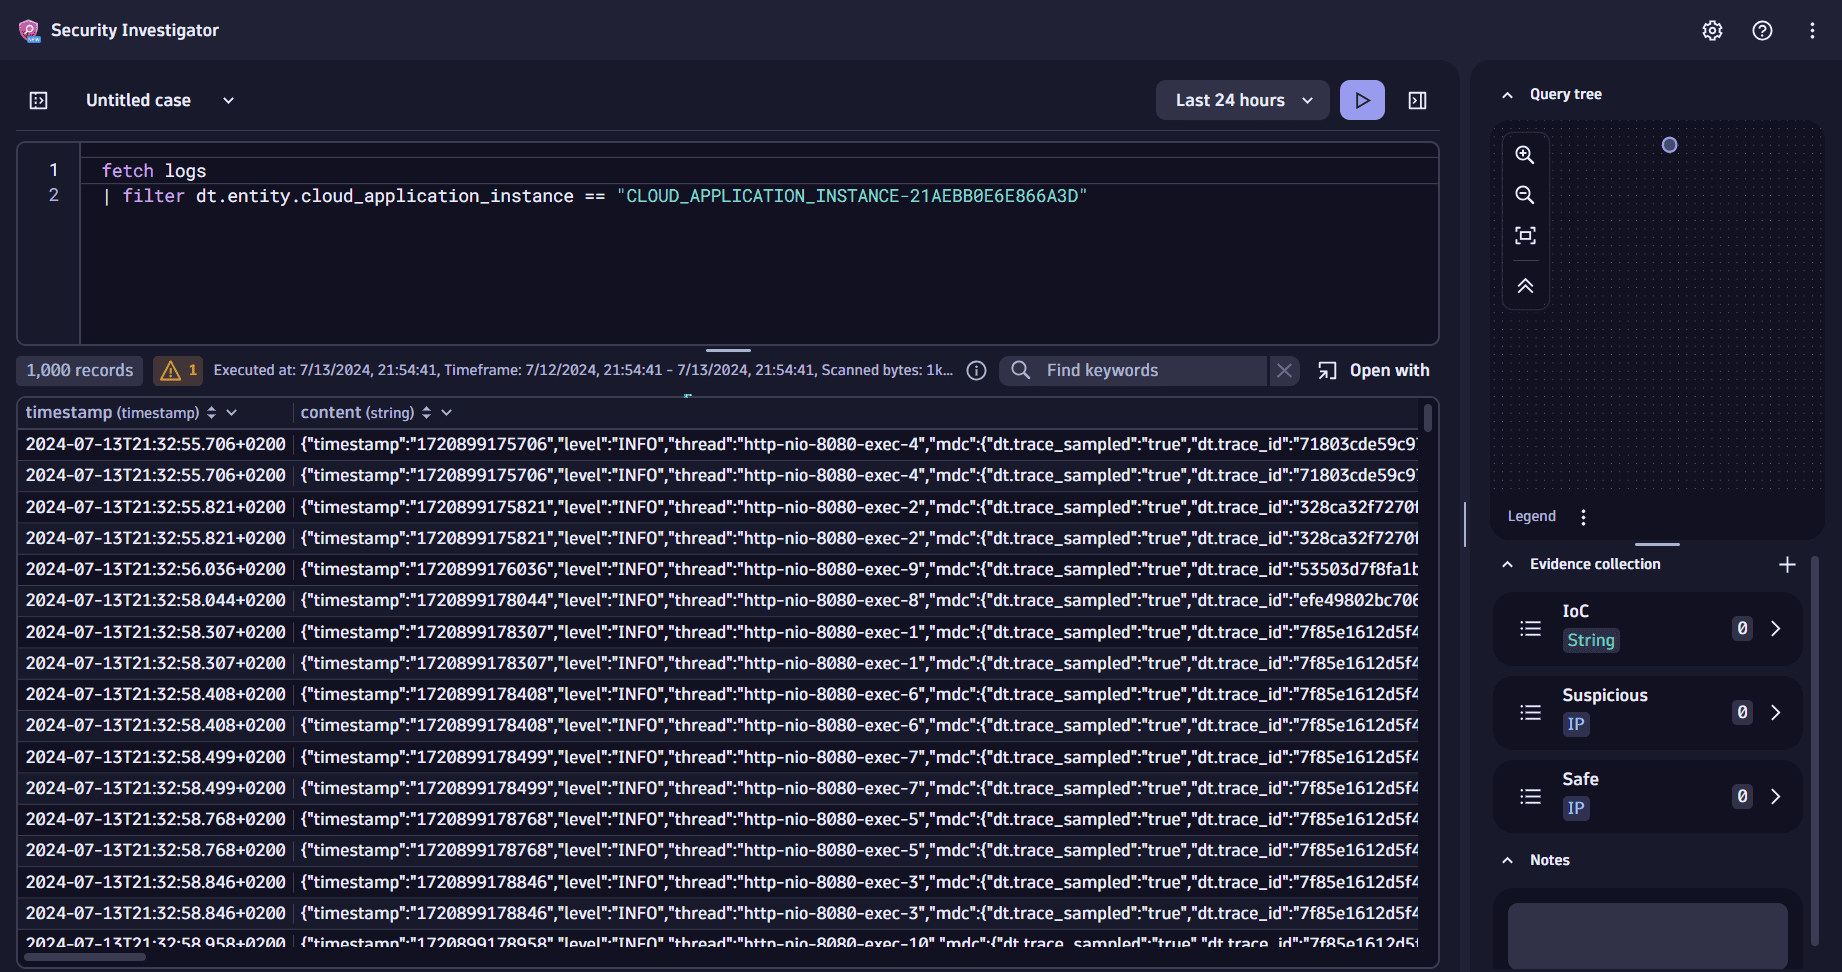
Open queries in another app.
- Select
 at the right below the query input.
 - Select an app from the available options.
 open with for queries
 - Select
-
Open monitored entities field values in another app.
- In the query results table, select a
dt.entity.[...]field value. - Select Open with and select an app from the available options.
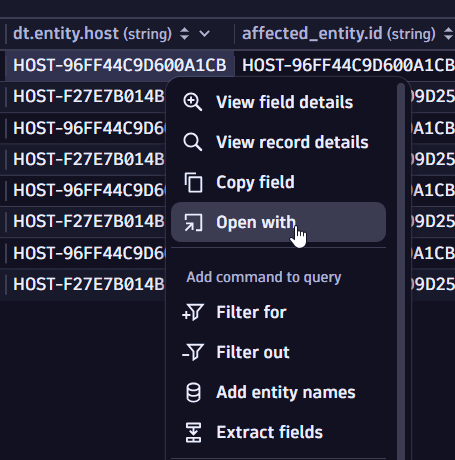 open with from query results table
 - In the query results table, select a
-
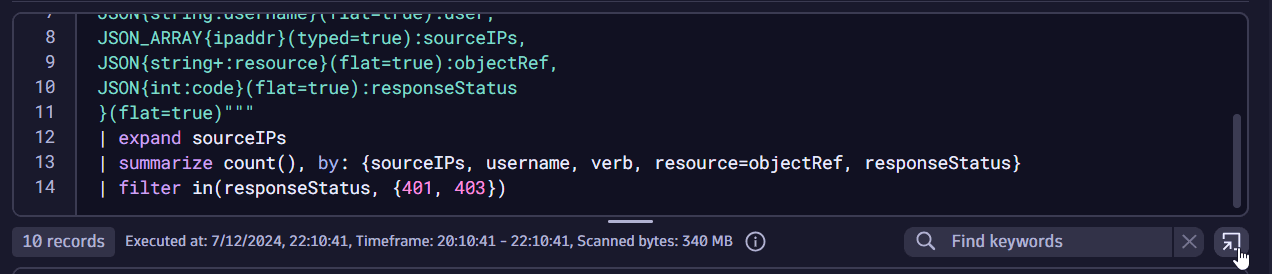
Open a distributed trace by its trace ID in another app.
- In the query results table, select the field that contains a trace ID value, such as
trace_idortrace.id. - Select Open with and select an app from the available options.
- In the query results table, select the field that contains a trace ID value, such as
Navigate to Investigations
To open Investigations from other apps, such as  Logs & Events,
 ") Kubernetes,
Kubernetes,  Vulnerabilities, or
  Threats & Exploits, look for and select the Open with option in the respective apps.
For example, from Kubernetes, you can instantly view pod logs and begin analyzing operational or performance issues using Investigations.
-
In
Kubernetes, go to Pods and select a pod for which you want to view logs. -
Select
 , then select Open with.
 -
Select
Investigations from the list of available apps.This generates a query in
Investigations to fetch all relevant logs from the pod and allows you to carry on the investigation from there.
View source references
When an investigation is opened from another Dynatrace app, a reference to the source is automatically added. You can view all sources in the right‑hand panel next to the results table, in the References tab alongside Evidence and Performance metrics. Each source entry displays the name of the originating item and the icon of the source app. Select a source to open it directly in a new browser tab.
This functionality is currently available for Threats & Exploits, with support for additional apps coming later.