DPL Architect
- Latest Dynatrace
- Reference
Latest Dynatrace
The DPL Architect tool helps you
- Extract fields from records.
- Create the right data pattern to save time in developing DPL patterns.
- Get instant feedback about the effectiveness and coverage of your patterns for your specific use case.
- Save and reuse your existing DPL patterns for faster access to data analytics use cases.
- Use preset patterns for the most popular technologies.
How it works
DPL Architect provides instant feedback to your DPL pattern expression without the need to re-execute your DQL query. This saves you time and energy when determining what DPL expression you need. Feedback is given in two contexts: base dataset and match preview dataset.
Base dataset
The base dataset is created from the original query executed in Notebooks. The same query is executed in DPL Architect and saved as a base dataset to show you what portion is matched by the pattern you created.

Match preview dataset
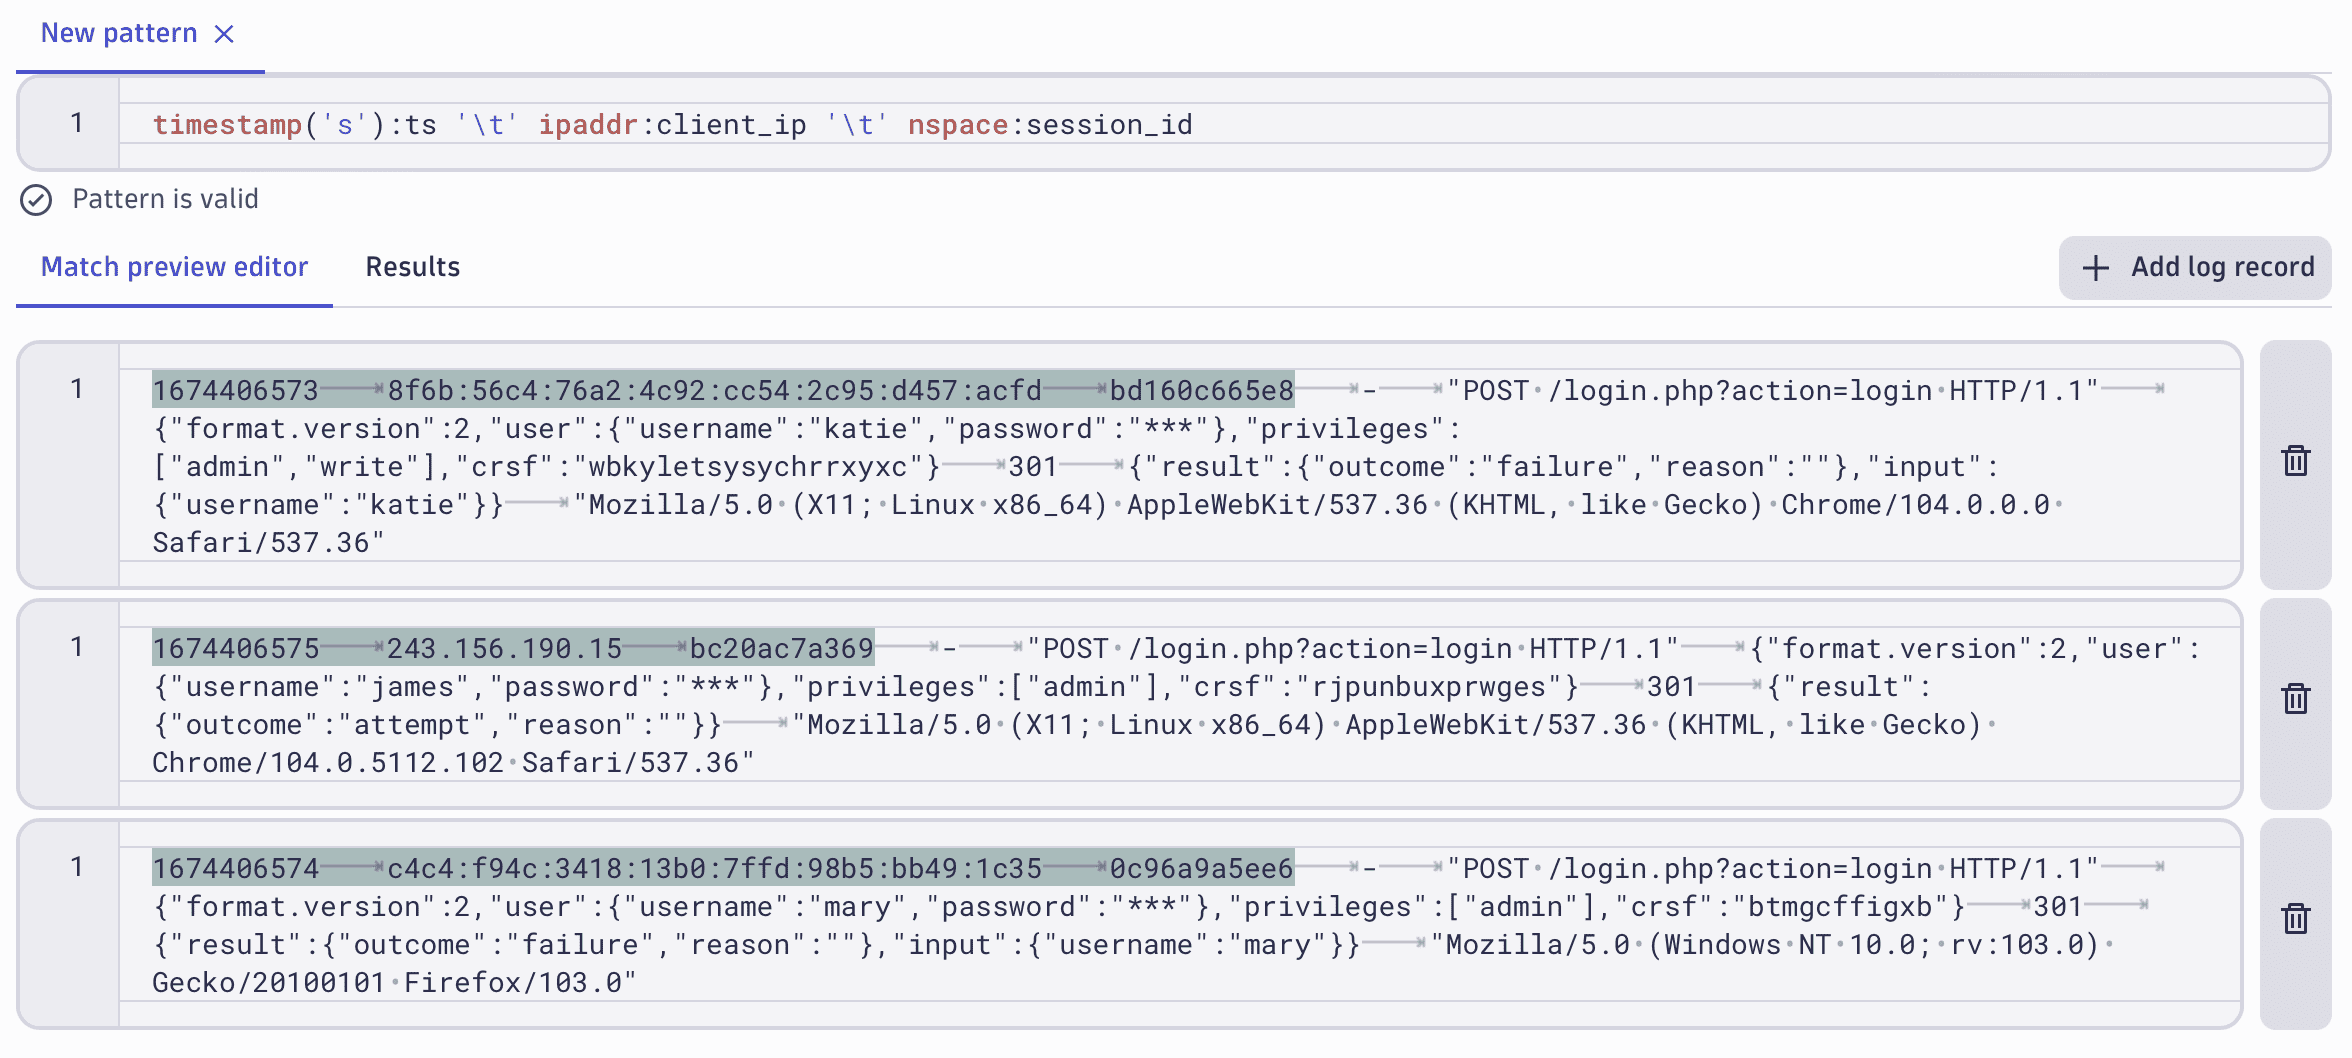
The match preview dataset consists of records displayed in DPL Architect. When you open DPL Architect, the record from where you started to extract additional fields is displayed in the match preview editor. You can add additional lines from the base dataset by selecting Add to preview and, if needed, you can create additional records manually. The portion of the record that matches the DPL pattern is highlighted so that you can visualize the progress of your pattern.

Access DPL Architect
You can currently access DPL Architect from
-
Show me how
- In Notebooks
 , open the
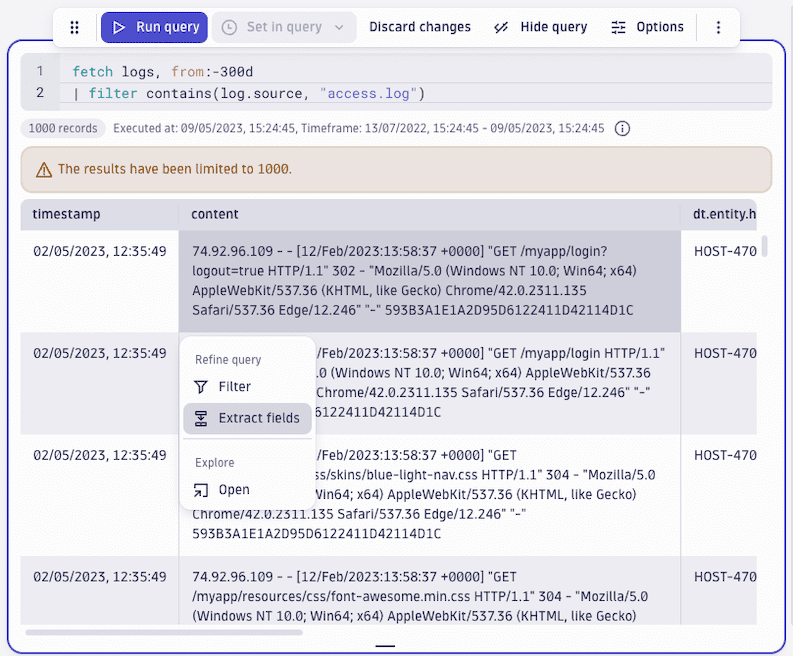
 menu and select Logs > Fetch logs.
- In the query section, select Run query.
- In the results section, select a cell and then select Extract fields from the pop-up menu.
 Extract fields
 - In Notebooks
-
Show me how
While using
 Investigations, there are several ways to access DPL Architect. For instructions, see Extract.
Use DPL Architect
Once you open DPL Architect, you can

Enter a schema pattern
Use the expression editor to enter your schema pattern and start field extractions. Start typing and use the autocomplete suggestions.
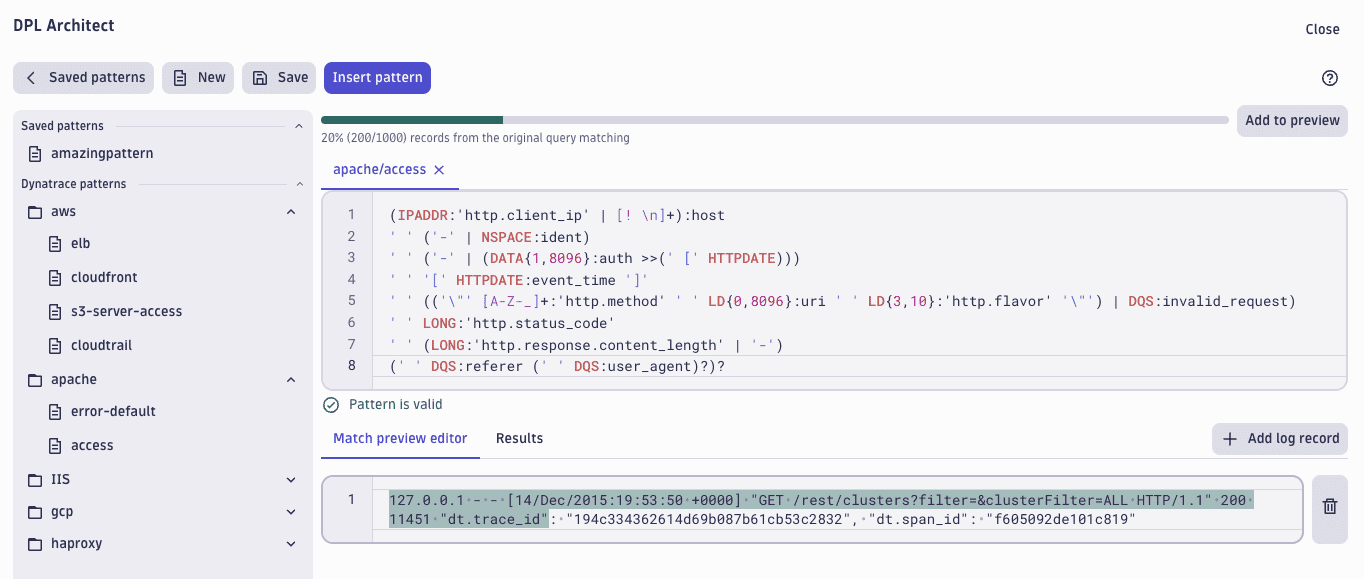
- If the pattern is in the correct format, Pattern is valid is displayed.
- If the pattern format contains errors, Pattern error: … indicates the line and position of the invalid element.

View matching records
Base dataset displays how many records from the original query results match your pattern.

Preview with highlighted syntax
- Match preview editor checks if the schema pattern you entered matches the record. The portion of the record that matches the DPL pattern is highlighted.

- Add log record adds a row so you can enter a custom data record to the preview, in addition to the existing data, for pattern validation.
View extracted fields
Results displays the extracted fields as new columns if, in your pattern, you add names to the extracted fields after the colon (for example, IPADDR:client_ip).

Get visual feedback about your pattern quality
Select Add to preview (located to the right of the base dataset) to
- Add records from your query result to your match preview component and get visual feedback about your pattern quality.
- Find out which records from the original result set match your pattern.
- Add the unmatched records to the preview set to further improve your DPL pattern.
Experiment with multiple patterns
You can have multiple DPL patterns opened at the same time in different tabs. This way you can
- Reuse parts of existing patterns
- Try different scenarios
- Compare pattern performance
When working with multiple patterns, use these commands:
- Select New to create a new pattern.
- Select Save to save your pattern.
- Select Saved patterns to show or hide a list of saved patterns.
Unsaved patterns persist after closing DPL Architect and are only dismissed when you close the tabs manually.
Apply your pattern to the query
-
Select Insert pattern to add the pattern to the parse command at the end of the original query.
-
Select Close to return to the query section, and rerun the query to see the extracted fields in the results.
Preset patterns
DPL Architect provides a variety of preset patterns for the most popular technologies in the field, such as AWS, Microsoft, and Google Cloud.
These patterns can be
- Used out of the box to extract all fields from a specific event.
- Customized based on your preference.
Access preset patterns
To access the preset patterns, select Saved patterns > Dynatrace patterns. For faster access, preset patterns are logically divided into a folder structure.

List of preset patterns
See below for the list of preset patterns.
| Pattern | Description |
|---|---|
| Apache HTTP servers access log pattern. See: Apache log files |
| Apache HTTP servers error log pattern. See: Apache log files |
| AWS CloudFront default log pattern. See: Standard log file fields |
| Extracts all the fields from AWS CloudTrail JSON-formatted log record. See: CloudTrail log file examples |
| Extracts all the fields from AWS Elastic Load Balancer log record. See: Access logs for your Application Load Balancer |
| Extracts all the fields from JSON-formatted AWS Route53 resolver query log record. See: Route 53 Resolver query log example |
| Extracts all the fields from AWS S3 server access log records. See: Amazon S3 server access log format |
| Extracts all the fields from the AWS VPC Flow logs default format. See: Flow log records |
| Extracts the fields from the AWS VPC Flow logs custom format, when all the fields have been added in the default order. See: Flow log records |
| Extracts the relevant fields from GPC Security Command Centers' records. See: REST Resource: organizations.sources.findings |
| Extracts all the fields from HAProxy HTTP default log records. See: HAProxy Configuration Manual |
| Extracts all the fields from Microsoft IIS access logs. See: Configure Logging in IIS |
| Extracts all the fields from JSON-formatted Kubernetes apiservers' audit log records. See: kube-apiserver Audit Configuration |
| Extracts all the fields from CoreDNS default query logs. See: CoreDNS log |
Use case
Investigate security incidents in Kubernetes clusters
Application Security
In this use case, you work with  Investigations to analyze unauthorized requests in your Kubernetes audit logs. See how you can get a precise extraction of fields from complex data and instant feedback on your patterns about their effectiveness and coverage, without the need to re-execute queries, to find the origin of your unauthorized requests and get accurate results about what happened.
Further resources
For additional insights into DPL Architect, see
-
Blog: Speed up your security investigations with DPL Architect
-
Dynatrace University tutorial:
Additional insights into DPL Architect