Query with natural language
- Latest Dynatrace
- Overview
- 5-min read
You can use Dynatrace Intelligence generative AI in Dashboards and Notebooks to explore your data through natural language. It allows you to translate your conversational prompts directly into DQL queries that reflect the context of your environment. You can choose to auto-execute generated queries or generate DQL only.
Prerequisites
We assume that you have completed the setup described in Getting started with Dynatrace Intelligence agentic and generative AI.
Starting with Dynatrace version 1.335+, Dynatrace generative AI is enabled by default for all new tenants. This means that the change is applicable to all tenants created from Dynatrace version 1.335 onwards. You can see and change the setting in ![]() Settings > Dynatrace Intelligence > Generative and agentic AI > Enable generative AI if you'd like to opt out.
Settings > Dynatrace Intelligence > Generative and agentic AI > Enable generative AI if you'd like to opt out.
Keep in mind that:
- Tenants created before Dynatrace 1.335 are unaffected by this change.
- If you aren't using the Dynatrace default policies, you still need to provide your users with generative AI user permissions, so that they can use the functionality offered by Dynatrace generative AI.
Use generative AI in Notebooks
-
Go to
 Notebooks and open or create a notebook you can edit.
 -
Open the Add menu and select Prompt. A new Generative AI notebook section is created with an empty prompt box.
-
In the prompt box, type a prompt. Try
average cpu usage percentage by hostor see the examples displayed in the web UI for inspiration. -
Optional If your prompt doesn't specify the timeframe, you can still specify it in your section header. The default is Last 2 hours.
-
Select Run. Generative AI creates and runs the query for you.
Optional If you want to see the generated query before running it, open the menu next to the Run button and select Generate DQL only.
-
Review the results.
- You can review the query by expanding DQL on the right.
- Optional You can't edit the query directly in Dynatrace Intelligence generative AI, but you have two options for reusing it:
- Copy the query and paste it elsewhere manually.
- Open the menu in the section header and select Create DQL section to create a DQL section from this query.
- You can edit your original prompt, regenerate the query, and run it to update the results.
If you select Rerun sections, the Notebooks app will first check if any prompts have been edited.- If a prompt has been edited, the DQL will first be regenerated and then run.
- If no prompts have been edited, the existing generated DQL will simply be run.
-
Optional Select the Options in the section header to change the visualization (refer to the visualization-specific documentation for more information).
Automatically select visualization
To have Dynatrace automatically select a visualization for your query, turn on Auto select in the upper-right corner of your visualization settings pane.
- If you manually select a different visualization, the Auto select switch will turn off.
- To have Dynatrace once again automatically select a visualization, turn Auto select back on.
Use generative AI in Dashboards
-
Go to
 Dashboards and open or create a dashboard you can edit.
 -
Open the Add menu and select Prompt.
- A new Dynatrace Intelligence generative AI dashboard tile is created
- A panel on the right displays:
- An empty tile title field you can customize
- A prompt box followed by some examples you can select to try
- A Run button
-
Optional At the top of the prompt definition panel, enter a tile title.
-
In the prompt box, type a prompt. Try
average cpu usage percentage by hostor see the examples displayed in the web UI for inspiration. -
Optional If your prompt doesn't specify a timeframe, you can still specify it for the dashboard in your dashboard header (default is Last 2 hours) or the Custom timeframe settings (for a tile-specific timeframe).
-
Select Run. Generative AI creates and runs the query for you.
-
Review the results.
- To review the query, expand DQL under the prompt box.
- Optional You can't edit the query directly in Dynatrace Intelligence generative AI, but you have two options for reusing it:
- Copy the query and paste it elsewhere manually.
- Open the menu in the tile header and select Create DQL tile to create a DQL tile from this query.
- You can edit your original prompt and run it to update the query and results.
If you refresh your dashboard, the Dashboards app will first check if any prompts have been edited.- If a prompt has been edited, the DQL will first be regenerated and then run.
- If no prompts have been edited, the existing generated DQL will simply be run.
-
Optional Select the Visual tab to change the visualization (refer to the visualization-specific documentation for more information).
Even though Dynatrace Intelligence generative AI is not charged for, all queries that are executed by generative AI are subject to licensing consumption according to your existing licensing agreement.
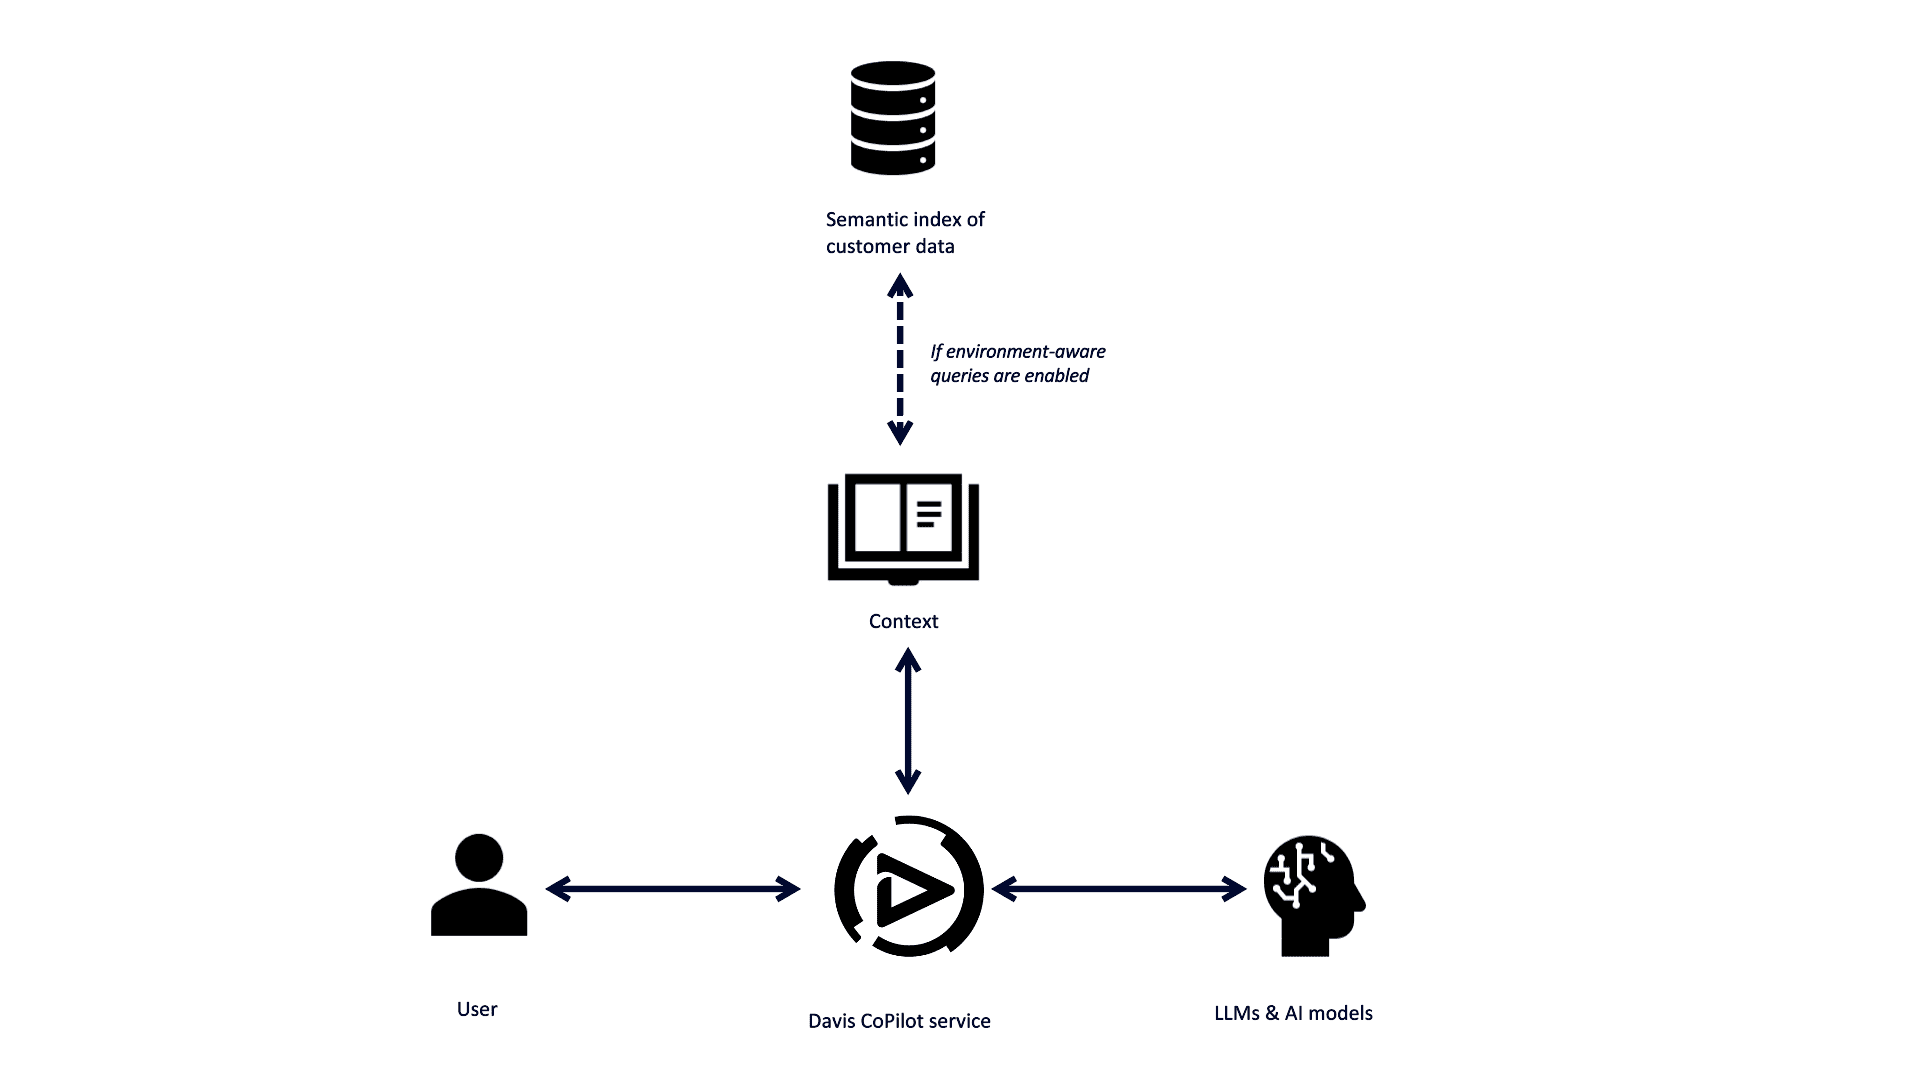
Environment-aware queries
Environment-aware queries enrich Dynatrace Intelligence generative AI with your environment data. This lets you generate more accurate queries that identify and reference relevant entities, events, spans, logs, and metrics from your environment. You can also run more complex data analyses by asking Dynatrace Intelligence generative AI about the specifics of your data. To learn more about how to control and manage which data Dynatrace Intelligence generative AI has access to and how to enable environment-aware queries, see Enable environment-aware queries.
Dynatrace Intelligence generative AI semantic index
Once enabled, Dynatrace Intelligence generative AI periodically scans your Grail data to create its own semantic index. Certain data fragments are sent to Microsoft Azure OpenAI during the semantic indexing. Examples of such data fragments include metric keys, dimensions, and field names. When a user provides a prompt, Dynatrace Intelligence generative AI first identifies the most relevant fragments from the data it has indexed. OUr generative AI then sends the user prompt, the relevant data fragments, and some examples of field values observed in your environment to Microsoft Azure OpenAI for processing.
Having environment-aware queries enabled allows Dynatrace Intelligence generative AI to identify unique data fields and custom metrics in your environment and helps you do your analysis by combining your prompt with the relevant, unique data fields and types.
Let's assume you're tracking travel bookings for new trips. In this case, you'd want to track:
- profit made on each booking as a bizevent
- applicable discounts as a bizevent
- length of time it takes customers to complete a booking as a custom metric
With this in mind, you could give Dynatrace Intelligence generative AI the following command: "Show me the average money made and the price reduction for new trips, over the last month".
If you have environment-aware queries enabled, the following DQL will be generated, providing you with results relevant to your environment:
fetch bizevents , from:now() – 30d| filter event.type == "new trip"| makeTimeseries interval:1h, {profit= avg(profit), discount= avg(discount)}
Dynatrace Intelligence generative AI is capable of inferring that "money made" refers to the profit field, and that "price reduction" refers to the discount field, even if your prompt didn't use the correct field names.
If you don't have environment-aware queries enabled, Dynatrace Intelligence generative AI will try to refer to the fields by the names you provided. The following, incorrect DQL would be generated since the fields don't exist in your environment:
fetch bizevents, from:now() – 30d| filter event.type == "new trip"| makeTimeseries interval:1h, {avg_money_made = avg(money_made), avg_price_reduction = avg(price_reduction)}
Alternatively, you could ask Dynatrace Intelligence generative AI the following question: "On average, how long does it take customers to book new trips?"
If you have environment-aware queries enabled, the following DQL will be generated, providing you with results relevant to your environment:
timeseries avg(new_trip_booking_duration)
If you don't have environment-aware queries enabled, you'll likely get an error message since Dynatrace Intelligence generative AI would be unable to correctly map your question to your custom metric key. In this case, our generative AI can't provide a valid DQL query because it can't find a matching generic, built-in metric.
User-based data access
Since Dynatrace Intelligence generative AI respects user privileges, it may provide different responses to different users based on their access rights.
How are NL2DQL responses generated?
Dynatrace Intelligence generative AI NL2DQL response process can be summarized in 4 steps.
- Dynatrace Intelligence generative AI receives a request from a user.
- If the request is well-formulated and recognized (see Dynatrace Intelligence agentic and generative AI - Tips for writing better prompts for more information), Dynatrace Intelligence generative AI matches the user request with the Dynatrace-owned content, such as documentation and curated query examples, and passes the prompt to LLM.
If you have enabled environment-aware queries, the relevant data fragments will be used enrich the prompt alongside Dynatrace-owned content.
- The LLM generates a response and checks if the DQL is valid.
- The response is returned to the relevant app, Notebooks or Dashboards, and the output is displayed to the user.
Give feedback
To help us improve Dynatrace Intelligence generative AI, you can provide feedback directly from your notebook or dashboard. Under the prompt box:
- Select
 if Dynatrace Intelligence generative AI has interpreted your prompt correctly and has generated and run a DQL query that meets your expectations.
 - Select
 if Dynatrace Intelligence generative AI has generated and run a DQL query that has failed to meet your expectations or has incorrectly interpreted your prompt. Please provide additional context for us to understand how we can improve this functionality to meet your needs and expectations.
Do not share personal or confidential information in your feedback.
Related topics
NotebooksDashboards