On-demand synthetic monitor executions for CI/CD
- Dynatrace Classic
- Explanation
- 17-min read
ActiveGate version 1.233+
In addition to scheduling synthetic monitor executions at regular intervals (in Frequency and locations settings), you can also trigger on-demand executions for browser as well as HTTP monitors. You can even trigger on-demand executions of autocreated HTTP monitors for credential synchronization. In the Dynatrace web UI, select On-demand execution at the top of a monitor's details page.

You can also use the powerful Synthetic - On-demand monitor executions API to trigger executions of multiple monitors and retrieve the results. On-demand execution requests take precedence over your scheduled executions and are sent to the top of the request queue.
You can trigger on-demand executions from any assigned or unassigned location via the web UI or the API.
During synthetic monitor creation and in edit mode, you can also set up a monitor to be executed on demand only—select the On demand only frequency.

On-demand executions, with their powerful features, are a valuable tool in your CI/CD strategy:
- Monitors can be executed on demand from any location, public or private.
- On-demand execution results may be included or excluded from overall monitor results.
- Executions may be included or excluded from problem detection.
- Executions can be triggered via the web UI or API.
These executions can validate that a new deployment of your software is successful and can be integrated with build tools like Jenkins or Keptn.
On-demand executions are also very valuable as quick monitor tests, for example, to test a monitor after developing a complex script. Likewise, such executions can verify that a fix for a Dynatrace-detected problem was effective, for example, if you added host memory or reverted to an older application version.
With their ability to be included or excluded from overall monitor results and problem detection, on-demand executions offer many more options than local playback of browser clickpaths.
UI-based on-demand executions
The On-demand execution button on synthetic monitor details pages allows you to trigger executions for the selected monitor from all or a selected location. It also displays a list of all on-demand executions for the monitor over the preceding six hours, triggered by any user via the web UI or API.
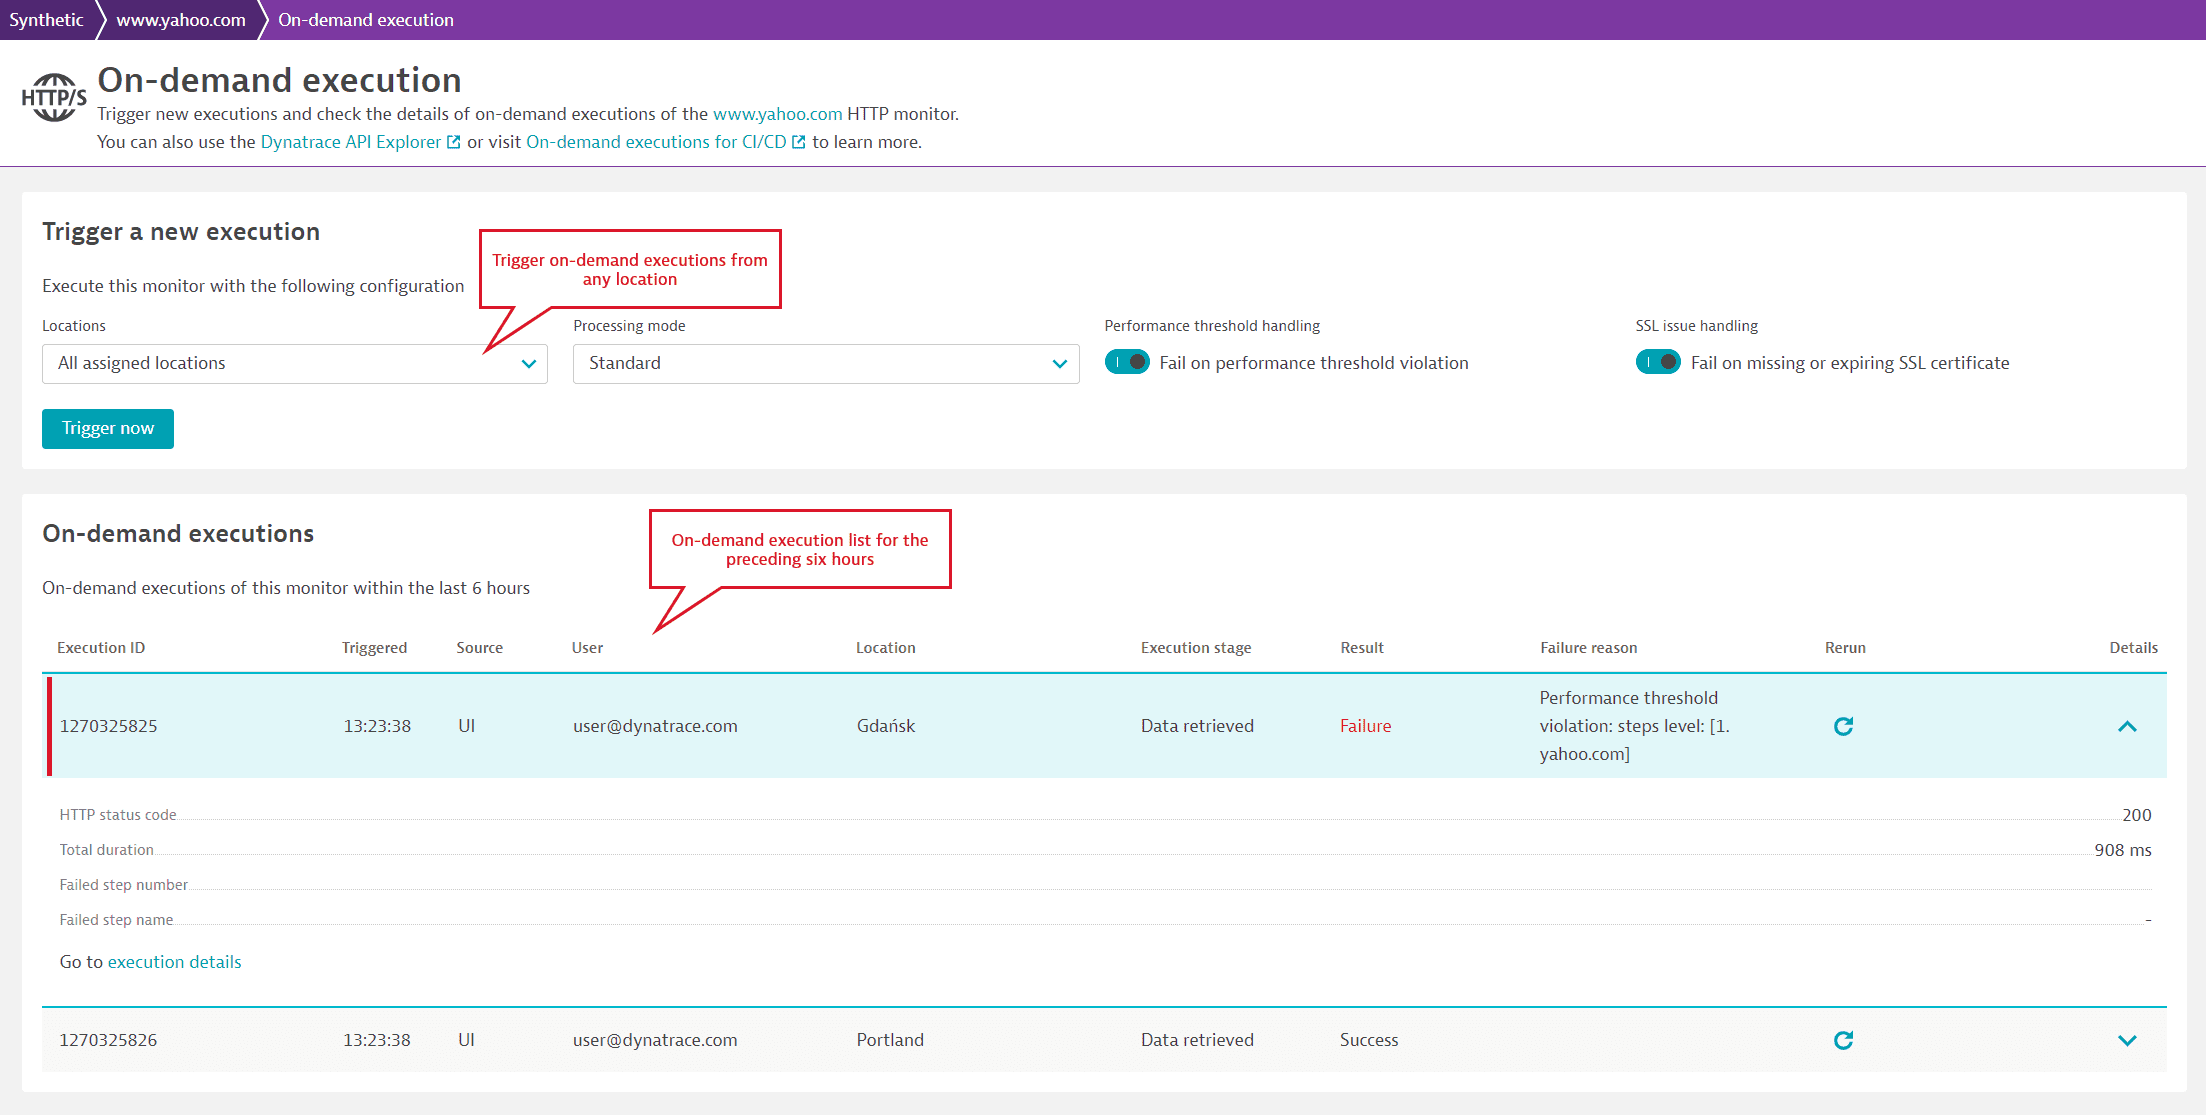
Trigger an execution
Any user with the View environment permission at the environment or management-zone level can trigger an execution via the UI.
Even if you disable scheduled synthetic monitor execution during maintenance windows, you can still execute monitors on demand.
-
Select On-demand execution at the top of the monitor's details page.
-
You are directed to the On-demand execution page. Select All assigned locations or any assigned or unassigned public or private location.
-
Select a Processing mode—note that this applies to all executions if you select all locations.
- Standard (default)—the executions contribute to problem detection and availability and performance statistics. For browser monitors, you can view data points on the Multidimensional analysis page. For HTTP monitors, you can access execution results when you Analyze execution details.
- Disable problem detection—the executions contribute to availability and performance statistics but not to problem detection. For browser monitors, data points appear on the Multidimensional analysis page; for HTTP monitors, you can view execution results when you Analyze execution details.
- Execution details only—the executions do not contribute to availability and performance statistics or to problem detection. For HTTP monitors, you can still access results when you Analyze execution details; for browser monitors, these data points appear on the Multidimensional analysis page.
Note that for all processing modes, executions are visible in the list of on-demand executions in the web UI and retrieved via the on-demand executions API. Summary and detailed execution information is available for six hours via the API.
-
Fail on performance threshold violation—by default, on-demand executions fail when they violate a performance threshold, given that their main purpose is to validate new software versions in your CI/CD pipeline. However, you can disable this setting so that on-demand executions behave like regularly scheduled executions (that is, performance threshold violations do not cause monitors to fail).
-
HTTP monitors only Fail on missing or expiring SSL certificate—fail the monitor if one or more of its requests encounters an expired, missing, or expiring SSL certificate.
This setting only works if SSL expiration date verification has already been enabled for an HTTP request in monitor settings; it uses the request-level setting to check for SSL certificate validity within the specified number of days.
If your monitor has multiple requests with different settings for SSL certificate validity, Fail on missing or expiring SSL certificate checks and honors each setting.
-
Browser monitors only Take screenshot on successful execution—capture screenshots upon success from public or private locations; this setting is disabled by default. When you enable this setting, screenshots upon success are captured even if the monitor exceeds a performance threshold. If you trigger executions from all locations, screenshots upon success are captured from the first location. You can also capture screenshots upon success for executions triggered via the API.
Note that screenshots are automatically captured upon failure.
-
Select Trigger now—you see a summary dialog listing the execution locations; the execution list displays new entries for the triggered executions. The Execution stage initially is
Triggered.Any change you make to monitor script (configuration) is immediately available for on-demand executions on public or private locations.
Note that executions might not all begin at the same time from different locations—executions might take longer to begin from public locations than from private locations. See additional information on throttling below.
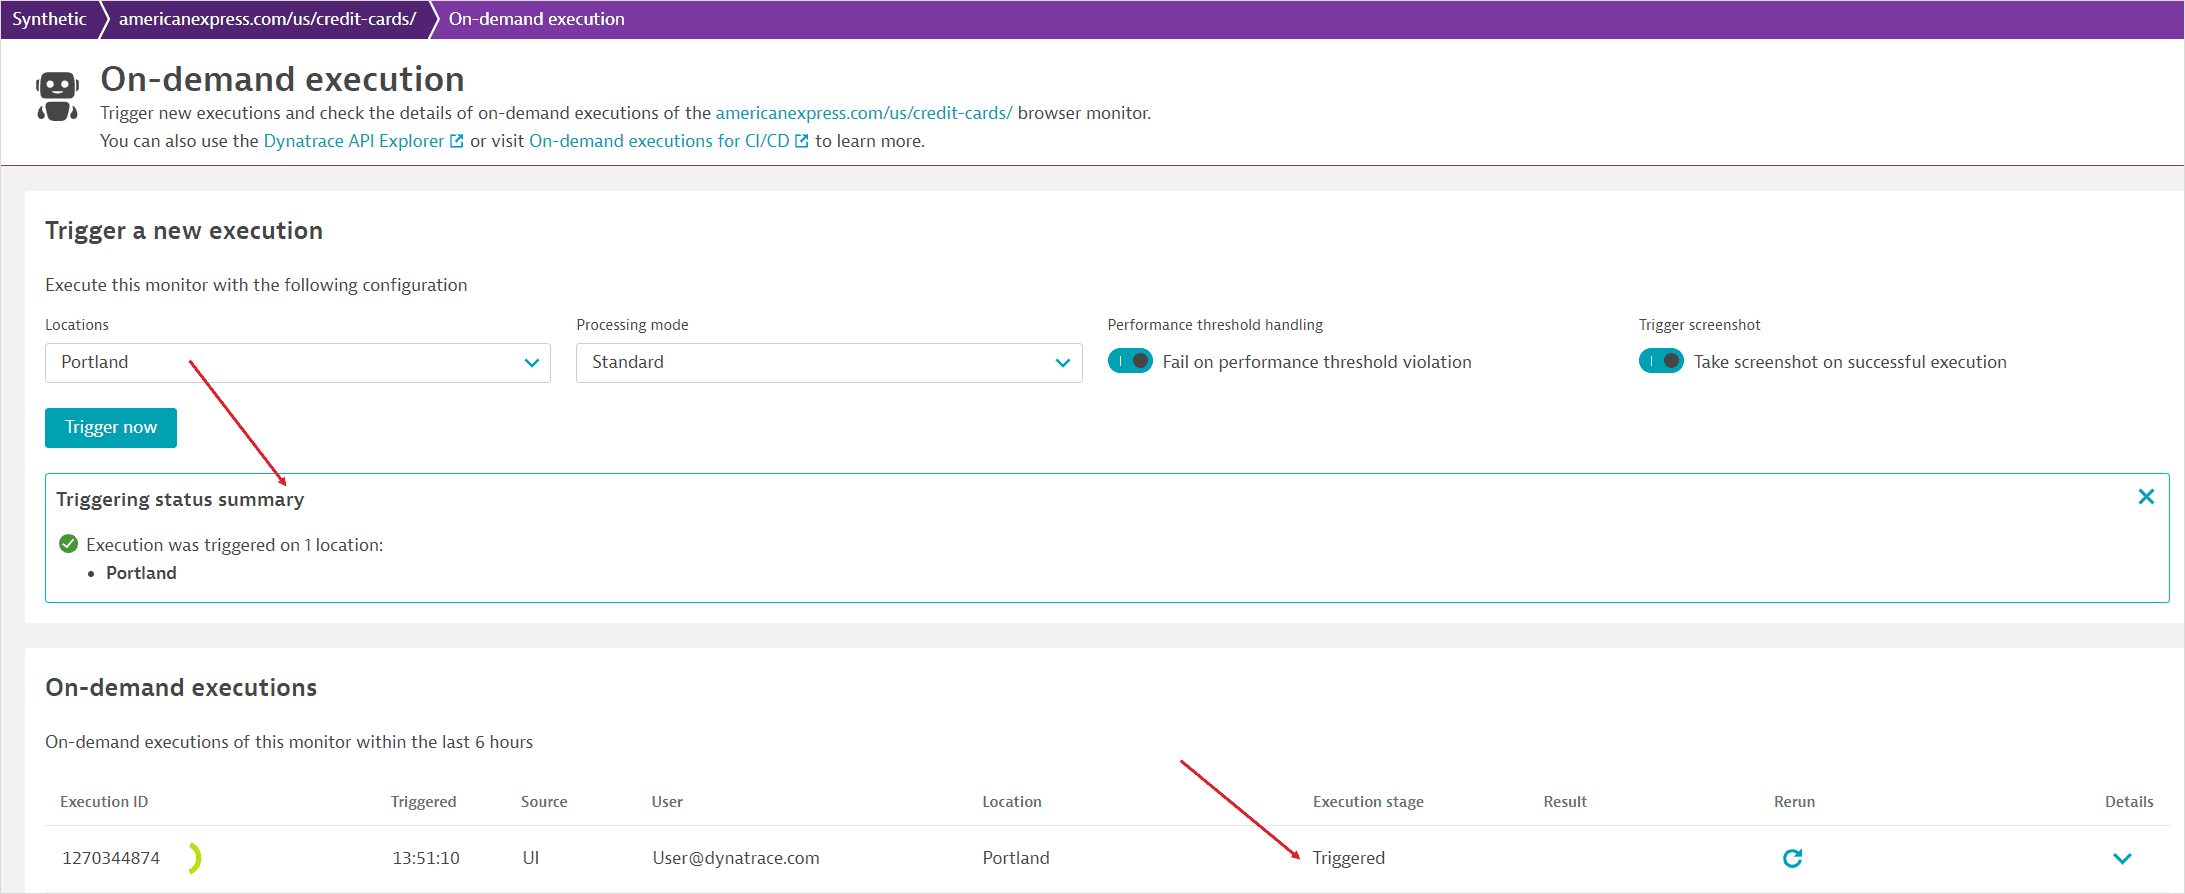 Triggered execution
Throttling and limits
-
There is a mandatory gap per user of 60 seconds between consecutive on-demand executions of a monitor from the same location (whether triggered via the web UI or API).
Examples of throttling
All these examples assume execution from the same location.
- User A triggers a monitor via API within 60 seconds of triggering the same monitor via UI—throttled.
- User B triggers a monitor via API within 60 seconds of user A triggering the same monitor via UI—no throttling.
- User B triggers a monitor via UI within 60 seconds of user A triggering the same monitor via UI—no throttling.
- User B triggers a monitor via API within 60 seconds of user A triggering the same monitor via API—no throttling.
-
When triggering multiple on-demand executions via the API, there is a limit of 100 executions per batch.
-
There's also a limit of 5000 on-demand executions per minute for a Dynatrace environment.
-
You can define up to 64 key-value pairs of metadata per batch, where keys and values can each be up to 1024 characters.
-
When specifying repeated on-demand executions per location, the maximum execution count is 10.
Failure to be triggered
On-demand executions might not be successfully triggered for various reasons, for example, when a monitor is disabled, a location is down, or when throttling is in effect for a monitor on a given location.
There are several additional reasons that on-demand executions might not be successfully triggered via the API: monitor deletion, incorrect specification of monitor or location IDs, incorrect specification of related service or application IDs, location deletion, problems with the public Synthetic infrastructure, or problems with your Dynatrace monitoring environment.
If an execution can't be successfully triggered via the UI, the reasons are shown in the Triggering status summary after you select Trigger now. The Execution stage in the execution list is Not triggered. Details of executions not triggered via the API are returned in the triggeringProblemsCount and triggeringProblemsDetails response parameters for the POST request.
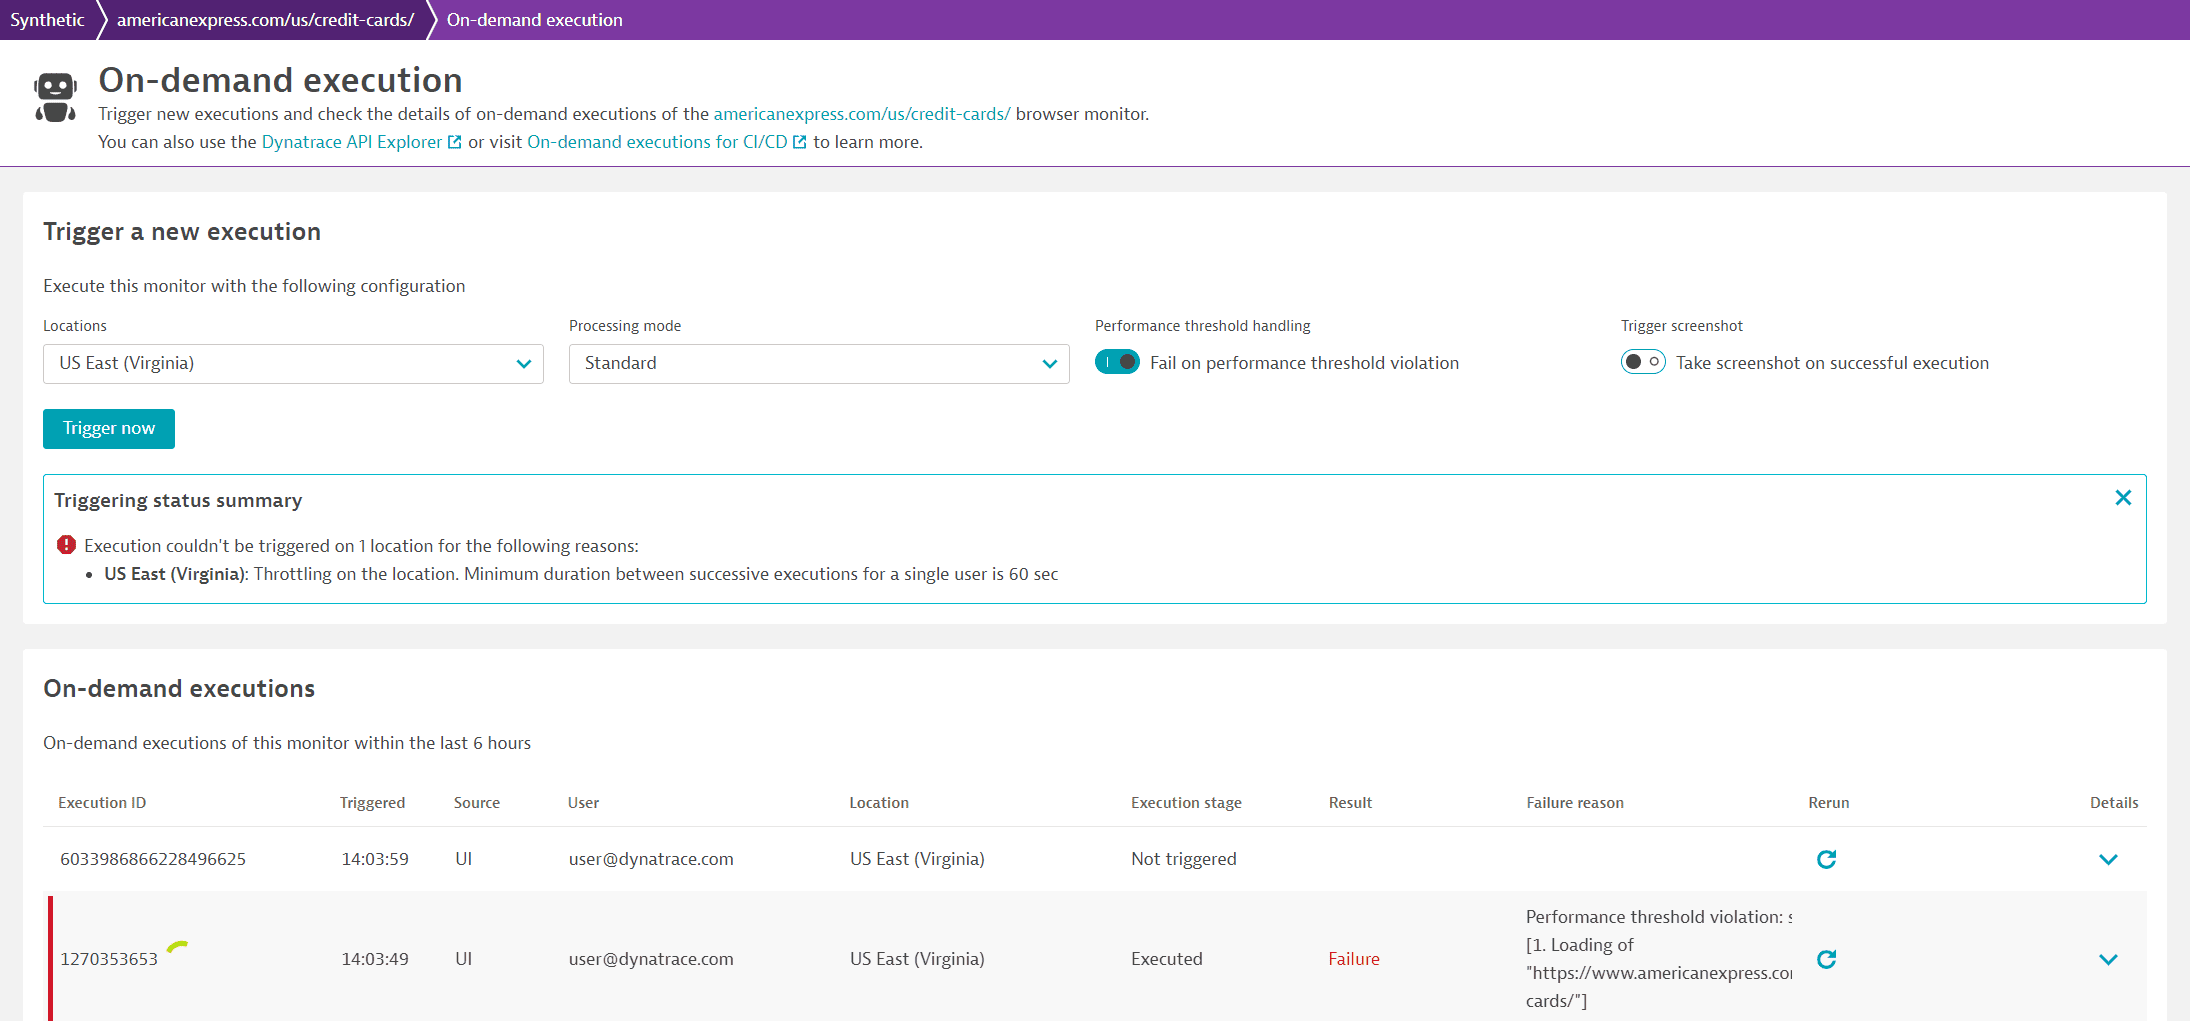
Executions that can't be triggered are different from executions that are triggered but can't be executed—see the API section below for information.
List of executions
The list of executions shows all on-demand executions (triggered by any user via the web UI or API) for a given monitor within the last six hours.

- The Execution ID is a unique ID assigned to each execution; if you trigger executions from all locations, each location's execution has a different ID.
- The Triggered column shows the start time of the execution in the logged-in user's time zone.
- Source shows whether the execution was triggered via the web
UIor theAPI. - The User column shows the Dynatrace user ID of the user who triggered the execution.
- The Location column shows the name of the public or private location from which the monitor was executed.
- Execution stage identifies the different stages of the on-demand execution. The initial value is
Triggered(orNot triggered). When execution is complete, the value changes toExecuted. Basic results such as duration and HTTP status code are available at this stage. The progress spinner continues to be displayed at theExecutedstage until detailed results are available and the value changes toData retrieved. If multiple sequential executions are triggered per location, the first execution is markedTriggered; the remaining executions are markedWaiting.
- The Result column displays whether the execution was a
SuccessorFailure(with an accompanying Failure reason). - You can Rerun
an execution with the exact configuration defined, for example, with metadata defined via the API. Besides metadata, other execution parameters replicated are the processing mode, failure for violating a performance threshold, failure due to an SSL certificate issue, and screenshot capture upon success.
- Select the expand button
in the Details column to view execution duration, batch metadata like key-value pairs (available via API only), and a link to results.
Results
When the Execution stage in the list of executions changes to Data retrieved, you can follow the execution details link to view detailed results for the browser or HTTP monitor that was executed.
For browser monitors, you're directed to the Multidimensional analysis page with the data point selected in the scatter plot. On-demand executions are identifiable by shape in the scatter plot as well as by an annotation in the list of data points.
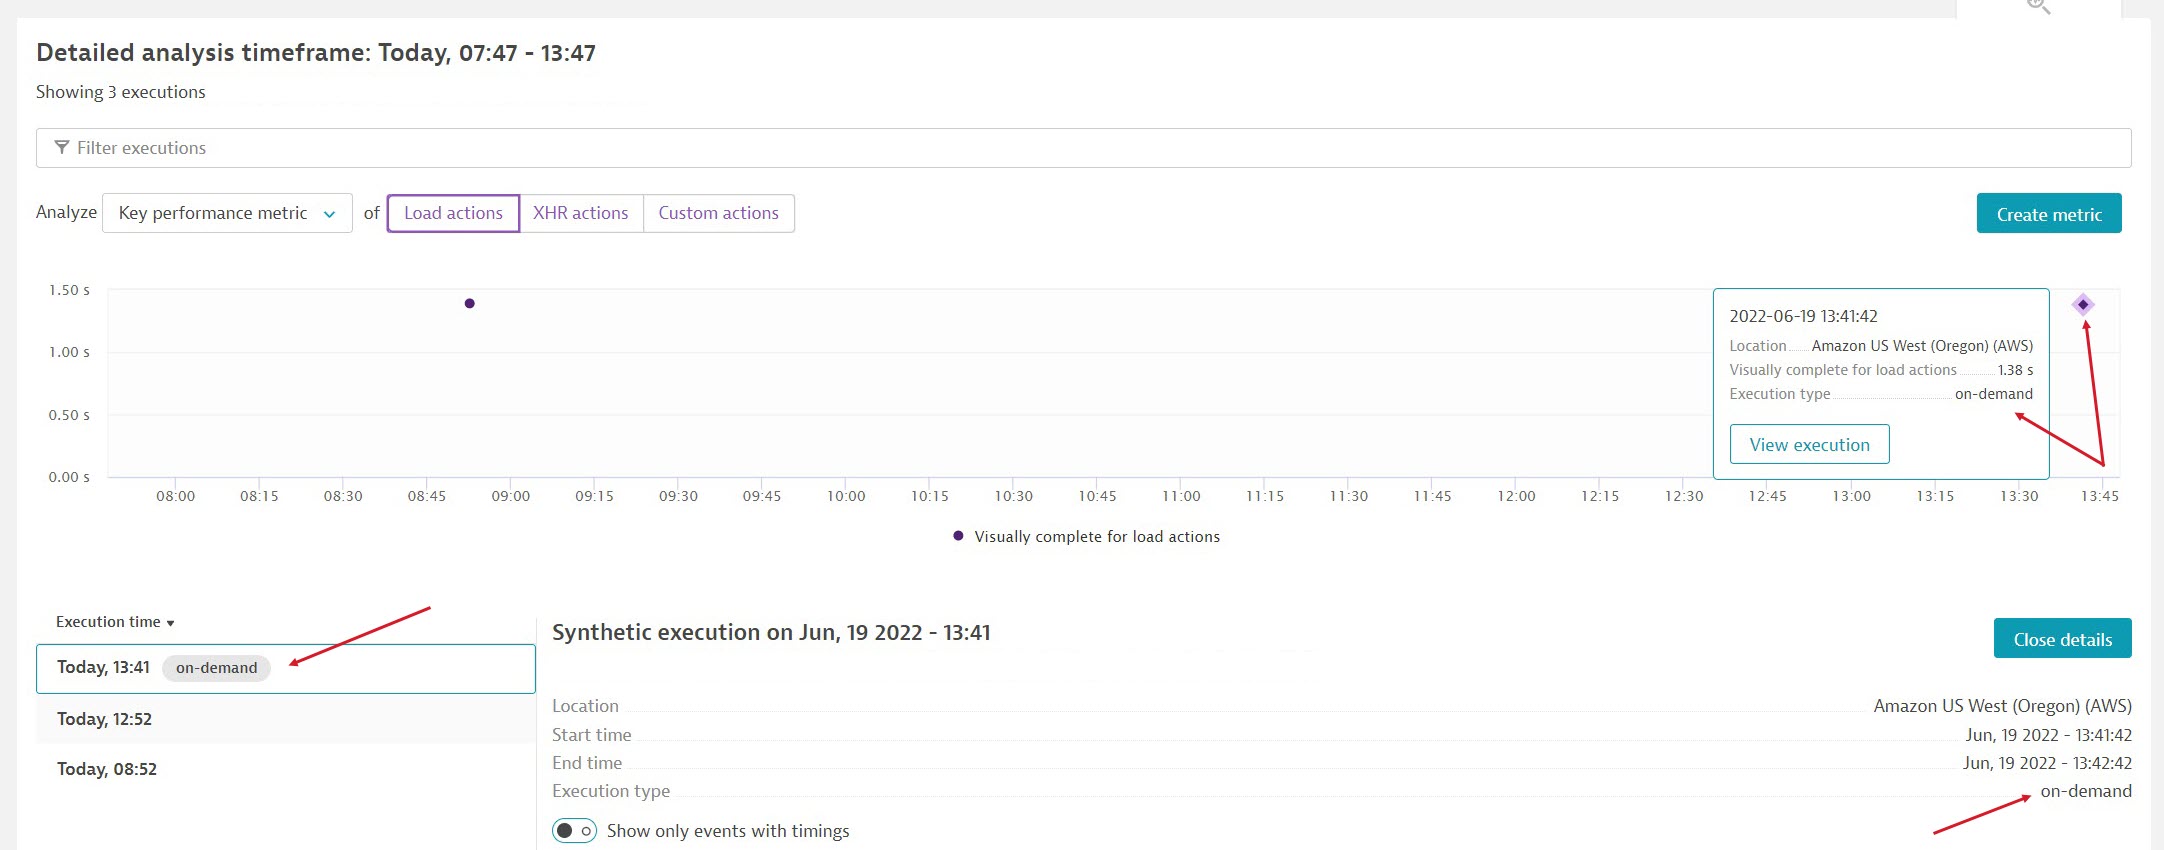
Screenshot collection for on-demand browser monitor executions is the same as for scheduled executions. However, you can enable screenshot collection upon success via the UI as well as POST requests via API.
For HTTP monitors, you're directed to the On-demand execution tab of the Analyze execution details page. You can also access this tab by selecting Analyze execution details from the HTTP monitor details page. Select an on-demand Execution from the dropdown list to view its details.
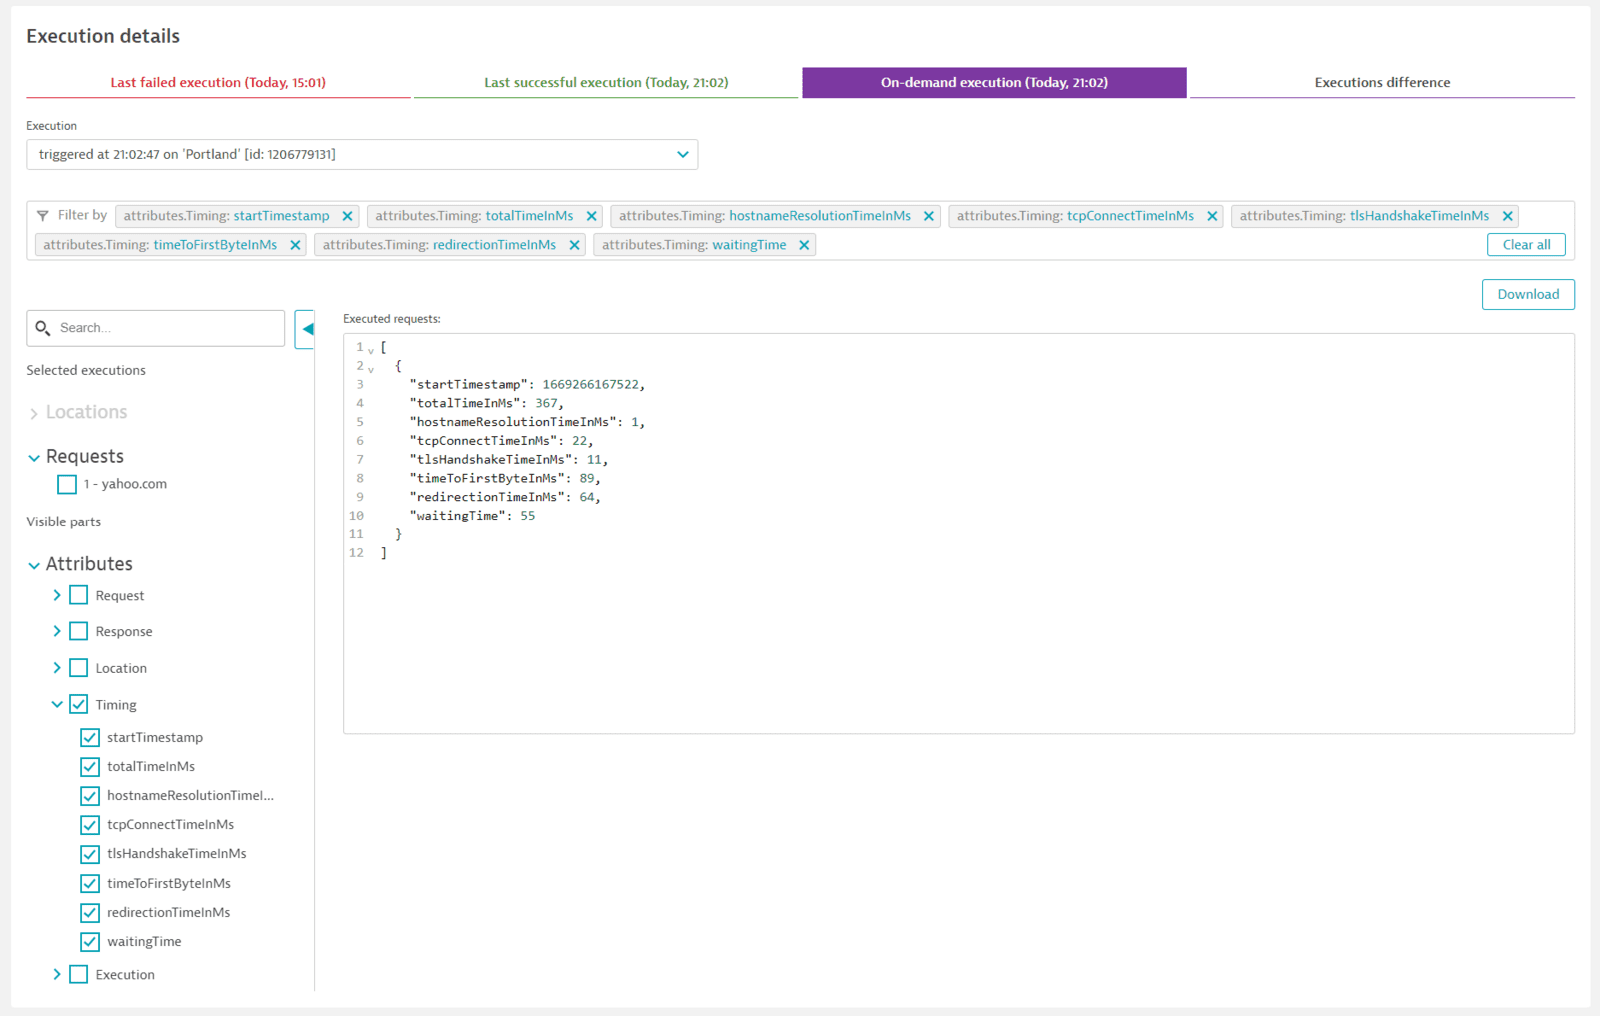
The On-demand execution tab is overwritten with each on-demand execution. If the on-demand executions are in Standard or Disable problem detection modes, details are also written to the last failed/successful execution tabs. Note that in these modes, if you fail a monitor for violating a performance threshold, the execution appears in the tabs for successful and on-demand executions.
API: Synthetic - On-demand monitor executions
Check the section on throttling above for on-demand execution limits via the web UI and API.
For more information, check documentation on the Synthetic monitor executions API v2. You can trigger a batch execution, list on-demand executions, check basic as well as detailed results of a single execution, and check batch execution results.
API-based on-demand executions offer greater flexibility and scalability than the UI. The Synthetic - On-demand monitor executions API offers:
-
The ability to execute multiple monitors on demand (batch execution) by specifying monitor IDs, and, optionally, location IDs. If you don't specify locations, a monitor is executed from all assigned locations. This ability is only available via API.
-
The ability to execute monitors from any location. In the POST request for triggering on-demand executions, each specified monitor is executed from the specified locations (or all assigned locations if none are specified).
-
ActiveGate version 1.259+ The ability to specify an execution count for repeated executions per location, which is helpful for quality gates and load tests. This ability is only available via API. The
executionCountparameter allows you to specify the number of executions per location for each monitor; the maximum value is 10; if there is no value, the monitor is executed once per location. Executions can be triggered sequentially (repeatModeisSEQUENTIAL) or in parallel (repeatModeisPARALLEL). The default mode is sequential.In sequential mode, each execution automatically references the following execution, if any, with the
nextExecutionIdparameter. When you trigger multiple sequential executions on a location, the first execution is in theTriggeredstage while the others are markedWaiting. Executions on each location are independent of each other.- If a sequential execution times out on a location, any following executions on that location are not triggered.
- Note that execution IDs in
nextExecutionIdare sequential for public locations and randomly generated for private locations. - Monitor script or credential changes after a batch of sequential executions has been triggered do not affect any remaining executions. So if another user changes a script you are executing sequentially, the script changes are not reflected in any remaining executions.
-
ActiveGate version 1.259+ The ability to partially override the monitor script and provide custom parameter values specifically for on-demand execution, which simplifies the reconfiguration and testing of synthetic monitors. This ability is only available via API. The
customizedScriptparameter allows you to listrequests(HTTP monitors) orevents(browser monitors) with customizations per request or event. For HTTP monitors, you see which parameters had custom values when you Analyze execution details.The following parameters can be customized for HTTP monitors
urlrequestBodyvalidationpreProcessingScriptpostProcessingScriptrequestTimeoutauthenticationconfigurationrequestHeadersacceptAnyCertificatefollowRedirects
The following event types can be customized for browser monitors
- Navigate
- Click
- JavaScript
- Keystroke
- Tap
- Select option
- Cookie
You can optionally specify a
sequenceIdfor the order of the request or event in the monitor script. For example, use"sequenceId": "3"to specify changes to the third event in a browser monitor. If you don't specify asequenceId, the modifications apply to the first request or event that hasn't been referenced by a sequence ID in the API request. See examples below.- Any such script changes are for the purpose of on-demand execution only and do not persist thereafter.
- You cannot change or reorder the number of requests or events.
- You cannot change the Name of requests or events (
descriptionin script mode). - You cannot change the request type (for example, GET) or event type (for example, Navigate).
- You cannot add a pre- or post-processing script to an HTTP monitor that has neither.
Example: HTTP monitor with custom URL for a single request
As no sequence ID is specified, the URL override in this example applies to the first HTTP request.
{"monitors": [{"monitorId": "HTTP_CHECK-C608F75BF82E5B22","customizedScript": {"requests": [{"url": "https://www.yourdomain.com"}]}}]}Example: HTTP monitor with overrides for two requests
As no sequence ID is specified, the URL override and pre-execution script with the
api.fail()method apply to the first HTTP request. Note that you can only override the pre- or post-execution script for a monitor that already has one such script defined. For the third request where the sequence ID has been specified, a validation rule has been added.{"monitors": [{"monitorId": "HTTP_CHECK-6349B98E1CD87352","customizedScript": {"requests": [{"url": "https://www.somepage.org","preProcessingScript": "if (response.getResponseBody().includes(\"error\")) {api.fail(\"HTTP failing monitor.\");}"},{"sequenceId": "3","validation": {"rules": [{"value": "=201","passIfFound": "true"}]}}]}}]}Example: Browser monitor with custom URL for Navigate event
As no sequence ID is specified, the URL override in this example applies to the first Navigate event.
{"takeScreenshotsOnSuccess": true,"monitors": [{"monitorId": "SYNTHETIC_TEST-114F1C18CF07CD1D","customizedScript": {"events": [{"type": "navigate","url": "www.yourdomain.com"}]}}]} -
The ability to execute a group of monitors on demand by specifying common tags and/or IDs of related services or applications. Note that all specified conditions must match for a monitor to be executed on demand. This ability is only available via API.
If you specify three monitors by ID and one tag in your POST request, each of the three monitors plus all monitors matching the tag will be executed.
-
Automatic assignment of a batch ID for all executions of the POST method, whether for a single monitor or multiple monitors. This enables the retrieval of results by batch ID as well.
-
The ability to define custom key-value pairs, for example, to identify application versions, as part of batch
metadata. This ability is only available via API. You can define up to 64 pairs per batch, where keys and values can each be up to 1024 characters. Key-value metadata is available in individual as well as batch execution results retrieved via the API and is displayed in the web UI. -
The capture of screenshots upon success for browser monitors from public or private locations by setting
"takeScreenshotsOnSuccess": truein the POST request (the default isfalse). Screenshots upon success are captured from the first location specified for each monitor ID. If no location is specified (for example, when you use tags to define a list of monitors), screenshots are captured from any of the locations assigned to a monitor.Note that screenshots are automatically captured upon failure. But if a monitor fails because of a performance threshold violation, it's still considered available, and no screenshots are captured; however, you can enable
takeScreenshotsOnSuccess. -
The ability to fail an on-demand HTTP monitor execution if the SSL certificate is missing, expired, or expiring (
failOnSslWarningparameter.) -
The ability to stop triggering all executions in a batch if there is a problem with triggering any execution (
stopOnProblemparameter), for example, if the monitor ID is incorrect/missing or the monitor is deleted. This ability is only available via API. -
Retrieval of the list of on-demand executions (triggered via the web UI or API by all users in your environment) in the preceding six hours. The list includes execution IDs for each execution. You can filter this list by:
- Execution and data-delivery timestamps
- Batch IDs
- Monitor IDs
- Location IDs
- User IDs
-
Retrieval of the basic as well as more detailed results of an execution (for which you provide an execution ID).
Basic results are best suited for CI/CD purposes and include the number of requests/events executed, success/failure result, and some key metrics. For example, basic results for HTTP monitors report total request size (for all requests taken together), time to first byte, TLS handshake time, TCP connect time, DNS lookup time, and the final HTTP status code.
Detailed results are more suitable for troubleshooting. For HTTP monitors, this is the entire set of results visible in the web UI when you opt to Analyze execution details.
-
Batch retrieval of results when you provide a batch ID.
Batch results include information on executions that were triggered and those that resulted in an outcome.
Note that the
executedCountis the number of executions that resulted in success or failure.failedToExecuteCountis the number of executions that were triggered but for which results are not available for technical reasons (such as a problem with the ActiveGate or Synthetic engine or results that could not be sent to the Dynatrace Cluster).executedCount+failedToExecuteCount=triggeredCount. -
Granular permissions for triggering and retrieving data for on-demand executions.
To trigger executions (POST), you need rights to create monitors (
ExternalSyntheticIntegrationtoken scope) or thesyntheticExecutions.writetoken scope, which enables you to trigger executions but not create new monitors.To retrieve data (GET), you need any of the
ExternalSyntheticIntegration,ReadSyntheticData, orsyntheticExecutions.readtoken scopes.
Best practices
- When you override any credentials in a monitor script, for example, for the Authorization header, be sure that you have access to the updated credential.
- If you override the URL in a browser monitor Navigate event, it's best not to enable screenshots upon success, as the reference screenshots for the event will be overwritten by ones from the customized URL.
Related topics
 Synthetic Classic