Synthetic alerting overview
- Dynatrace Classic
- Explanation
- 7-min read
Dynatrace synthetic monitors enable you to monitor availability and performance. Whenever a synthetic monitor fails for either an availability or performance issue based on your thresholds, it creates a problem.
You can set up problem notification as follows:
- Specify thresholds.
- Create alerting profiles to determine which problems trigger notifications and when. This allows you to define different levels of urgency and customer impact by varying alert delivery by problem type and duration.
- Define integrations for alert delivery, for example, via email.
- Optional Define maintenance windows.
- Even if you do not set up any integrations, problems are automatically displayed on the Problems page, the Synthetic details page for the affected monitor, and in the Dynatrace mobile app.
- Whether or not you see problems and receive alert notifications during maintenance windows depends on how you configure the maintenance windows.
- You can apply a global setting to always exclude maintenance windows from synthetic availability calculations for the maintenance periods.
The alerting potential of Dynatrace Synthetic Monitoring is fully realized when combined with Real User Monitoring—not only are you notified that there is a problem, but you can also see which real users are impacted and where the root cause of the issue is in your application stack.
Thresholds
Thresholds for generating availability and performance problems are specified in synthetic monitor settings after monitor creation. Go to Synthetic Classic, select your monitor, and then select Edit. See Configure a browser monitor for details.
Be sure to Save changes to monitor settings.
Availability
On the Outage handling tab of monitor Settings, you can opt to set up:
- Global problems when all monitored locations are unavailable (enabled by default) and/or
- Local problems when a specified number of locations experience a given number of consecutive failures
Additionally, you can:
- Enable retry on error for browser monitors.
- Exclude specific HTTP status codes from generating outages/errors in browser monitor settings.
See Configure browser monitors and Synthetic calculations for details about outage problem generation and resolution.
Performance
On the Performance thresholds tab of monitor Settings, you can enable performance thresholds and enter a threshold in seconds for the monitor as a whole and each action.
While recording and editing clickpaths is based on events, performance thresholds are specified for the monitor as a whole and for individual actions. See Number of actions consumed by browser clickpaths for the difference between events and actions.
You specify a static performance time in seconds (to meet an SLA, for example). You can base this number on the displayed average performance over the last 24 hours. Average performance values are displayed for the monitor as a whole as well as for individual events.
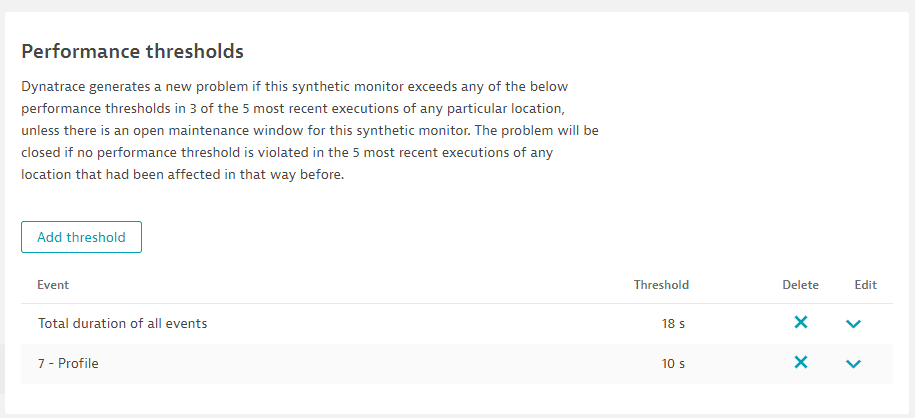
We recommend you set these thresholds at least 24 hours after monitor activation so you can refer to the average performance data displayed here.
See Configure browser monitors and Synthetic calculations for details about performance problem generation and resolution.
Problems
A synthetic monitor in violation of a threshold generates a problem. A monitor in violation of a single availability threshold (global availability or consecutive failures at a selected number of locations) generates one problem, regardless of the number of occurrences. If a monitor violates two thresholds, two problems are generated.
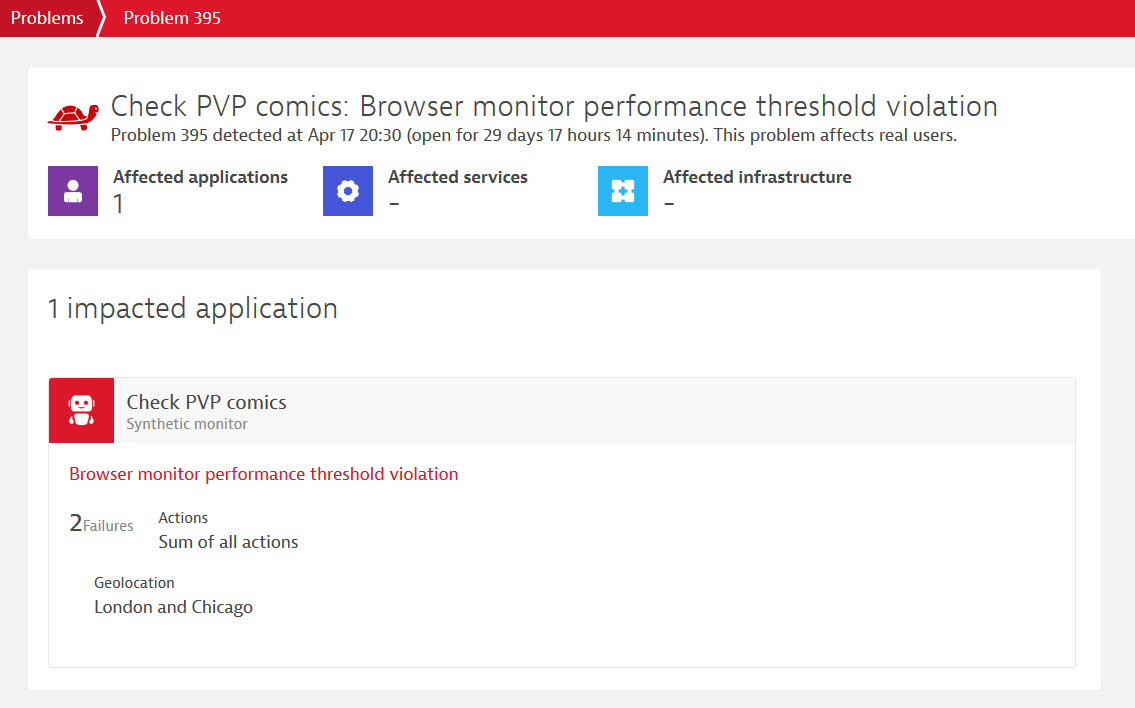
A monitor violating performance thresholds for the monitor as a whole and/or individual actions generates a single problem per location. For example, if your monitor violates thresholds for the sum of all actions as well as an individual action at two different monitoring locations, you see two performance problems, one for each location.
The problem notifications area for active problems is at the upper-right of the Dynatrace web UI. Any monitors with problems are outlined in red in Synthetic Classic.
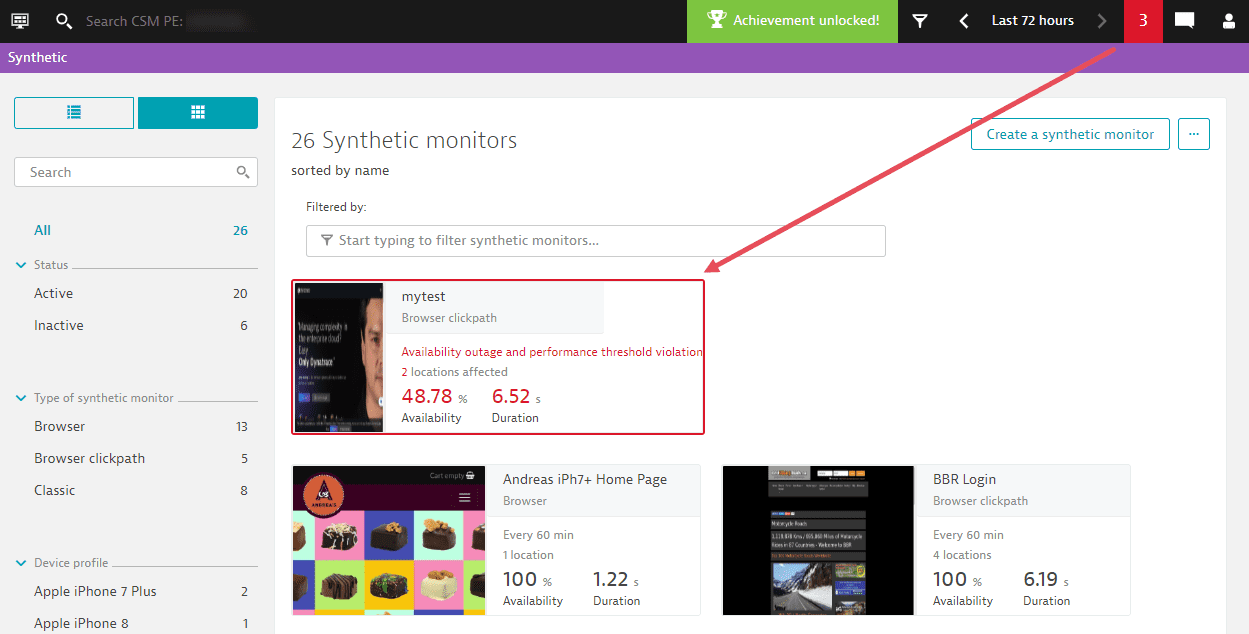
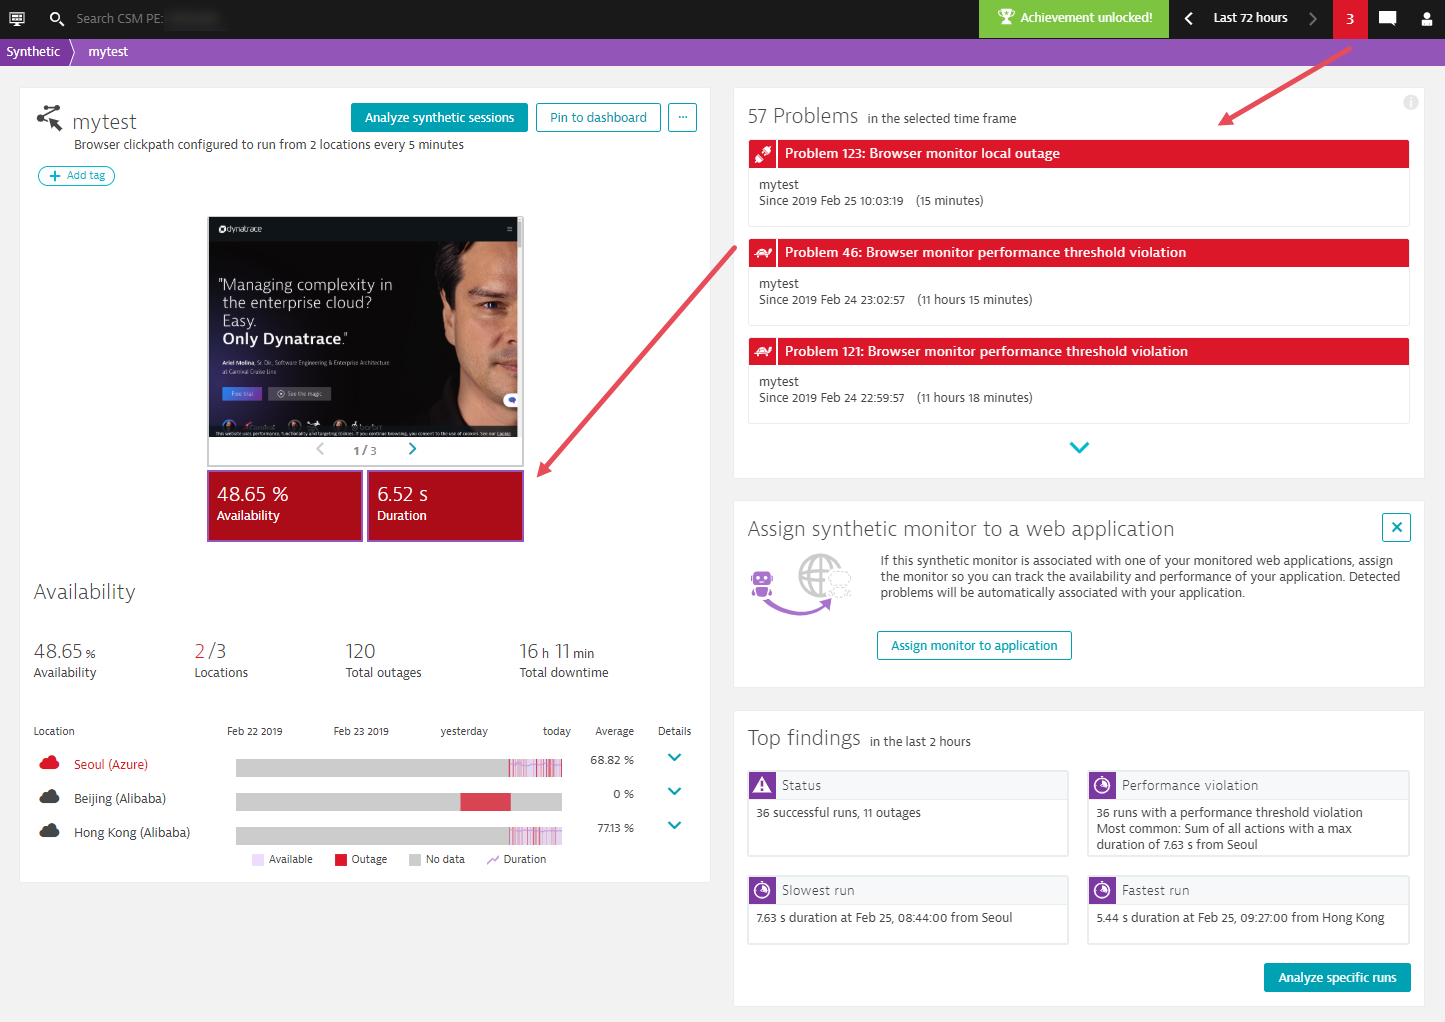
Select the monitor in question to view the details page and a list of its active and resolved problems in the selected time frame. Select a problem to drill through to problem details.
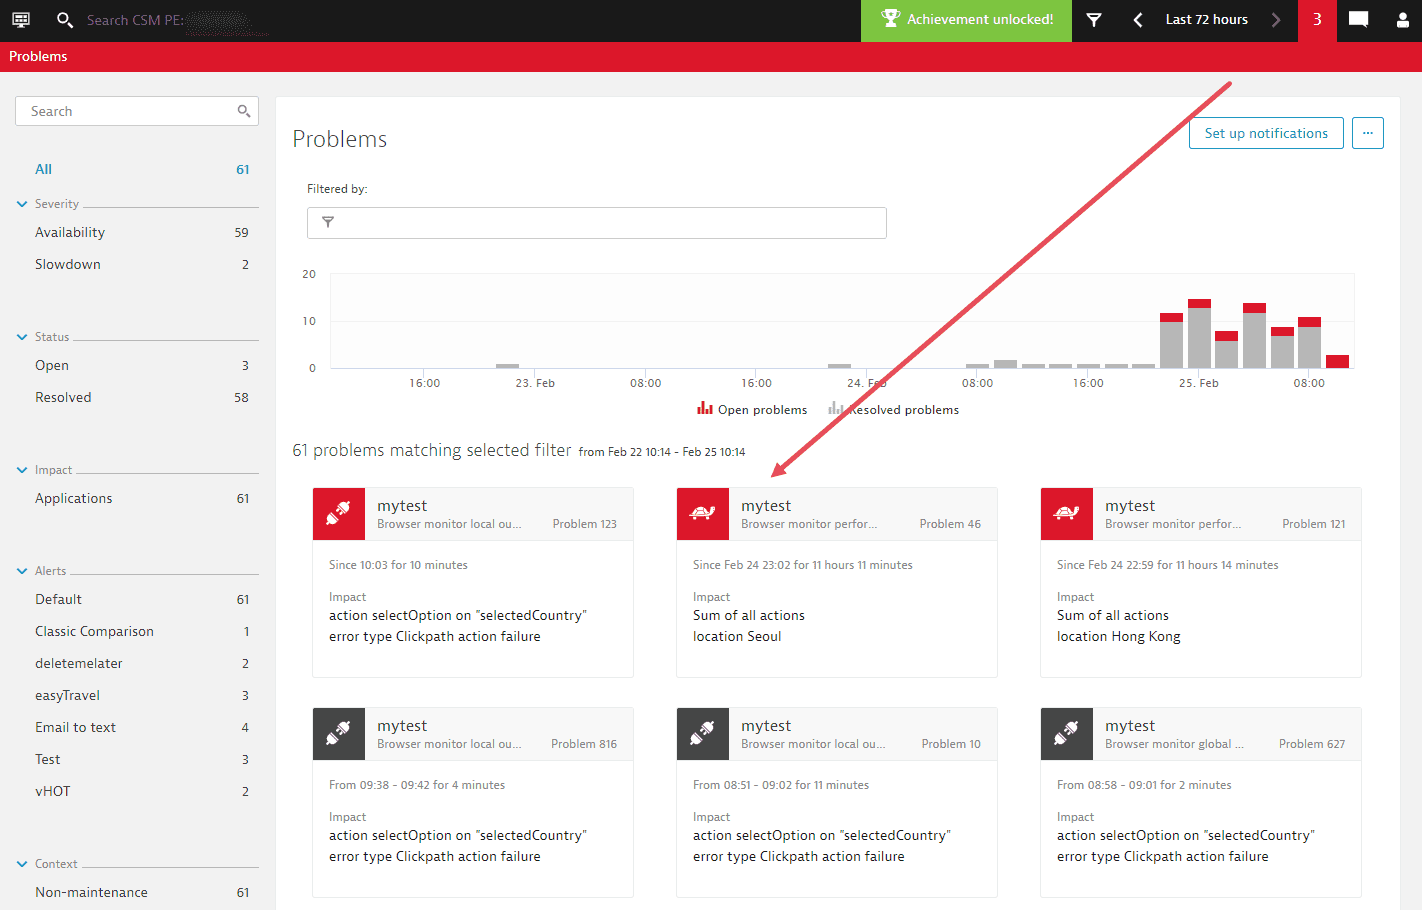
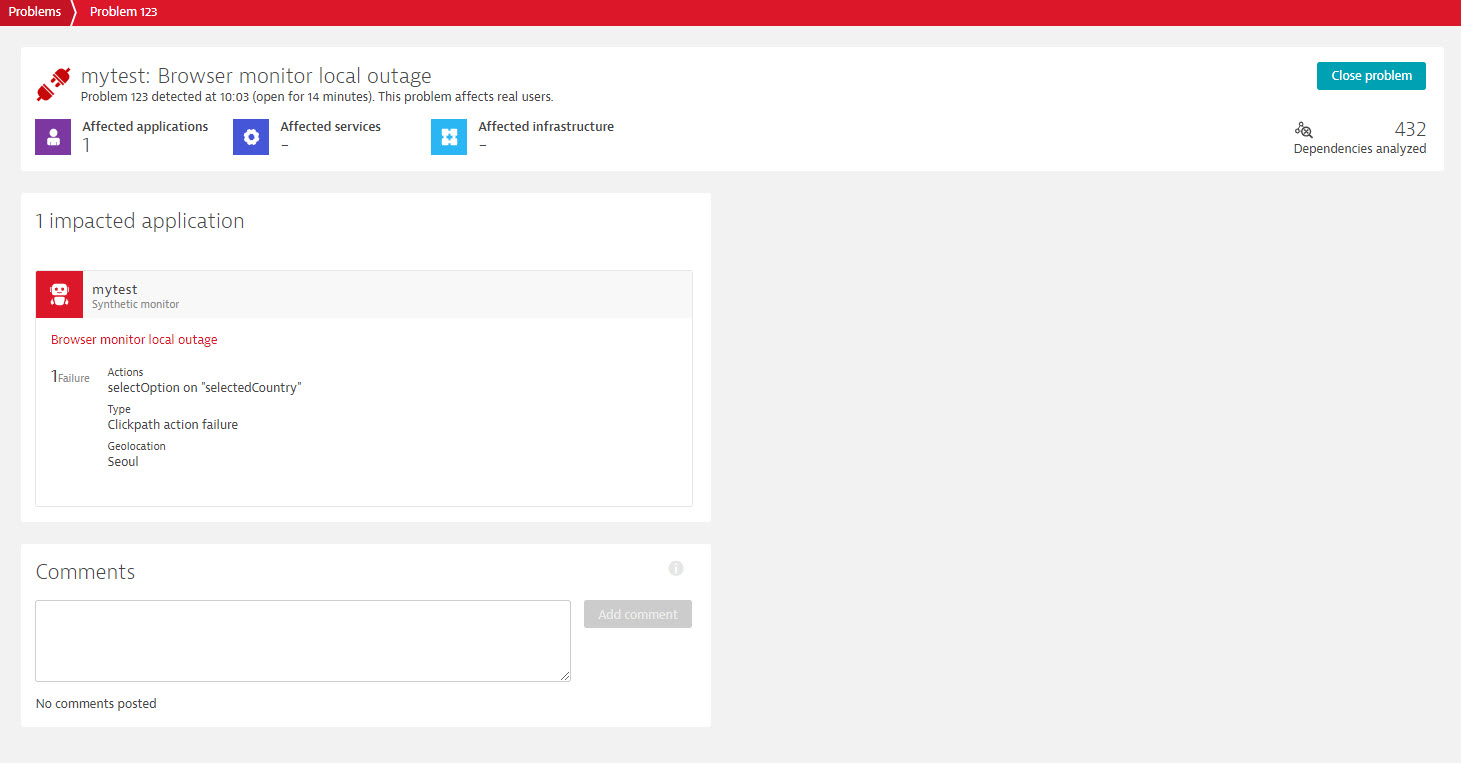
You can also access all problems on the Problems page. The images below show the Problems page and the details for a performance and availability (local outage) problem.
There are three main problem types for browser monitors or HTTP monitors:
- Global outage
- Local outage
- Performance threshold violation
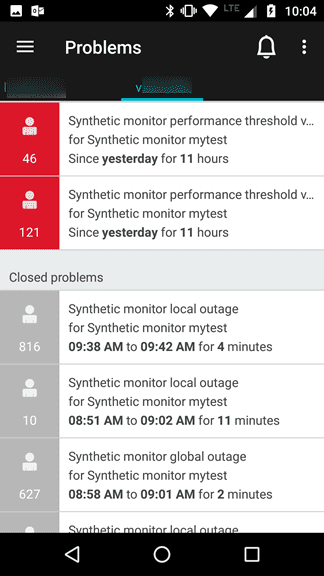
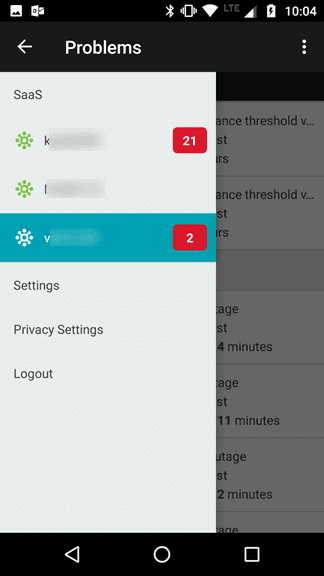
Simply sign in with your credentials to receive push notifications for the environments you have access to in the Dynatrace mobile app for iOS and Android.
Alerting profiles
Alerting profiles allow you to control exactly which conditions result in problem notifications and when. Go to Settings > Alerting > Problem alerting profiles.
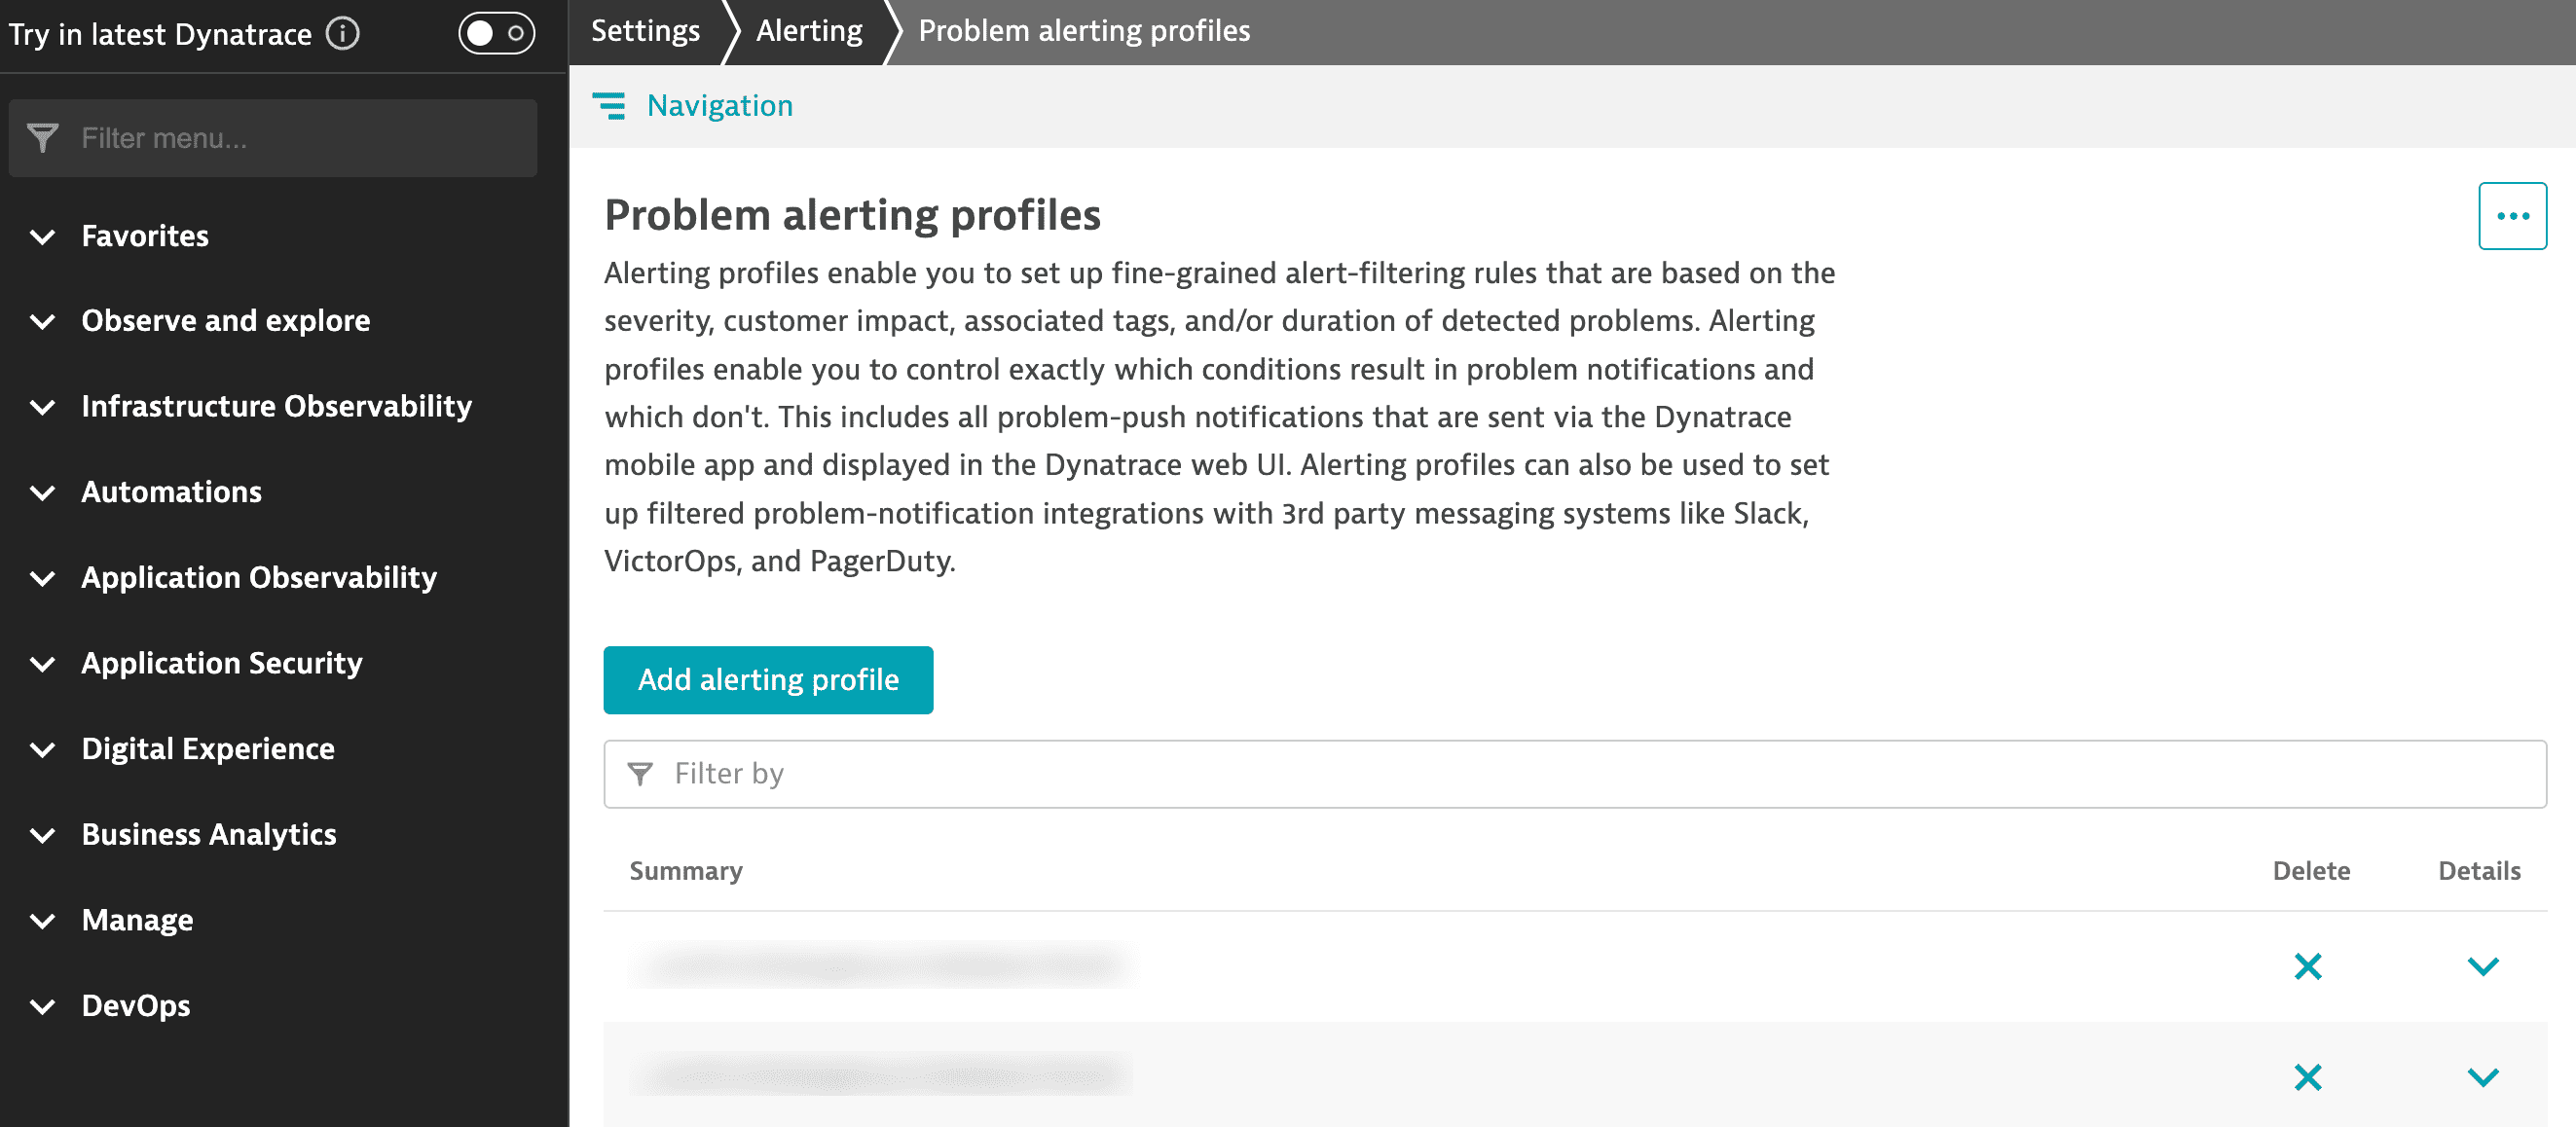
From here, you can name and create a new alerting profile (select Add alerting profile). Expand an existing profile to edit it. Alerting profiles created here are listed to choose from when setting up integrations for problem notifications.
Availability and Slowdown alerts (Problem severity level) pertain to Synthetic Monitoring.
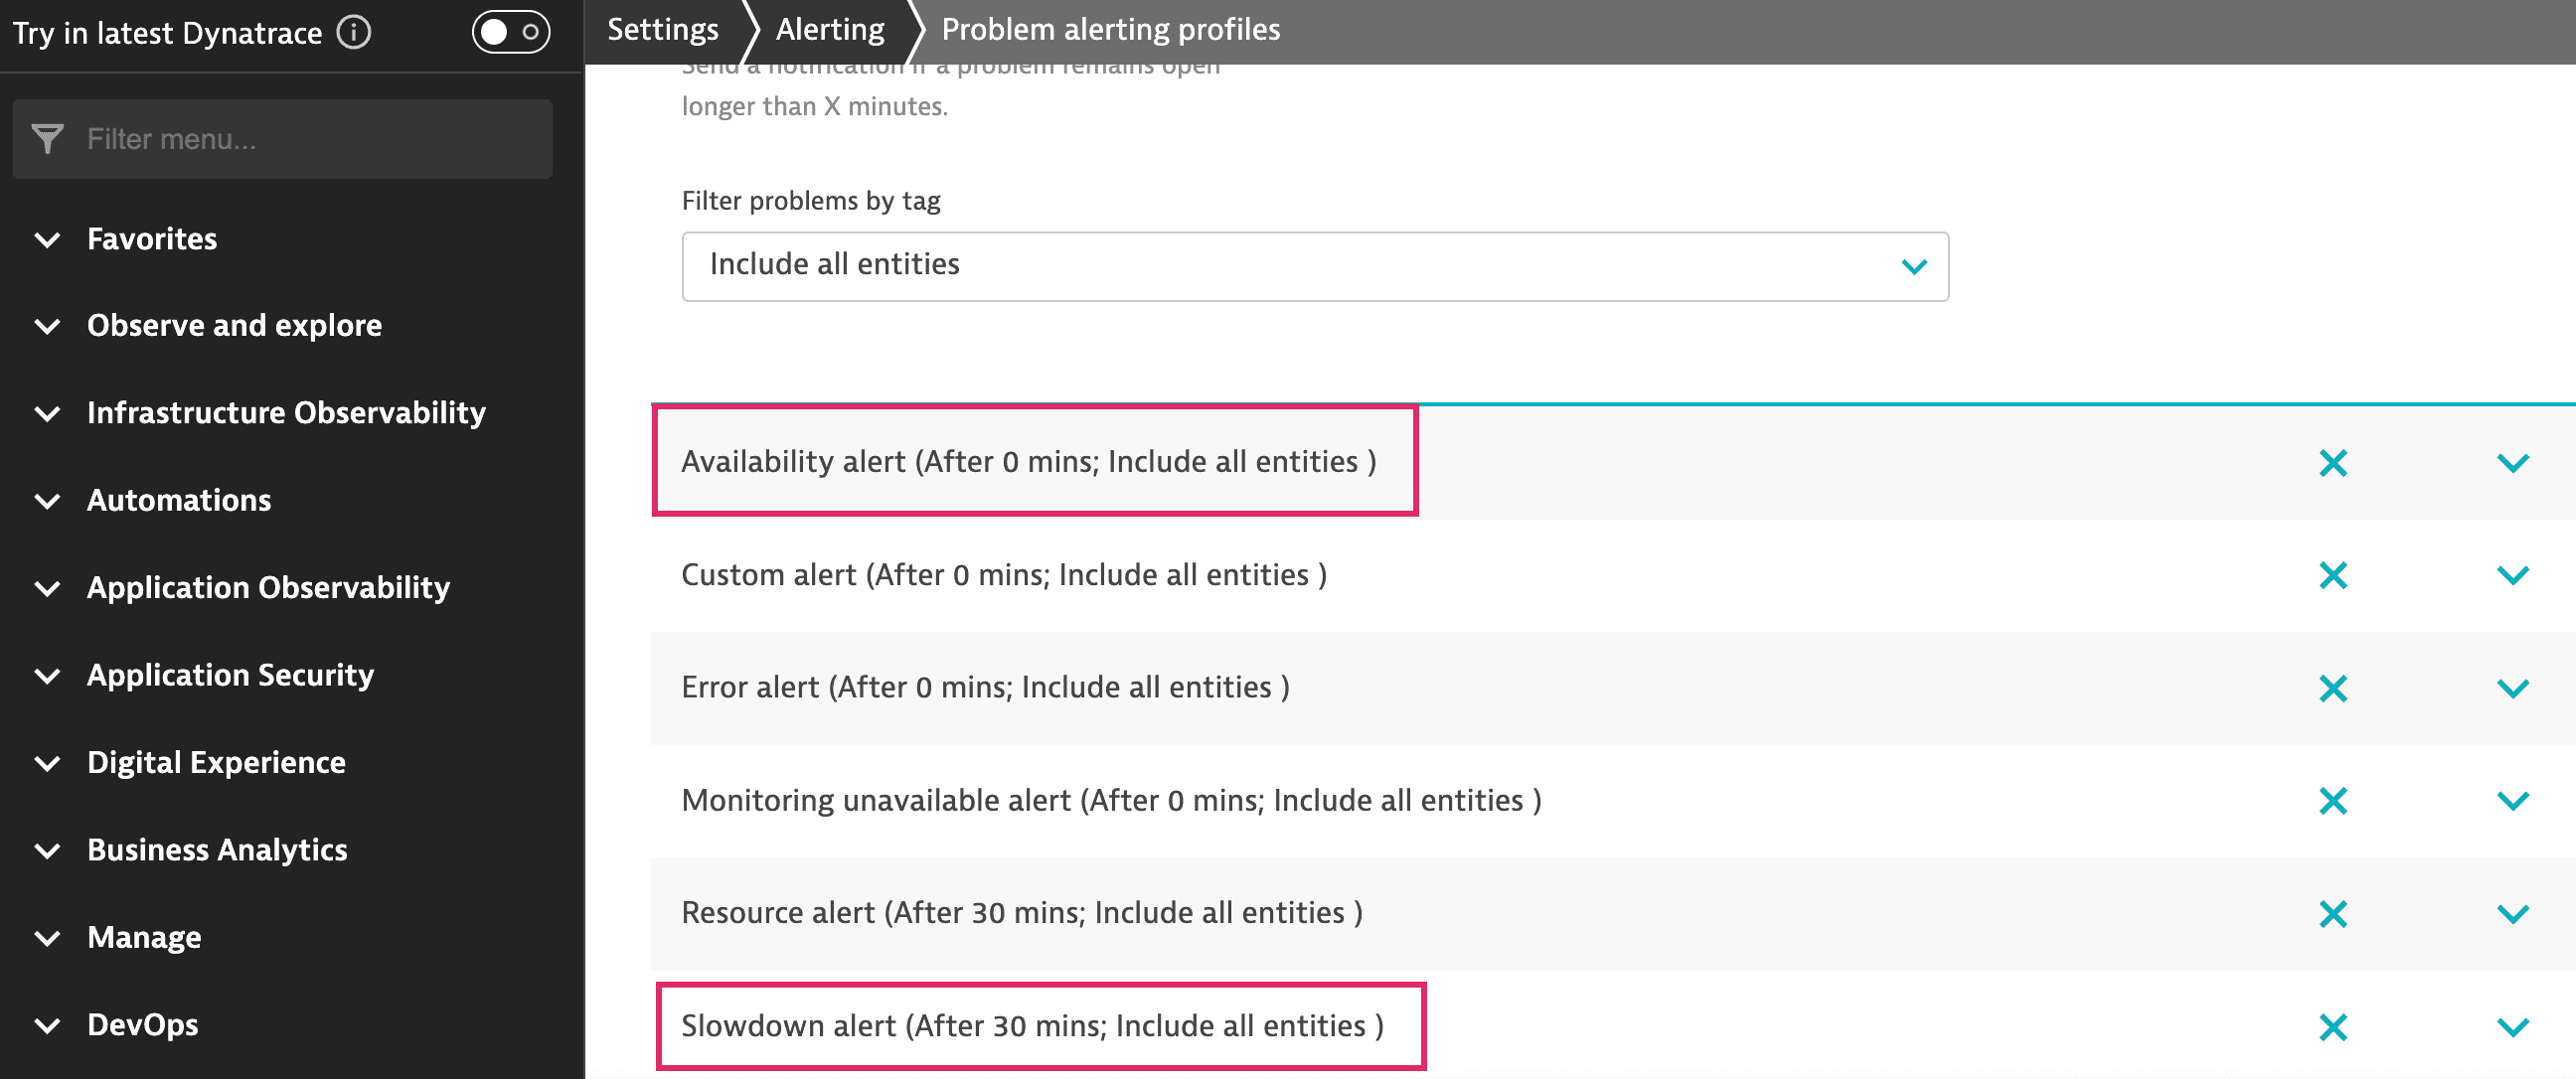
By default, the system alerting rules trigger notifications immediately for availability and after 30 minutes for slowdown performance problems; you can adjust these as required.
Using alerting profiles and integrations, you can set up varying levels of severity based on problem type and duration. For example, the Default profile sends Availability alerts immediately and Slowdown alerts (for performance issues) after 30 minutes.
You could associate different alerting profiles with different email recipients (integrations) to escalate a problem based on its duration. For example, you might want to notify your network operations center immediately but send notifications to the business unit only after an hour.
You can also use tags to determine which monitors should trigger these alerts. For example, you can use tags to allow only the most sensitive tests to trigger alerts to certain stakeholders.
Integrations
Synthetic Monitoring allows you to integrate with many third-party systems such as email for problem notifications. Go to Settings > Integrations > Problem notifications > Add notification to set up an integration.
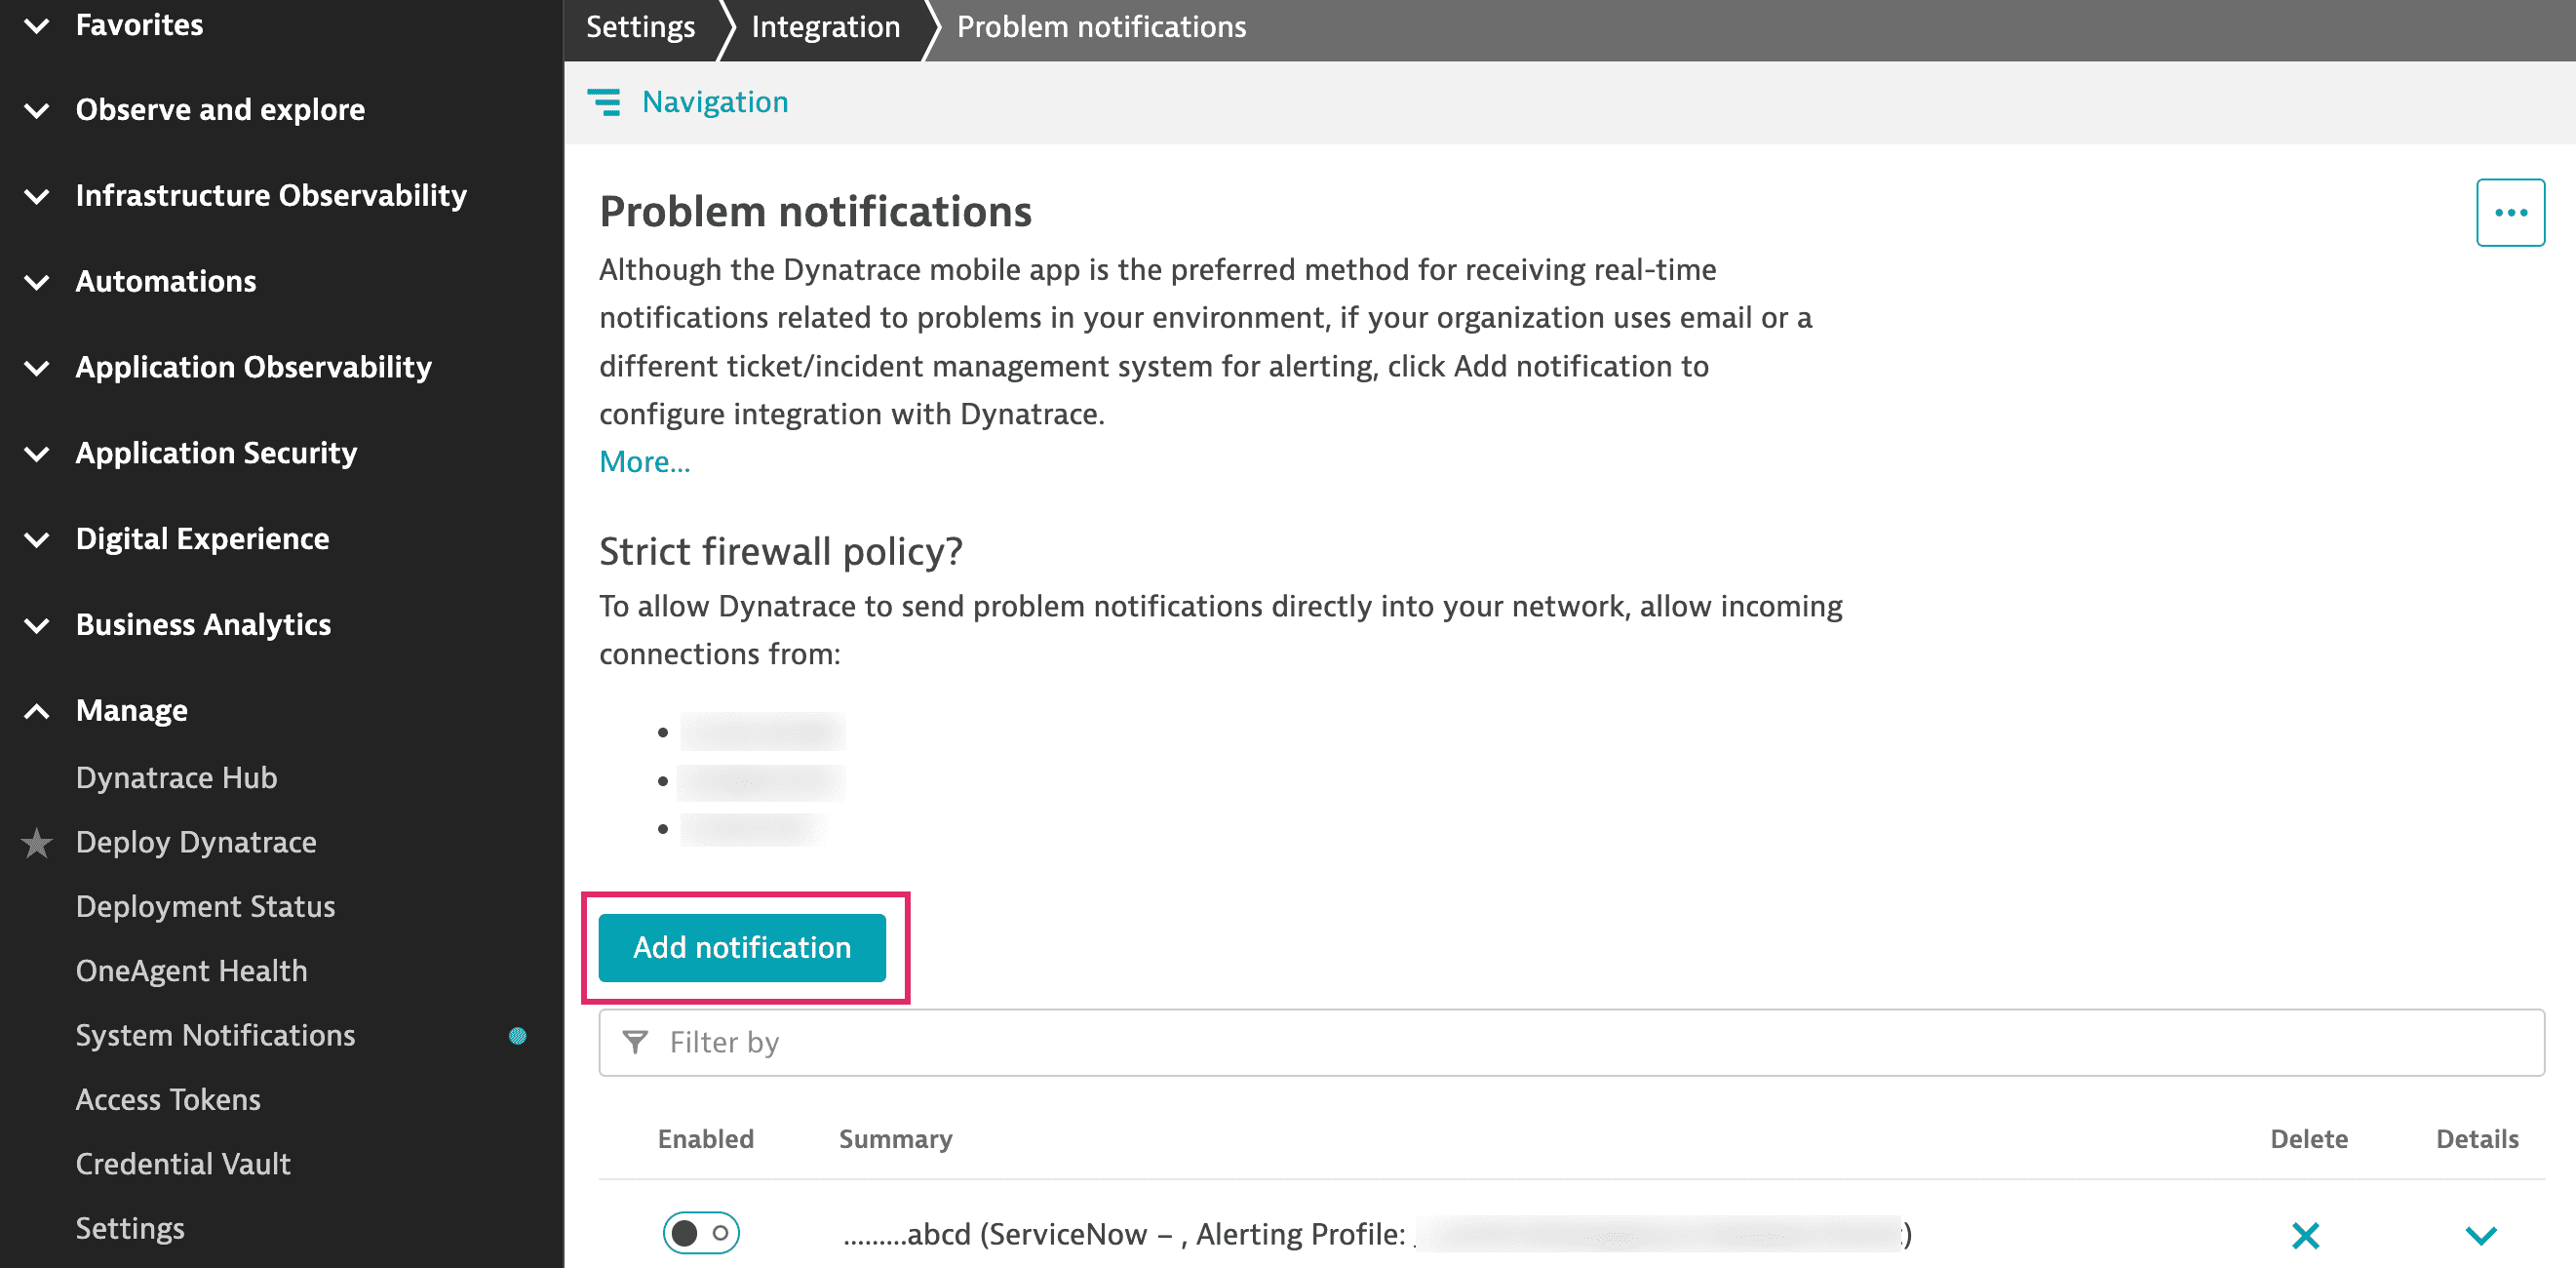
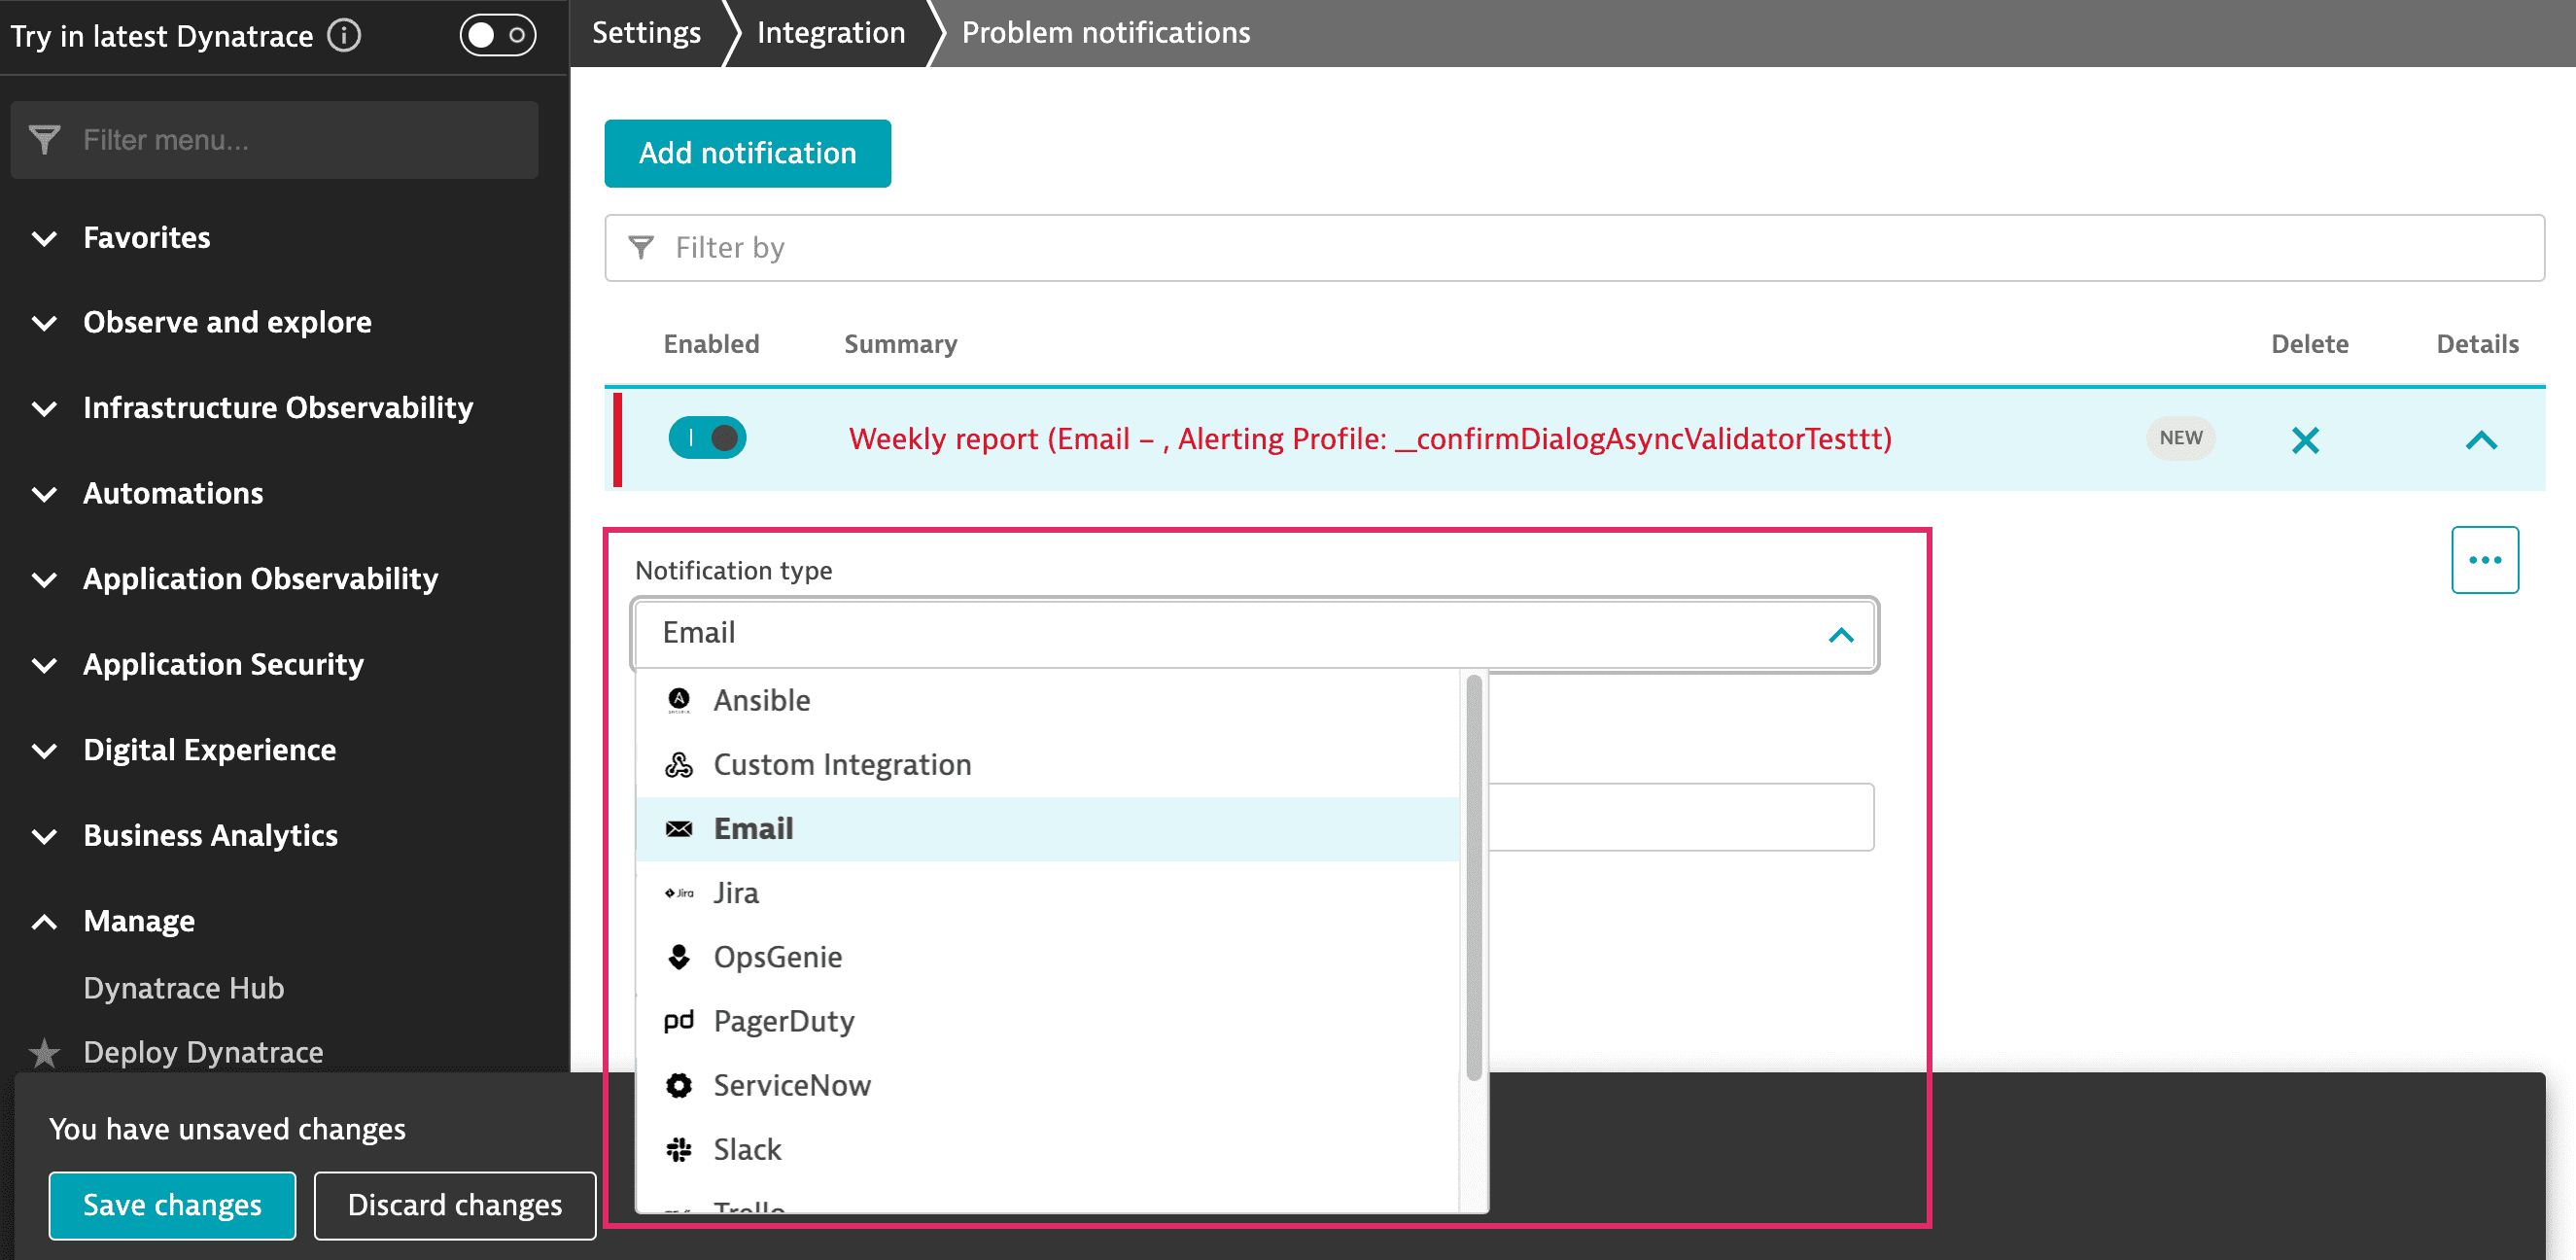
Problem notifications are automatically pushed to the Synthetic dashboard and Dynatrace mobile app, even if you haven't set up other integrations.
Each integration involves setting up a template for communication, specifying recipients, URLs, credentials, and other fields. You can choose from several fields to customize these templates. You can also set up your own integration using web hooks.
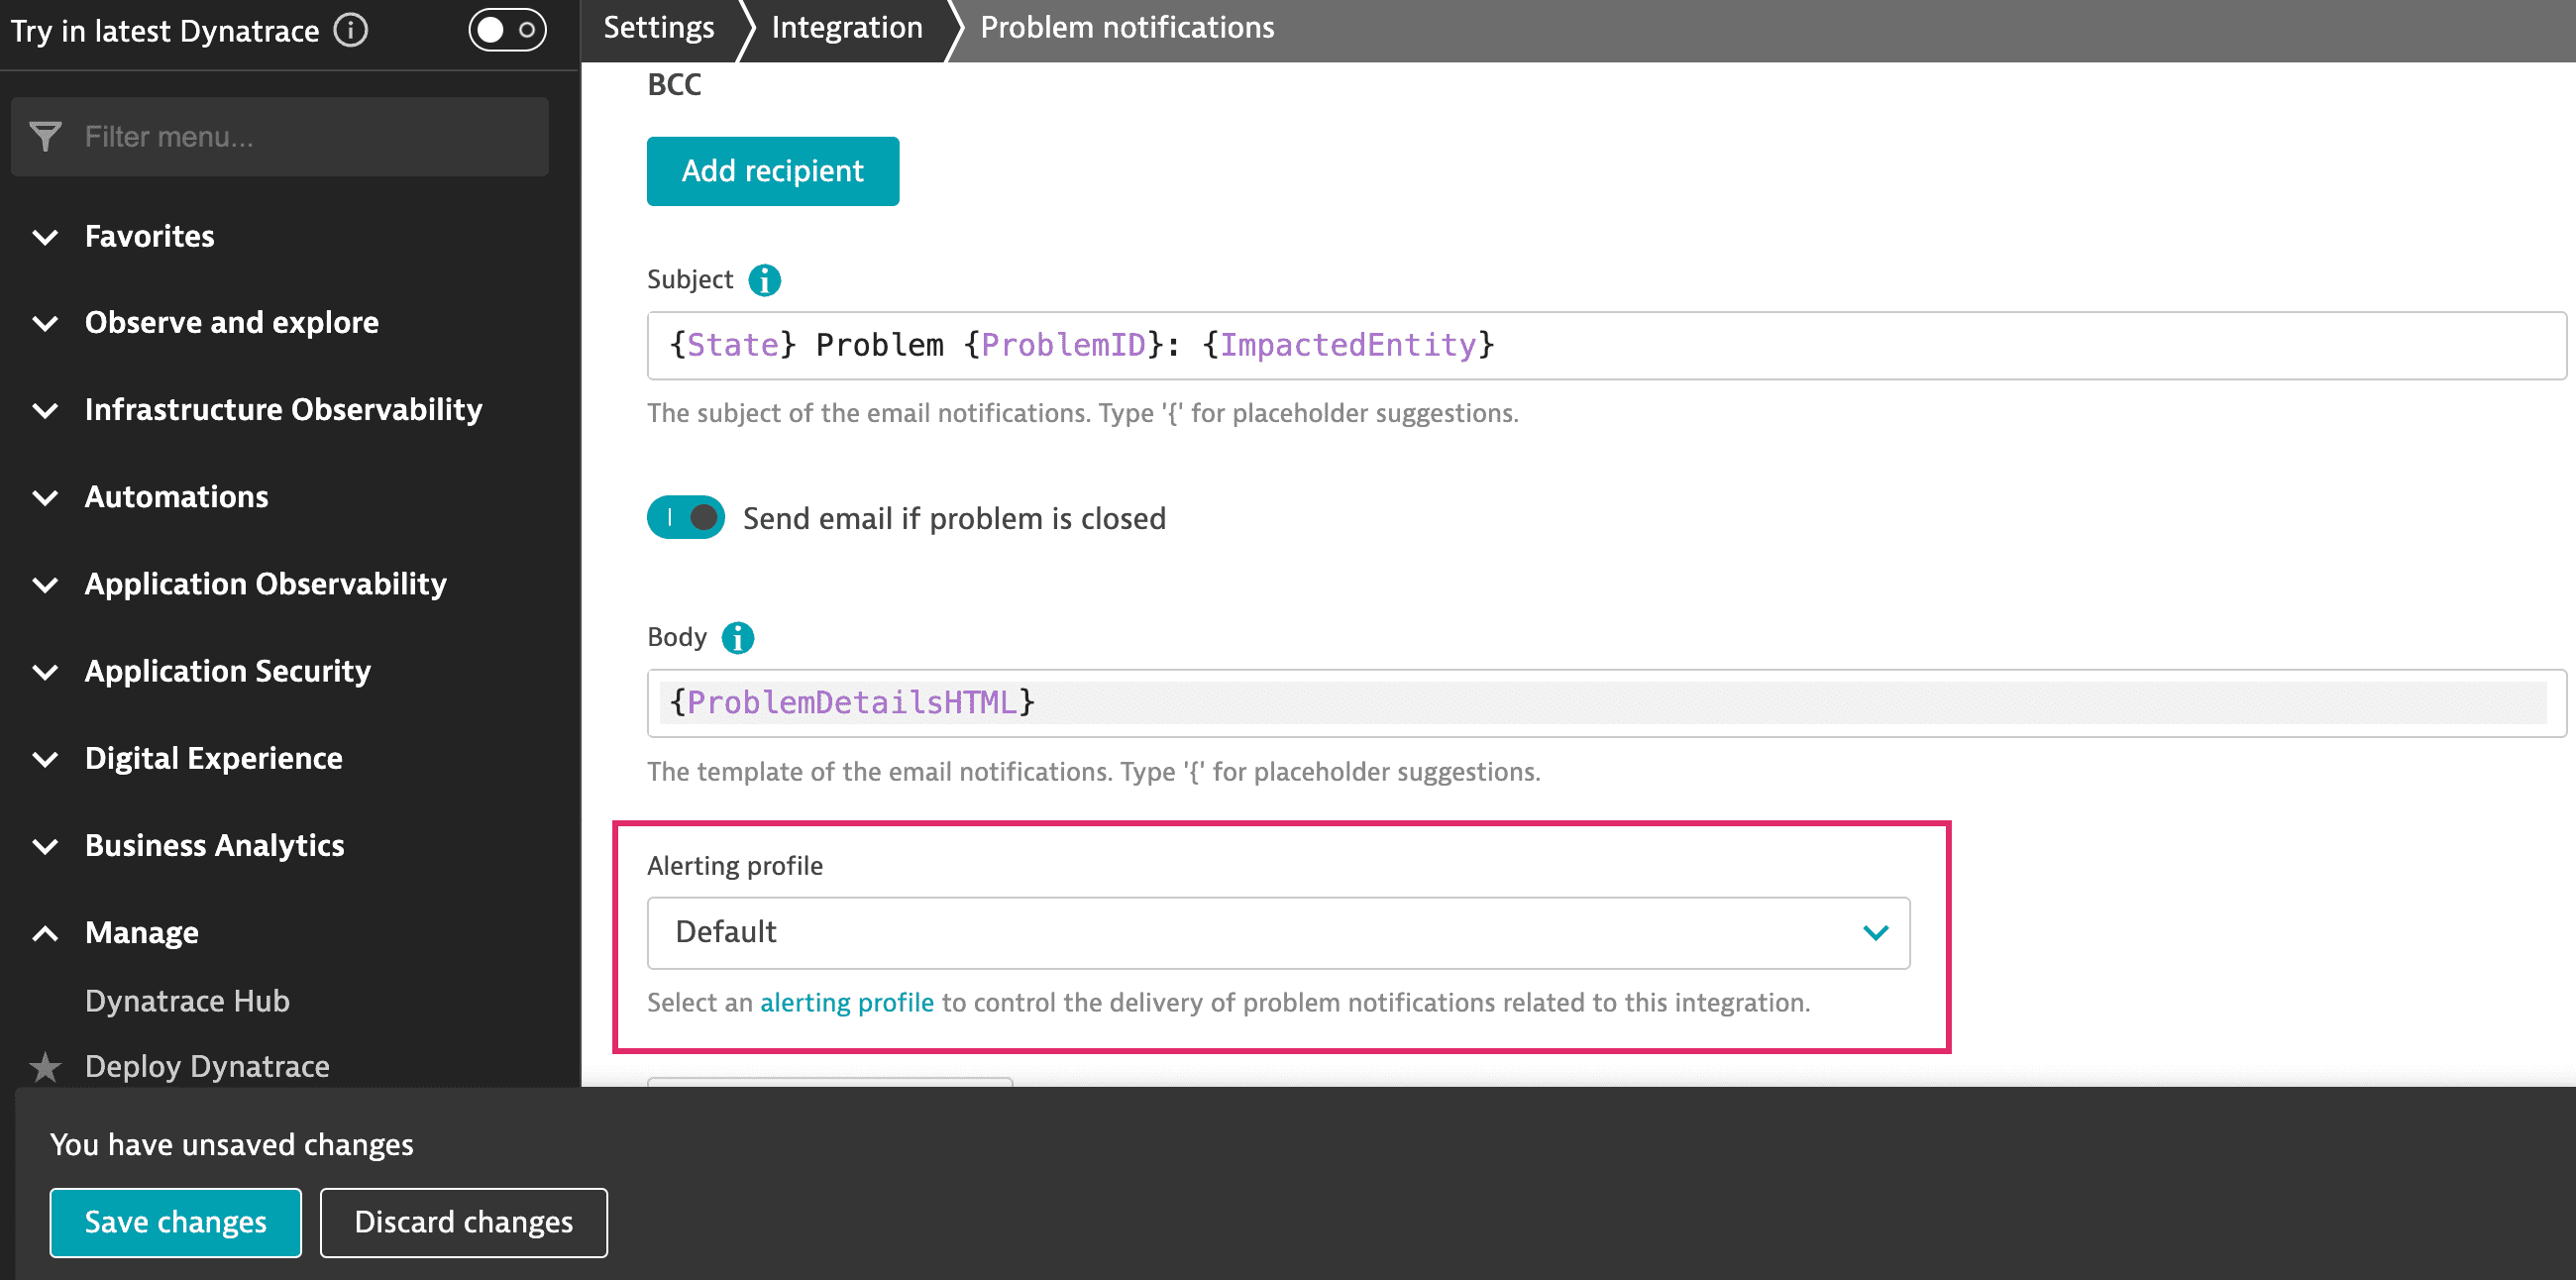
An integration is always associated with a single alerting profile, which separately defines when the alert is delivered and for which entities and problem types. Initially, the integration uses the Default alerting profile. You can modify this and add your own.
To start receiving alerts, add your email to an email integration, for example, and associate it with an alerting profile. Ensure that the integration is set to Active.
To stop receiving alerts, remove your email from an email integration, for example, or deactivate or delete the integration.
Maintenance windows
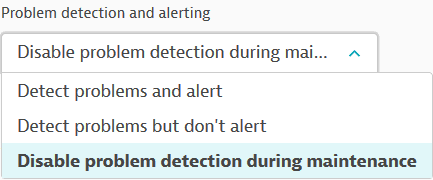
Maintenance windows are one-time or recurring time periods during which problem detection and, optionally, alerting are suspended. You can also opt to continue with problem detection and alerting during a maintenance window.
Set up maintenance windows by navigating to Settings > Maintenance windows > Monitoring, alerting and availability. In particular, the setting below allows you to suspend problem detection and alerting. It is best to Disable problem detection during maintenance so that no notifications are pushed to system dashboards or through your third-party tools.
 Synthetic Classic