Push notifications via the Dynatrace mobile app
- Dynatrace Classic
- 8-min read
Dynatrace provides multiple channels for receiving alerts about detected problems in your environment. Besides traditional methods like email, Dynatrace integrates directly with popular third-party services such as Slack, Jira, and Opsgenie. Additionally, you can receive alerts via the Dynatrace mobile app.
As part of our ongoing commitment to delivering a streamlined and consistent user experience, Dynatrace is retiring its native mobile applications for iOS and Android. This change aligns with our strategy to provide a unified, responsive web interface and leverage modern, flexible notification channels.
Key dates
- Last app update: End of 2025
- Sunset date: June 30, 2026
- Support ends: June 30, 2026
What’s changing
The Dynatrace native mobile apps will no longer be available for download or supported after the sunset date.
We encourage you to access Dynatrace via the responsive web interface, which offers full functionality across all device types and screen sizes.
Push notifications will now be delivered through third-party integrations such as Slack, Teams, PagerDuty, email, and ntfy.
Why this change?
- Unified experience: A single responsive web platform ensures consistent functionality across all devices.
- Flexibility: You can choose your preferred communication tools for alerts and updates.
Recommended actions
- Begin using the responsive web interface.
- Set up your preferred notification integrations via:
- Dynatrace SaaS: Workflows
- Dynatrace Managed: Problem notifications
- Remove the native app from your devices after the sunset date.
Need help?
For assistance with transitioning or setting up integrations, please see the Documentation links above or contact Support.
The rest of this page refers to the Dynatrace mobile app, which has a sunset date of June 30, 2026. See above for details.
The Dynatrace mobile app is available for iOS and Android devices. Its primary function is to deliver push notifications for issues detected within your monitoring environments. Notifications are fetched and updated in real-time, ensuring you stay informed about ongoing problems. This makes the mobile app a convenient and efficient way to manage alerts and monitor your environments when you're on the go.
Push notifications for each environment are filtered based on the management zones for which the user has at least read permissions. If a user lacks read permissions for a specific management zone, no push notifications will be sent for that zone.
In addition to the management zone filter for individual users, push notifications are also filtered by the environment’s Default alerting profile. Modifying the Default alerting profile affects all problem push notifications sent to all users within the environment.
Key Features
- Real-time alerts: Receive immediate push notifications for detected issues.
- Multi-environment support: Monitor multiple Dynatrace environments from a single app.
- Compatibility: Supports push notifications from Dynatrace SaaS and Dynatrace Managed environments.
Dynatrace mobile app only supports role-based access. This means that, if you have access to any tenants based on an IAM policy, they won't show up in the mobile app.
If you have a tenant that should be visible but is not, please contact the Dynatrace support team to resolve the issue.
Aim and context
This guide shows how to use the Dynatrace mobile app to receive push notifications on detected problems within your monitoring environments.
Target audience
This guide is written for:
- Operations engineers
- Pipeline engineers
- Systems engineers
- Site reliability engineers (SREs)
- Build automation engineers
Prerequisites
Android
- Android 9.0+
- Dynatrace mobile app for Android installed on your mobile device. Ensure that the device has permanent access to the Internet.
iOS
- iOS 16+
- Dynatrace mobile app for iOS installed on your mobile device. Ensure that the device has permanent access to the Internet.
Start using
 Log in to mobile app
Use your normal Dynatrace SaaS user credentials to log in to the Dynatrace mobile app.
After you log in, the mobile app lists all environments for which you have view environment permissions or the Environment viewer role assigned.
- If you don’t see any environments, contact your Dynatrace environment administrator to check your user permissions in Account Management under Identity & access management. The "view environment" permission needs to be assigned to a user as a role. It can be done either globally via a custom group or for specific management zones.
- If you run into the Invalid login credentials error when trying to sign into the mobile app it means that:
- You used invalid credentials.
- You ran into an SSO issue which occurs when you try to sign into the mobile app via an environment-specific federation, but the app can't use the environment-specific federation. In such a case, you can't sign in even if you provide valid federation credentials. To resolve the issue, you can either configure the federation to be global or sign in with the Dynatrace credentials. If you don't have available Dynatrace credentials, reset the password from the mobile app.
 Display problems and vulnerabilities
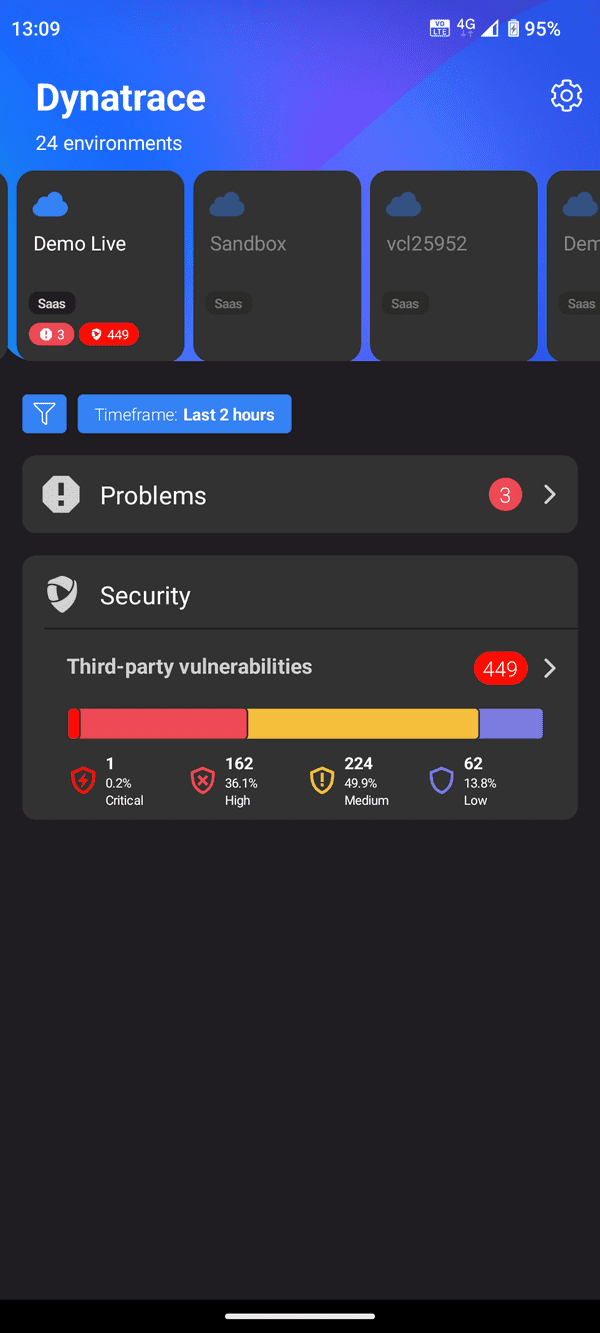
The Dynatrace mobile app displays all connected environments and highlights the total number of active problems and vulnerabilities for each with a red indicator. This global indicator assists operations teams in prioritizing environments that have active issues.
 View problem details
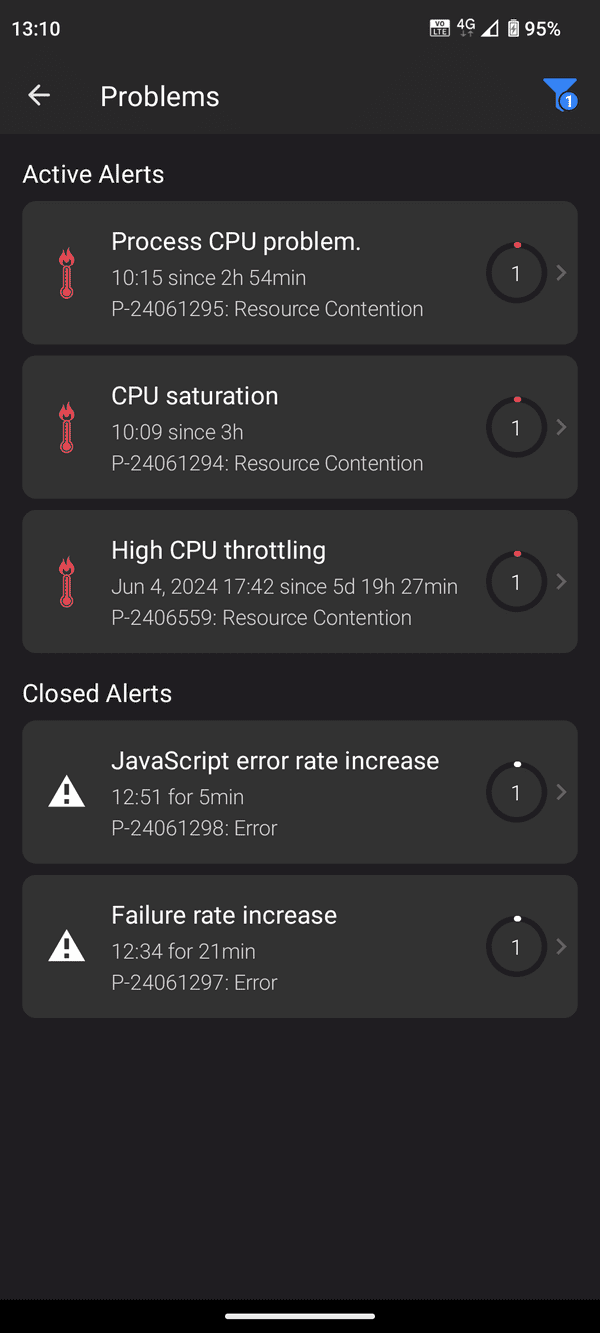
The Problems list shows all active and closed problems within a specified period.
You can use the problem filter to
-
Adjust the timeframe
-
Filter by status, severity, or impact level
-
Select a management zone.
Note that only management zones loaded through the first page of problems are available in the management zone filter.
Select a problem to see a summary of the issue and details about all events collected during the analysis of the problem.
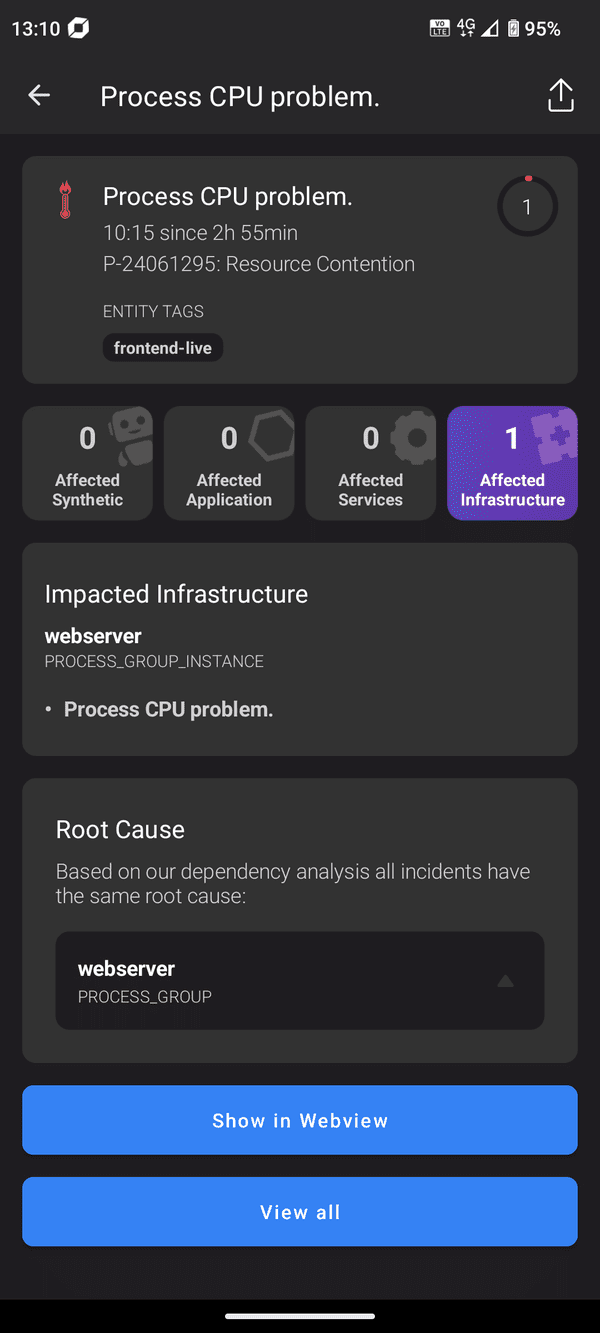
- Show in Webview—Available only in the Android version, as Apple store policies do not allow embedded Web links within native iOS apps.
- View all—Expands the entire affected topology for large problems.
 View vulnerability details
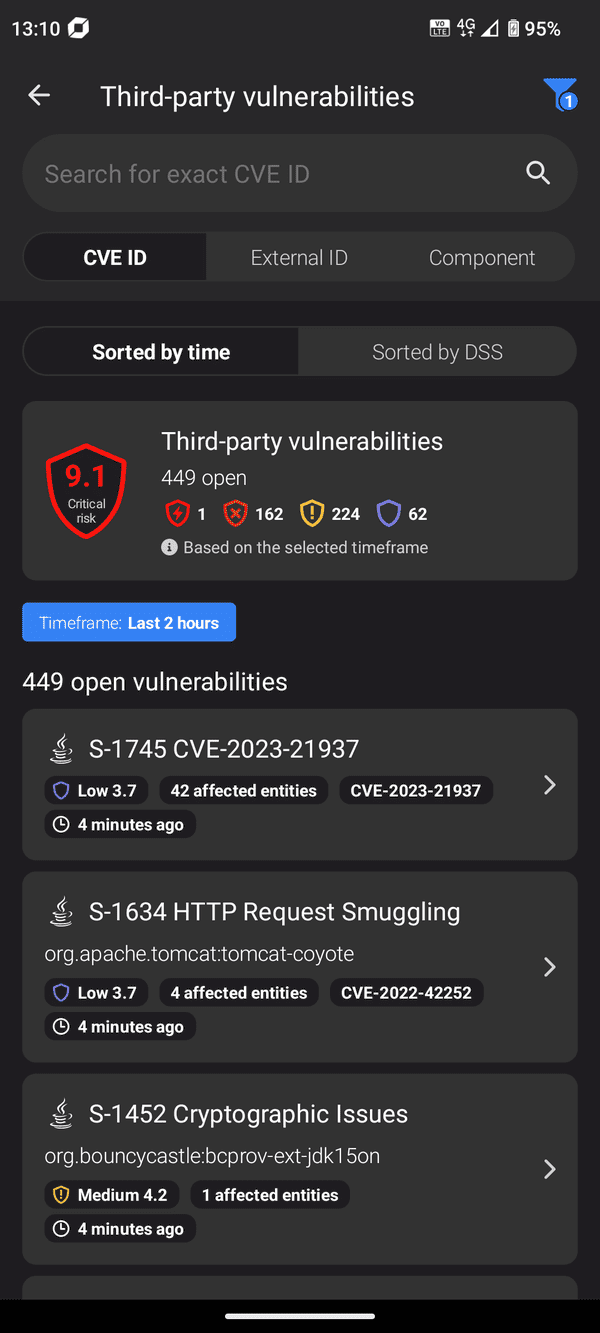
The list of vulnerabilities within the app allows your security team to quickly review all the detected security vulnerabilities within your environments.
Each of these vulnerabilities shows its Dynatrace Security Score (DSS) along with the number of affected entities and its Common Vulnerabilities and Exposures (CVE) number.
- To search, select CVE ID, External ID, or Component and then enter the search string.
- To change the sort order, select Sorted by time or Sorted by DSS.
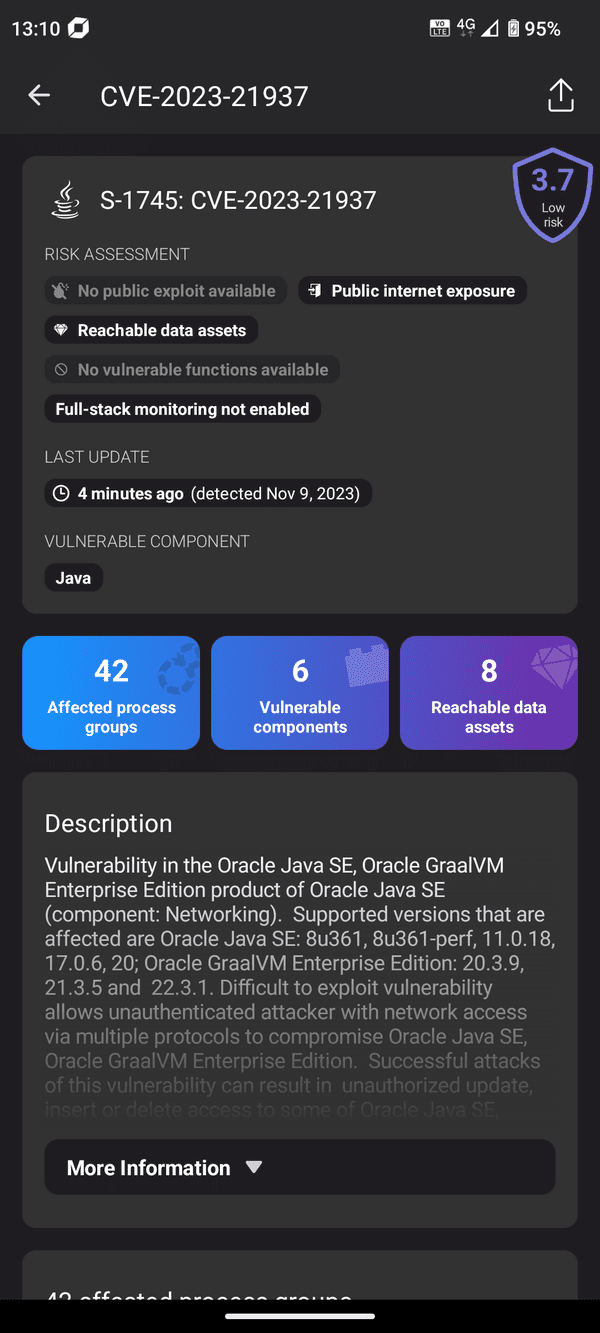
Select a vulnerability to show details such as a risk assessment, information on the affected software stack, and a description of the vulnerability.
 Receive push notification
After you're logged into the Dynatrace, push notifications are received for all newly detected problems within all the connected environments.
Within the mobile app settings, you can disable or enable push notifications per environment.
All push notifications are filtered by the management zones for which you have at least viewer permissions.
To receive push notifications, you need the View environment permission assigned to your user as a role. Note that policy-based assignments are currently not supported for the mobile app.
If you don't receive push notifications:
- Verify that you have the right permissions for the environment and for the specific management zone in which the problem was detected.
- Verify that the Dynatrace mobile app has the necessary Android and iOS permissions to receive push notifications.
- Log out and in again to retry the push notification registration at the push notification provider.