Maintenance windows
- Dynatrace Classic
- 2-min read
Your organization might have some planned or ad hoc periods of time during which your system undergoes maintenance activities that can cause service disruption. During such periods, you might not want to receive notifications that your services are down. Additionally, such periods shouldn't be taken into account when monitoring the availability of your system. To avoid such situations, you can exclude these periods by defining maintenance windows.
Maintenance windows enable Dynatrace to identify periods of possibly abnormal operation such as downtimes, reduced performance periods, and high-traffic events during load tests. Defining maintenance windows during times of abnormal operation helps you reduce alert spam and keep your baselines clean for accurate monitoring and alerting.
In general, it's good practice to keep your performance monitoring system informed of scheduled maintenance to ensure accurate monitoring data. Dynatrace enables you to define maintenance windows using either the Configuration API or the Dynatrace web UI.
You can have up to 2000 maintenance windows per monitoring environment. This limit applies to all maintenance windows regardless of state.
Maintenance window types
Dynatrace distinguishes between two types of maintenance windows: planned and unplanned.
| Planned | Unplanned |
|---|---|
| Defined in advance | Defined retroactively or for an ongoing outage |
| Excluded from regular baseline calculation | Excluded from regular baseline calculation |
Maintenance window effects on baseline calculation
Once a maintenance window is defined, Dynatrace automatically excludes the configured time period from baseline calculations. With this approach, any response time anomalies that occur during the maintenance window won't negatively influence your overall service and application baselines.
It's a good idea to define your maintenance windows before performing any load testing. Using maintenance windows during load testing ensures that any load spikes, longer-than-usual response times, or increased error rates don't negatively influence your overall baselining.
How maintenance windows work
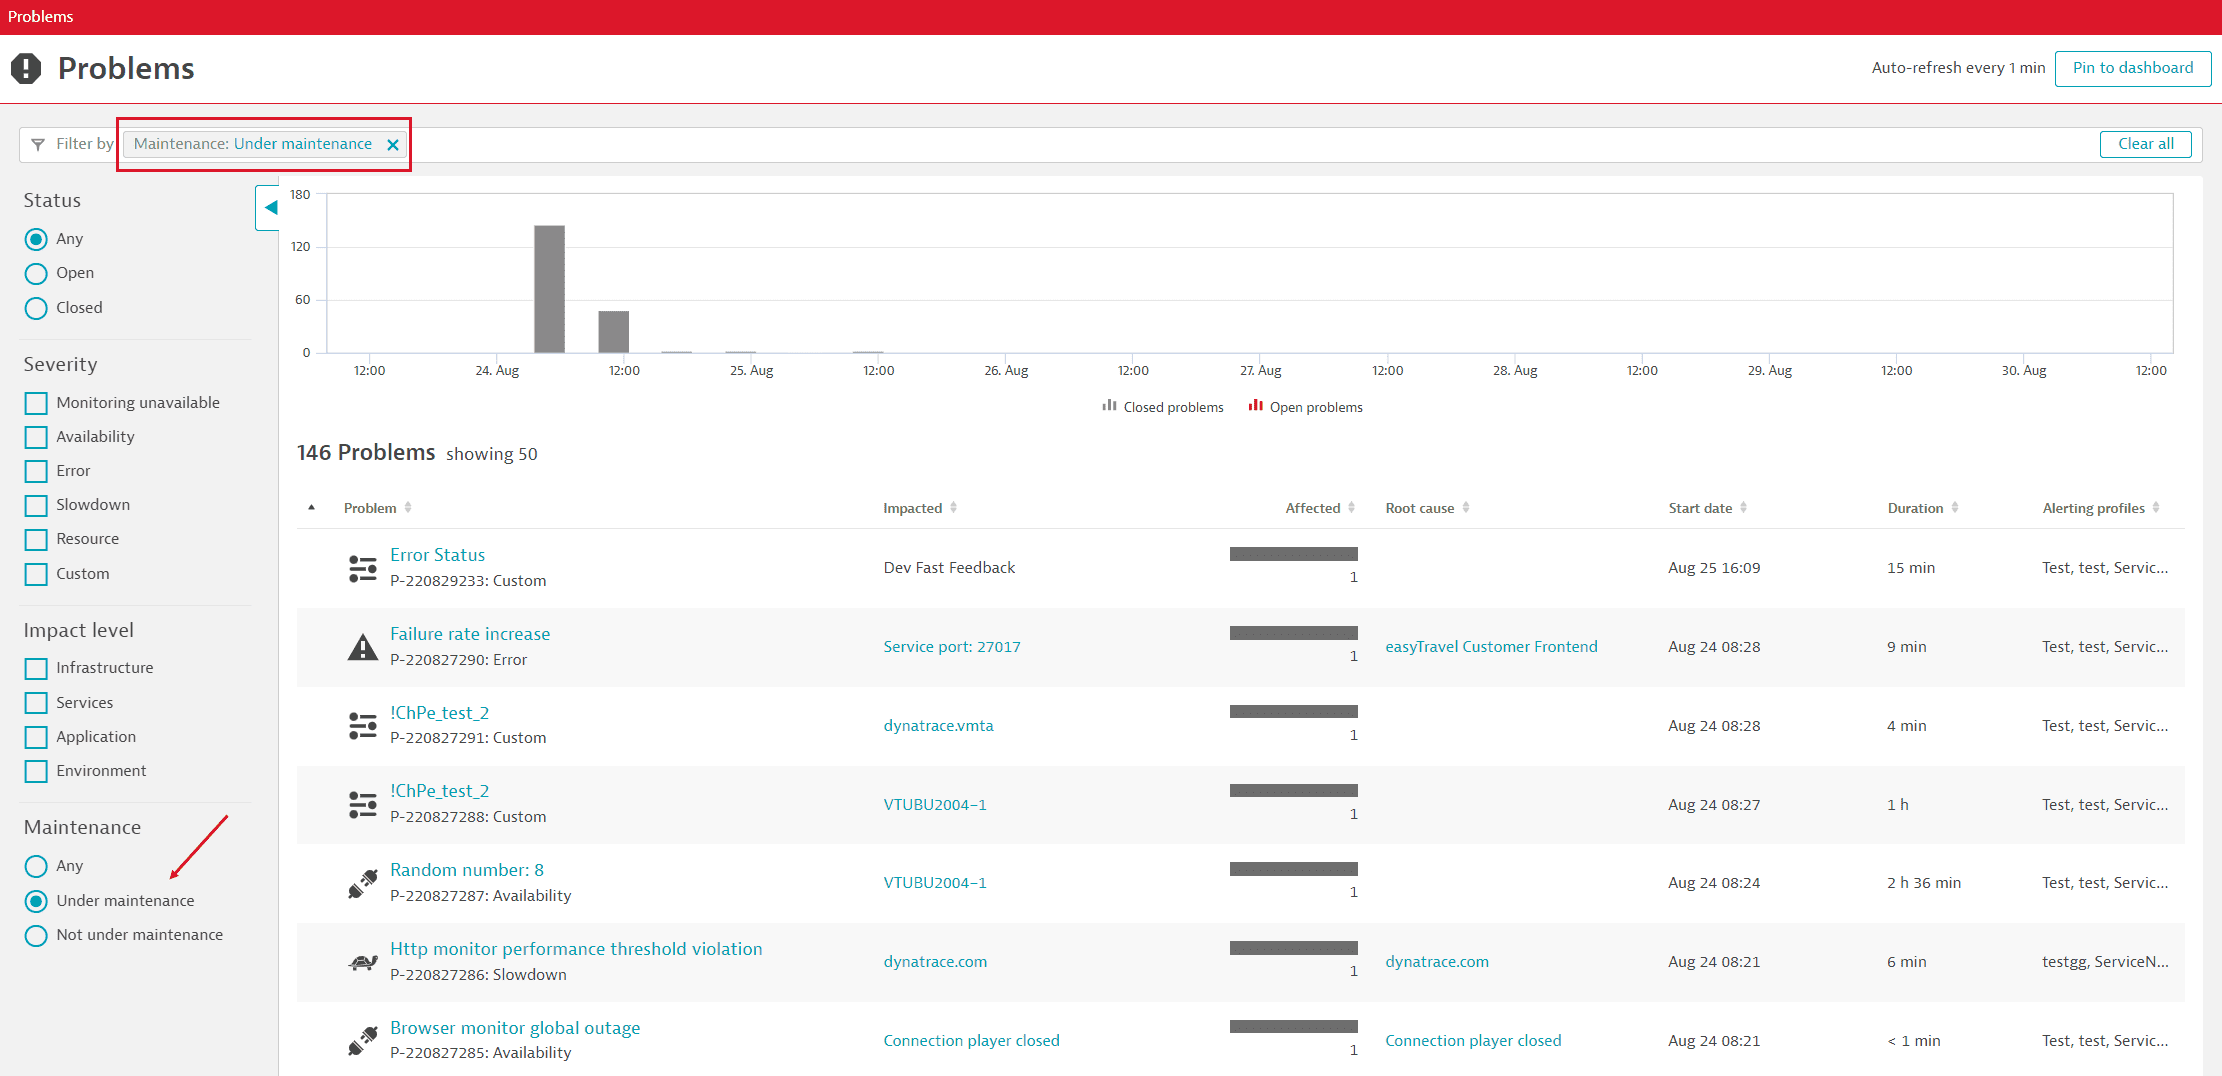
Once you've defined your maintenance windows, use Under maintenance filter on the Problems page to view a list of problems that occurred during the maintenance windows.
If you choose to completely disable problem detection during maintenance windows, no detected problems will be displayed on the Problems page.

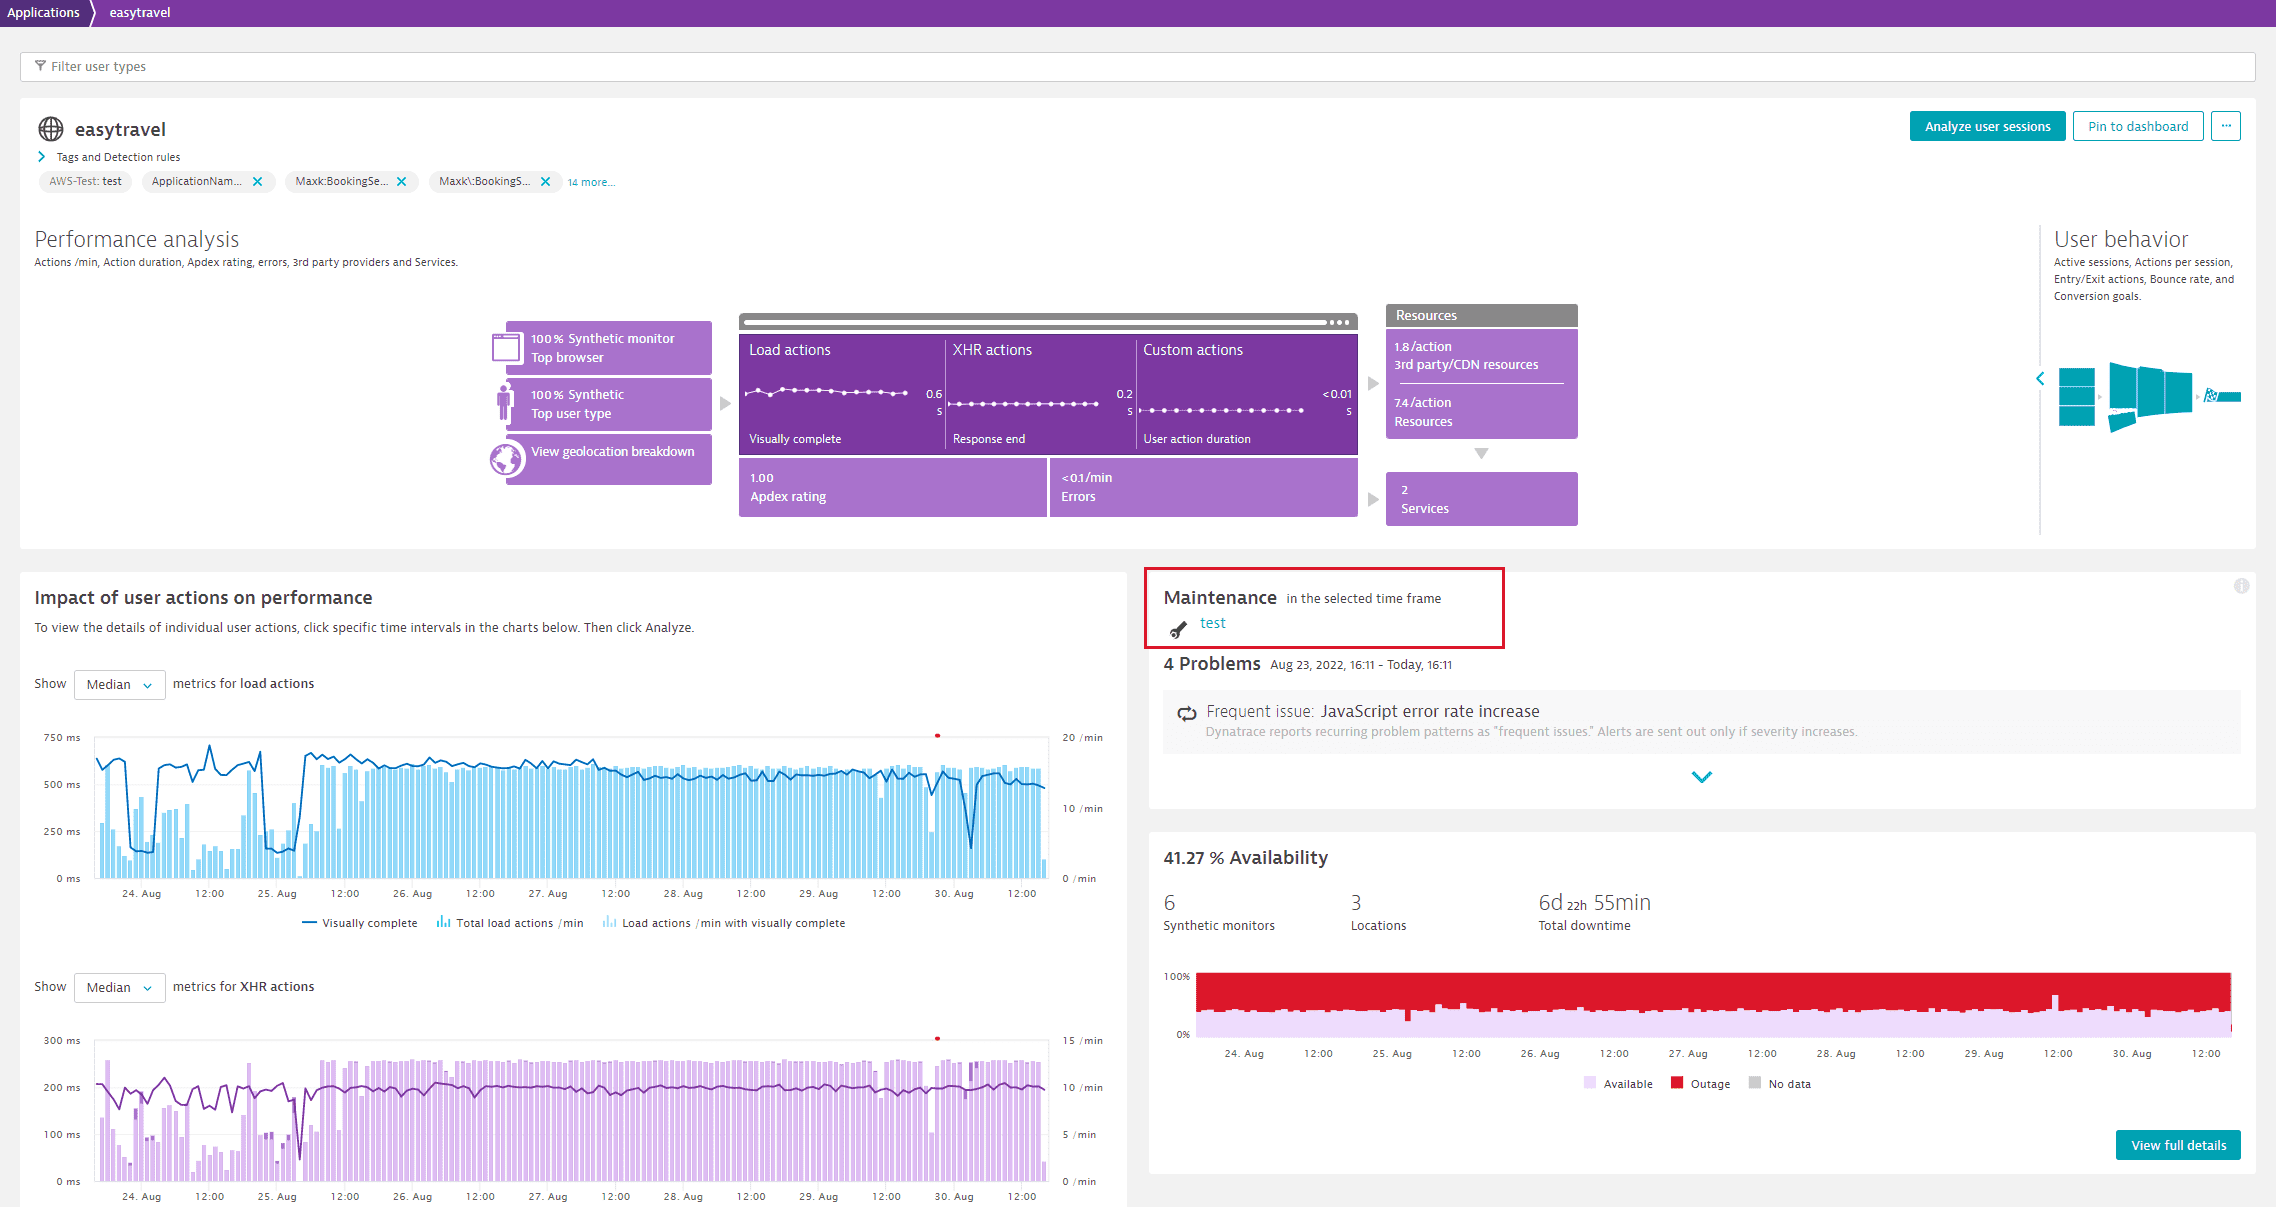
When you view an entity overview page and select a global timeframe during which the selected entity was under maintenance, Dynatrace shows you the details on the Maintenance tile. If the entity is included in multiple maintenance periods, Dynatrace shows you the most recent window and a count of how many maintenance windows the entity experienced during the selected timeframe.
