Classic Windows services monitoring
- Dynatrace Classic
- How-to guide
- 6-min read
- Published Jul 10, 2020
Deprecated
The Classic Windows services feature described below is deprecated. Instead, use OS services monitoring.
Dynatrace provides out-of-the-box availability monitoring of Windows services.
To monitor the availability of a service, specify the Service name and Display name. To simplify management in a large-scale environment, adjust settings on the host-group level.
In Dynatrace versions 1.214-1.218, Windows service availability monitoring configuration at the host level took precedence over the host group configuration, which in turn took precedence over the environment configuration. In Dynatrace version 219+, this is no longer the case. Configurations at the environment, host group, and host level are combined as described below.
You can configure service monitoring at the environment, host group, and host levels. Service monitoring is a combination of the settings you make at any of the three levels.
Example
Suppose you have the following:
- Services A, B, C, D, and E
- Host groups J and K
- Hosts X and Y
- Host X is a member of host group J
- Host Y is not a member of any host group
If you configured the following:
- Monitor services A and B at the environment level
- Monitor services B and C for host group J
- Monitor services A and D for host X
- Monitor services A and E for host Y
You would monitor the following:
- Monitor services A and B on all hosts
- Monitor services A, B, and C on all hosts belonging to group J
- Monitor services A, B, C, and D on host X
- Monitor services A, B, and E on host Y
Monitor a service
To monitor an OS service
-
Determine the service name. Be sure to use the exact OS-provided service name, because this is how Dynatrace identifies your service.
To determine a Windows service name
-
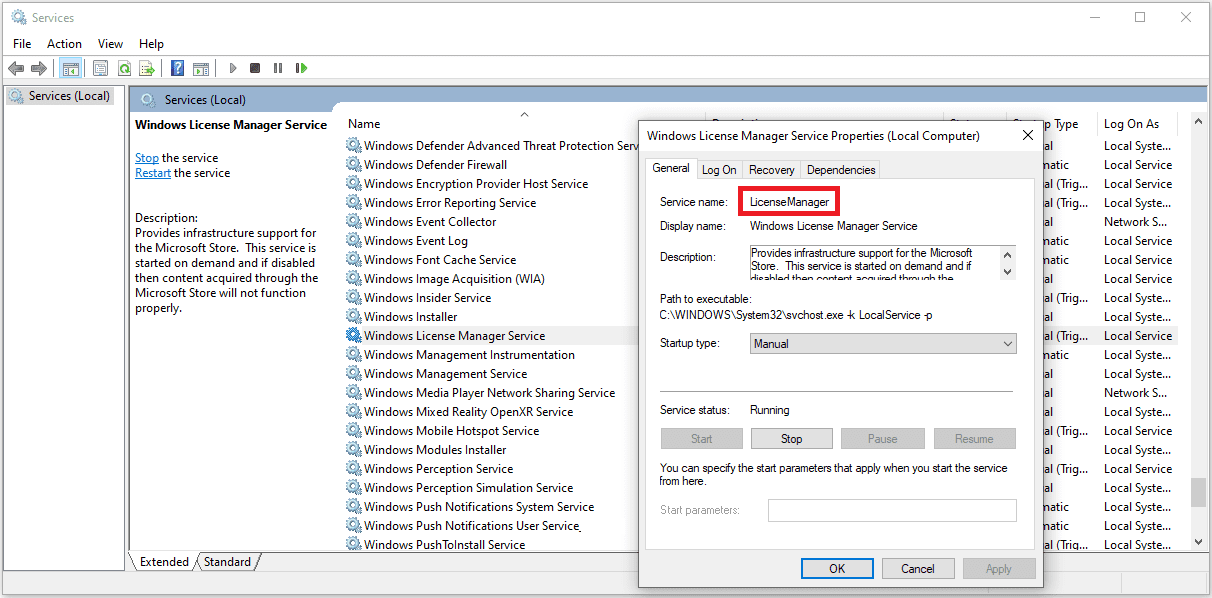
In Windows, open Services and find the service.
-
Check the service properties. In this example, we display the properties of Windows License Manager Service to see that the Windows service name is
LicenseManager. Windows services availability: example service name
-
-
In Dynatrace, go to OS service monitoring for the level you are configuring.
Host level
- Go to
 Hosts Classic.
 - Optional Filter by
Operating system(Windows). - Find your host and select it to display the host page.
- On the host page, open the browse menu (…) and select Settings.
- Select the OS service monitoring tab.
Host-group level
- Go to
 Hosts Classic.
 - Optional Filter by
Operating system(Windows). - Filter by
Host groupand start typing the name of a host group to find and select a host group name. - Open any host in that host group.
- On the host page, expand the Properties and tags section and select the host group name.
- Select the OS service monitoring tab.
Environment level
Go to Settings > Monitoring > OS services monitoring.
- Go to
-
On OS service monitoring for the level you are configuring, select Add new service and specify the service you want to monitor.
- Service name is the exact service name as determined in step 1.
- Display name is the freeform label that will be displayed in the table of monitored services.
-
Select Save changes.
Manage monitored OS services
To manage the OS services you monitor
-
In Dynatrace, go to OS service monitoring for the level you are configuring.
Host level
- Go to
 Hosts Classic.
 - Optional Filter by
Operating system(Windows). - Find your host and select it to display the host page.
- On the host page, open the browse menu (…) and select Settings.
- Select the OS service monitoring tab.
Host-group level
- Go to
 Hosts Classic.
 - Optional Filter by
Operating system(Windows). - Filter by
Host groupand start typing the name of a host group to find and select a host group name. - Open any host in that host group.
- On the host page, expand the Properties and tags section and select the host group name.
- Select the OS service monitoring tab.
Environment level
Go to Settings > Monitoring > OS services monitoring.
- Go to
-
The OS services you monitor are displayed in a table under the Add new service button.
- To filter the table, type a search string in the Filter items… box
- To stop monitoring a listed service, turn the Enabled setting off.
- To delete a service from the table, select the delete button in the Delete column
- To view and edit details, select the expand control in the Details column. You can change the service name or edit the display name.
Metric events for alerting on service availability
After you add a service, you can create a custom event for the availability of your service based on the OS Service availability metric.
Provide the following information:
- Category - Hosts
- Metric - OS Service availability
- Aggregation - Average
- Dimension - Service name of your choice
See Metric events for alerting for details on creating and customizing metric events for alerting.
Configure at scale using Settings API
You can use the Settings API to configure your service availability monitoring at scale.
- To learn the schema, use GET a schema with
builtin:os.services.monitoringas the schemaId. - Based on the
builtin:os.services.monitoringschema, create your configuration object. - To create your configuration, use POST an object.
 Hosts Classic