Host-level settings
- How-to guide
- 2-min read
In many cases, you can configure monitoring settings at the environment, host group, or host level.
- Settings at the host level override settings at the host group and environment levels.
- Settings at the host group level override settings at the environment level.
To configure settings at the host level
- Go to Hosts (previous Dynatrace) or
 Hosts Classic.
 - Find and select your host to display the host overview page.
- In the upper-right corner of the host overview page, select More (…) > Settings.
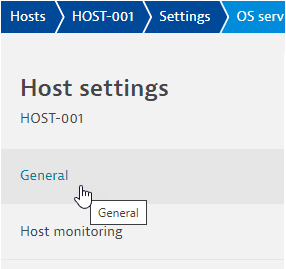
From here, select items in the left panel to navigate through the host-level settings pages. In this example, you would display the General settings page for HOST-001.

Changes to settings at the host level override settings at the host group and environment levels.
- If no settings have been changed at the host level, a message box offers a link up from the host-level settings to the equivalent settings on the host group level. If no settings are configured for the host group either, a similar message box offers a link up from the host group settings to the environment settings.
- If host-level settings have been changed, a message box states that "These settings are overriding [host group name] (Host group) settings." You can select the host group name to go to those settings or select Remove override if you want to remove the host-level settings and use the host group settings.
General
The General page of Host settings displays a table of monitored technologies.
-
On the host-level Host settings page, select General.
The Monitored technologies table lists monitoring technologies on the selected host:
- Technology—the name of the technology
- Type—the type of monitoring, such as
JMX monitoring,OneAgent extension,Custom extension, andService insights - Configuration—the current configuration level for the selected host.
- Monitoring—the monitoring state of this technology on the selected host.
-
Select in the Edit column to see configuration options:
- Use host configuration determines whether to use host-level monitoring settings, overriding the equivalent environment and host group settings.
- When you turn on Use host configuration, technology-specific settings become available.
To manage host monitoring settings, go to Host monitoring.
Host monitoring
OneAgent automatically monitors a host and its processes, services, and applications, but you can turn off monitoring, full-stack monitoring, or auto-injection at the host level.
- On the Host settings page, select Host monitoring.
There are three tabs on this page:
- Monitoring
- Monitoring Mode
- Advanced Settings
- Go to Monitoring and set Monitor this host to turn monitoring on or off for the selected host.
- Go to Monitoring Mode and set Full-Stack, Infrastructure, or Discovery to turn the selected monitoring mode on or off for the selected host.
- For details, see Infrastructure and Discovery monitoring modes.
- The OneAgent's monitoring mode will automatically overwrite this setting whenever it is changed with oneagentctl or the OneAgent comes online.
- Go to Advanced settings and set ProcessAgent injection or CodeModule injection to turn the automatic injection on or off for the selected host.
- Select Save changes.
Container technologies
Dynatrace OneAgent automatically monitors all processes that are running on your monitored hosts. Within container environments (for example, Kubernetes, OpenShift, Cloud Foundry, or Docker), OneAgent automatically injects code modules into containerized processes to provide out-of-the-box full-stack visibility into applications running within containers.
-
On the Host settings page, select Container technologies.
-
For each container type, turn Enabled on or off to determine whether code modules are automatically injected.
- If turned on, auto-injection provides deep monitoring for all processes within containers, at both the request- and distributed trace levels, for the selected host.
- If turned off, OneAgent will not inject into a container of the selected type on the selected host.
Disk options
OneAgent automatically detects and monitors all your mount points, but you can create exception rules to remove certain disks from the monitoring list.
-
On the Host settings page, select Disk options.
-
Set host-specific disk options as needed.
-
Show all NFS disks Linux
When disabled, OneAgent attempts to deduplicate NFS disks. Disabled by default.
-
Exclude disks
You can create exception rules to remove disks from monitoring.
For details, see Exclude disks and network traffic from host monitoring.
-
Disk Analytics Extension
Linux
Install the Disk Analytics extension to gain more detailed visibility into local data stores and their volumes, partitions, and raid instances on Linux hosts.
-
On the Host settings page, select Disk Analytics Extension.
-
Turn Enable Disk Analytics data collection on or off to determine whether Disk Analytics data is collected on the selected host.
If you enable data collection without adding the extension, the data is visible only in Data Explorer.
For details on installing and using the Disk Analytics extension, see Disk analytics.
NetTracer traffic
Linux
NetTracer is an open-source tool for tracing TCP events and collecting network connection metrics on Linux.
- On the Host settings page, select NetTracer traffic.
- Turn Enable NetTracer traffic network monitoring on or off to determine whether NetTracer monitors network traffic on the selected host.
- Select Save changes.
For details, see Extended network monitoring.
Exclude network traffic
OneAgent automatically detects and monitors all of your network traffic, but you can exclude traffic on specific network interfaces or hosts from monitoring.
-
On the Host settings page, select Exclude network traffic.
There are two sections on this page:
- Exclude NIC—This section lists all network interfaces excluded from network traffic monitoring on a particular interface.
- To add an entry, select Add item
- To delete an entry, select
Delete row
- To edit an entry, expand
Details
- Exclude IP—This section lists all host IP addresses to exclude when calculating connectivity (other metrics will still be calculated).
- To add an entry, select Add item
- To delete an entry, select
Delete row
- To edit an entry, expand
Details
- Exclude NIC—This section lists all network interfaces excluded from network traffic monitoring on a particular interface.
-
Select Save changes.
For details, see Exclude disks and network traffic from host monitoring.
Detected processes
The Detected processes page is a read-only table of processes detected on the selected host.
- To manage your process monitoring settings, select the Process group monitoring link.
- To enable or disable deep monitoring for certain process groups on the host, select the Process group deep monitoring link.
For details, see Process deep monitoring.
Process group monitoring
To enable or disable deep monitoring for a certain process group on a host
-
On the Host settings page, select Process group monitoring.
The table lists process groups that have host-specific monitoring settings.
- To add an entry, select Add process group, select a Process group, and set Monitoring state for the selected processing group.
- To delete an entry, select
Delete row
- To edit an entry, expand
Details and change the settings.
-
Select Save changes.
For details, see Process deep monitoring.
Process group detection flags
The Built-in detection rules page lists process group detection flag settings for the selected host.
To enable or disable process group detection flags
-
On the Host settings page, select Process group detection flags.
If no host-level settings are configured, a message box offers a link to the equivalent settings on the host group level and, from there, up to the environment level.
-
Turn detection rules on or off as needed to set host-specific process group detection flags.
Hover over the information icon for a rule to view rule details.
-
Select Save changes.
For details, see Process group detection.
Declarative process grouping
Dynatrace automatically monitors process groups that are of known technology types or that consume significant resources. With declarative process grouping, you can automatically monitor additional technologies.
The Declarative process grouping page lists all process groups defined through declarative process grouping.
To add a declarative process group to the table
- On the Host settings page, select Declarative process grouping.
- Select Add process group.
- Enter a name, identifier, and reporting setting.
- Select Add detection rule to describe how to detect the process group: property and condition. See the on-screen instructions for help with conditions.
- Select Save changes.
For details, see Process group detection.
Process availability
Use Process availability to monitor if at least one process matching the specified monitoring rule exists on your host. If no process running on your host matches the rule, you receive an alert. If you also enable process instance snapshots, you receive a detailed report on the activity of the most resource-consuming processes, as well as on the latest activity of the processes matching the rule.
To add a process monitoring rule
- On the Host settings page, select Process availability.
- Select Add monitoring rule.
- Enter a rule name.
- Select Add detection rule to describe how to detect the process: property and condition. See the on-screen instructions for help with conditions.
- Select Add property to define additional key-value properties to be attached to the triggered event.
- Select Save changes.
For details, see Process availability.
Process instance snapshots
If you enable process instance snapshots, Dynatrace examines the most resource-consuming processes running on your host and the processes monitored by Process availability. When a triggering event occurs, metrics reported 10 minutes before and 10 minutes after the event for those processes are sent to the cluster.
To turn on process instance snapshots
- On the Host settings page, select Process instance snapshots.
- Turn on Enable Process instance snapshots.
- Set Reported processes limit to the maximum number of processes that the host will report.
- Select Save changes.
Business Observability
OneAgent can capture business events from incoming HTTP requests based on capture rules that tell OneAgent to capture business events when specific web services or endpoints are called.
- A capture rule consists of trigger rules, mandatory business event information (for example, type and provider), and optional event data fields.
- A trigger defines the criteria that, when met, cause a business event to be captured (for example, endpoint “/api/buy” is called).
To configure a capture rule on the host level
- On the Host settings page, select Business Observability > OneAgent.
- Select Add new capture rule.
- Define a rule. For details, see Business event capture.
- Select Save changes.
For details, see Business event capture.
Anomaly detection
Use the host-level anomaly detection pages to configure detection sensitivity, set alert thresholds, or disable alerting for the selected host.
To configure anomaly detection for the host
- On the Host settings page, select Anomaly detection > Infrastructure.
- Adjust the host-specific thresholds as needed.
- Select Save changes.
To configure anomaly detection for host disks
- On the Host settings page, select Anomaly detection > Disks.
- Adjust the host-specific thresholds as needed.
- Select Save changes.
For details, see Adjust the sensitivity of anomaly detection for infrastructure.
OneAgent updates
Use OneAgent updates to configure the selected host's OneAgent update behavior.
- Automatic updates at earliest convenience
- Automatic updates during update windows
- No automatic updates
Manually triggered environment updates override individual host update settings. To learn more about environment updates, see One Agent Updates.
To set automatic OneAgent update behavior on the selected host
- On the Host settings page, select OneAgent updates.
- Set Update mode.
- Select Save changes.
To manually update OneAgent on the selected host
- Set Update OneAgent to a specific version to the OneAgent version you want to put on the selected host.
- Select Update now.
OS services monitoring
Use OS services monitoring to set up alerts for OS services in undesirable states.
- On the Host settings page, select OS services monitoring.
- Select Add policy.
- Set System (Linux or Windows).
- Set Rule name.
- Define the alerting conditions.
- Select Save changes.
For details, see OS services monitoring.
Extension Execution Controller
Use Extension Execution Controller to configure the Extension Execution Controller (EEC) for OneAgent deployment.
- On the Host settings page, select Extension Execution Controller.
- Configure EEC settings:
- Set Enable Extension Execution Controller.
- Set Enable local HTTP Metric, Log and Event Ingest API.
- Set Enable Dynatrace StatsD.
- Set Performance profile. For details, see Performance profile - resource consumption.
- Select Save changes.
For EEC details, see About Extensions.
Log Monitoring
Use the Log Monitoring page to configure host-specific settings for log monitoring.
- On the Host settings page, select Log Monitoring.
- Open the configuration page for the settings you want to configure on this host.
- OneAgent configuration
- Custom log source configuration—for details, see Custom log source
- Log storage configuration—for details, see Log ingest rules
- Sensitive data masking—for details, see Sensitive data masking in OneAgent
- Timestamp configuration—for details, see Timestamp/splitting configuration
- Select Save changes.
Crash dump analytics
Use Crash dump analytics to manage the automatic detection of application crashes.
- On the Host settings page, select Crash dump analytics.
- Turn on/off Crash dump analytics to determine whether Dynatrace automatically detects application crashes on the selected host.
- Select Save changes.
For details on Linux and Windows core crash dumps, see Crash analysis.
 Hosts Classic