Configure error detection for web applications
- Dynatrace Classic
- How-to guide
- 8-min read
To set up how errors are captured, edit your application and expand the Errors section. Select the required error type and then configure an error to be captured, included in Apdex calculations, or considered for Davis AI problem detection and analysis.
Error types
Dynatrace categorizes errors into the following types.
- Request errors are detected by the browser and OneAgent on your servers.
- Custom errors are triggered directly in your application via the RUM JavaScript API.
- JavaScript errors are detected JavaScript exceptions thrown by the browser.
Configure request errors
By default, Dynatrace considers all 4xx and 5xx HTTP status codes to be request errors. CSP violations and errors with failed image requests are also captured as request errors. In addition, the RUM JavaScript can also use custom status codes to inform you of framework issues.
You can change the default settings by configuring request error rules.
Add a request error rule
To add a request error rule
-
Go to Web.
-
Select the application that you want to configure.
-
In the upper-right corner of the application overview page, select More (…) > Edit.
-
From the application settings, select Errors > Request errors.
-
Select Add request error rule.
-
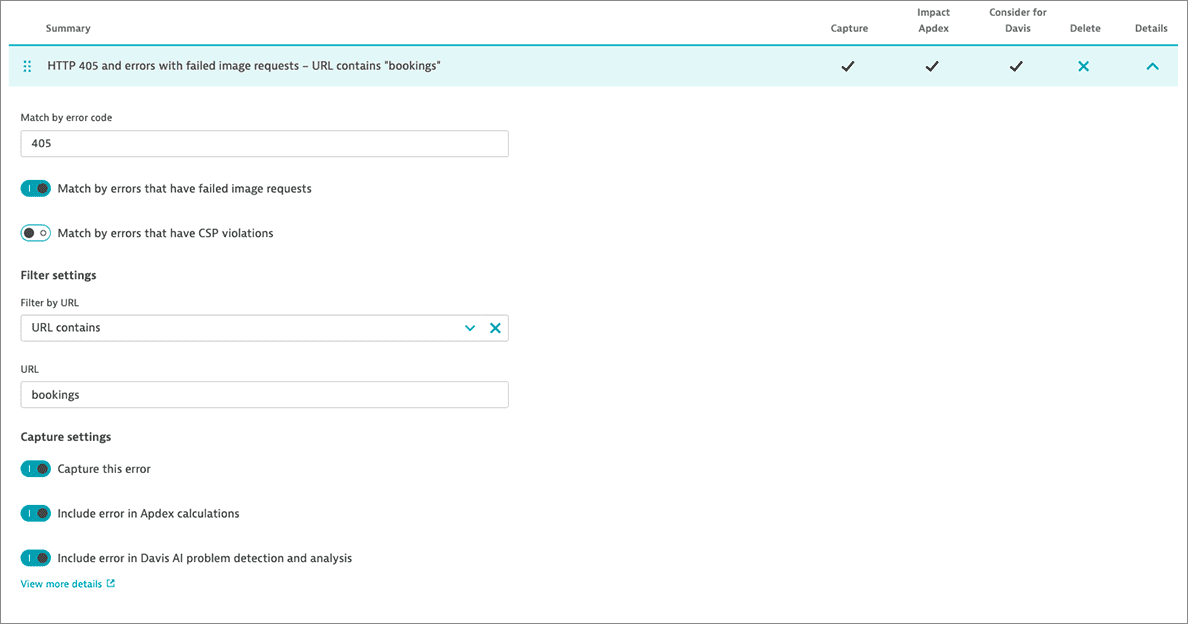
Use at least one of the following options:
- Match by error code. Provide either an individual HTTP error code, such as
404, or a whole error code range, such as400-499. - Match by errors that have failed image requests
- Match by errors that have CSP violations
- Match by error code. Provide either an individual HTTP error code, such as
-
Optional To apply the request error rule only to certain URLs, adjust the options under Filter settings.
-
Specify if you want to Capture this error. Also, you can Include error in Apdex calculations and Include error in Davis AI problem detection and analysis.
 Configuring a request error rule
If you opt for including the error in Davis AI analysis, Davis may report this error as a new open problem.
The request error rules are executed in the order of their appearance in the error list. Select and hold Drag row 
You can also turn on Ignore request errors in Apdex calculations to override Apdex settings for individual request error rules.
Manage custom status codes
Besides capturing standard HTTP error codes, the RUM JavaScript can also use custom status codes to signal that it detected a framework issue.
For applications created with Dynatrace version 1.238+, the RUM JavaScript reports some request errors using custom status codes 970–979 when the real HTTP status code can't be captured. Note that these custom status codes are not real HTTP status codes; they just mean that the RUM JavaScript detected an error fired by the framework you use.
Whether such request errors affect your users depends on your application. For example, if you send a request to a tracking service and the request is canceled, such an error hardly impacts the users of your application. However, a failed payment request would definitely inconvenience them.
The RUM JavaScript uses the following custom status codes:
| Code | Name | Explanation |
|---|---|---|
| 970 | Error | An unspecified error occurred in the used framework. |
| 971 | Canceled | The request was canceled. |
| 972 | Timeout | The request ran into a timeout. |
| 973 | Parse | Parsing the response failed. Reported by XMLHttpRequest, jQuery, and MooTools module. |
| 974 | Setup | An error occurred during the request setup. Only reported by MooTools module. |
| 979 | Unknown | An unknown framework error occurred. Only reported by jQuery and MooTools module. |
Applications created starting with Dynatrace version 1.238
For applications created starting with Dynatrace version 1.238, these custom status codes are detected automatically. They're included in Apdex calculations but are not considered for Davis AI analysis.
If you want to ignore these custom status codes, delete or disable the HTTP 970-979 request error rule.
To delete or disable the HTTP 970-979 request error rule
- Go to Web.
- Select the application that you want to configure.
- In the upper-right corner of the application overview page, select More (…) > Edit.
- From the application settings, select Errors > Request errors.
- Find the HTTP 970-979 error rule, and do one of the following:
- Select Delete row
to completely delete this request error rule.
- Expand the rule, and turn off Capture this error.
- Select Delete row
Applications created before Dynatrace version 1.238
For applications created with Dynatrace versions earlier than 1.238, the custom status codes are not used. If you want to capture these codes, add a request error rule with the following settings:
- Match by error code:
970-979 - Capture this error:
Enabled - Include error in Apdex calculations:
EnabledorDisabledbased on your needs - Include error in Davis AI problem detection and analysis:
EnabledorDisabledbased on your needs
Configure custom errors
Custom errors allow you to detect your own errors. An example of this is an error that is triggered during a form field validation.
For setting up a custom error, configure how Dynatrace should treat the error, and then trigger the error in your application using the RUM JavaScript API.
To add a custom error rule
-
Go to Web.
-
Select the application that you want to configure.
-
In the upper-right corner of the application overview page, select More (…) > Edit.
-
From the application settings, select Errors > Custom errors.
-
Select Add custom error rule.
-
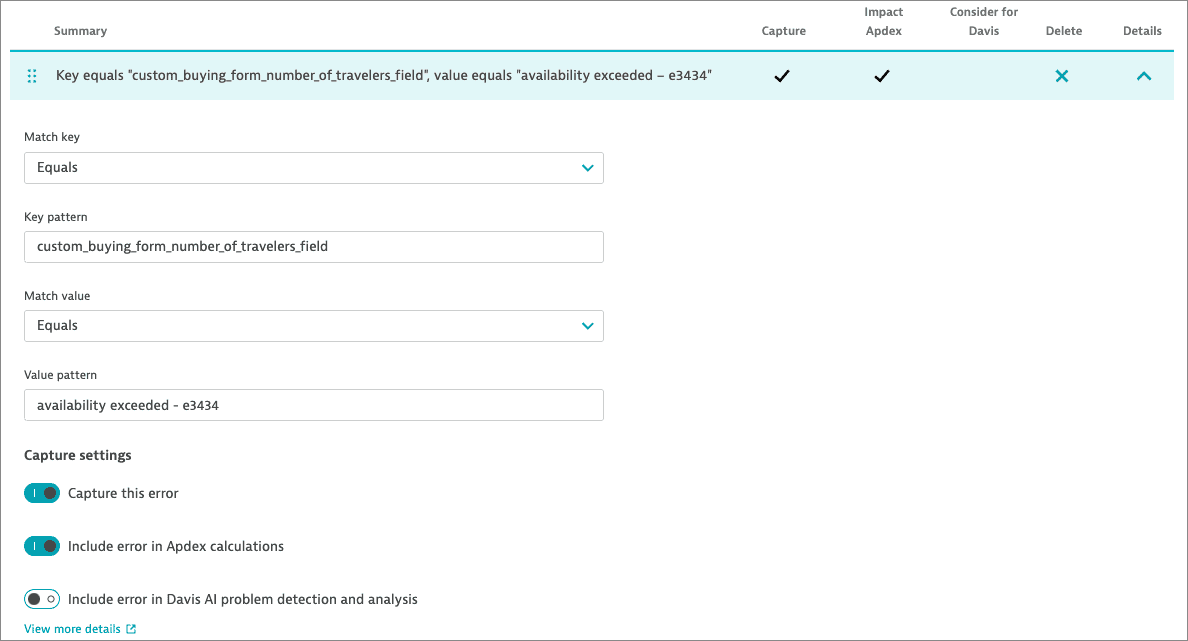
Provide the conditions that Dynatrace should use to identify the custom error.
- Use Match key and Key pattern for the custom error
key. - Use Match value and Value pattern for the custom error
value.Custom error rules are case-insensitive. For example, values such as
mykeyandMyKeYare treated the same.
- Use Match key and Key pattern for the custom error
-
Specify if you want to Capture this error. Also, you can Include error in Apdex calculations and Include error in Davis AI problem detection and analysis.
 Configuring a custom error rule
If you opt for including the error in Davis AI analysis, Davis may report this error as a new open problem.
The custom error rules are executed in the order of their appearance in the error list. Select and hold Drag row 
You can also turn on Ignore custom errors in Apdex calculations to override Apdex settings for individual custom error rules.
After adding or excluding a custom error in Dynatrace, you must trigger the error in your application using the dtrum.reportCustomError() method of the RUM JavaScript API.
For example, a form field error would require the following JavaScript method parameters:
| Parameter | Explanation | Example |
|---|---|---|
key | The name of the form field. | custom_buying_form_number_of_travelers_field |
value | The validation error triggered by the validator. | availability exceeded - e3434 |
hint | The actual user input. | 1000 |
Only key and value can be used to group and analyze custom errors; hint is optional information.
For more information on how to report custom errors, see RUM JavaScript API - reportCustomError.
Configure JavaScript errors
Browsers detect JavaScript errors automatically, so you don't have to add these errors. If you configure JavaScript errors to be captured, they are automatically included in Apdex calculations and Davis analysis.
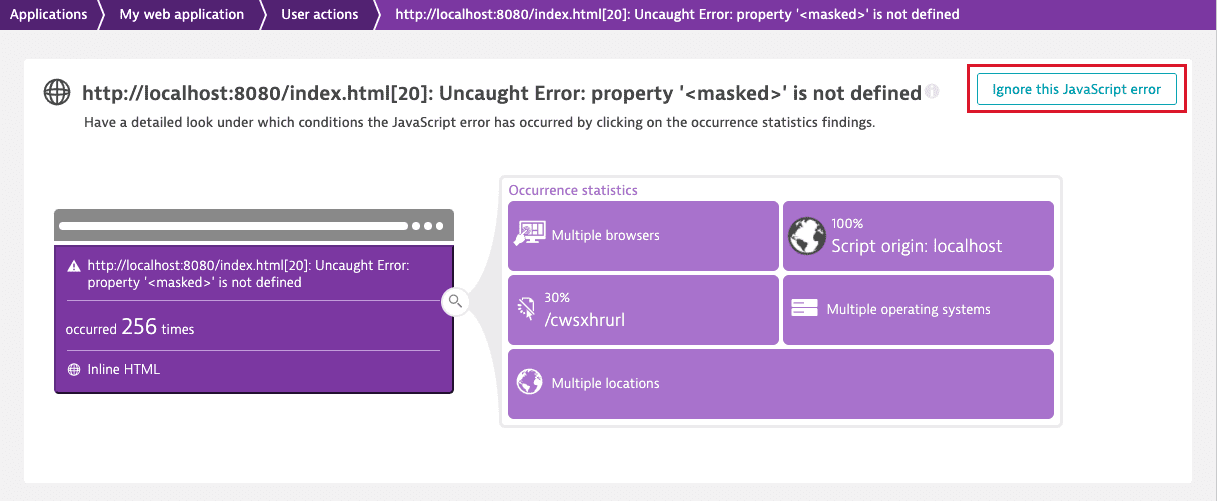
To ignore JavaScript errors on an individual level, select Ignore this JavaScript error on the respective JavaScript error details page.

To ignore all JavaScript errors in Apdex calculations
- Go to Web.
- Select the application that you want to configure.
- In the upper-right corner of the application overview page, select More (…) > Edit.
- From the application settings, select Errors > JavaScript errors.
- Turn on Ignore JavaScript errors in Apdex calculations.
Create additional error alerts for Davis
If the out-of-the-box alerting on request, custom, and JavaScript errors is not sensitive enough for you, or if you want to focus on an individual error, you can create additional error alerts.
To create additional error alerts
-
Go to Web and select the application to display the application overview page.
-
In the infographic, select Errors.
-
Under Errors by type, select Analyze by type.
-
Under Detail analysis for selected timeframe, set filters in the Filter by… box. Available filters in the Errors category are
Custom error name,Custom error type,Error type,Errors,Request error code,Request error resource, andRequest error type. -
Select Create metric.
-
In the opened overlay, adjust the metric settings, and select Create metric.
For details on creating and charting calculated metrics, see Create calculated metrics for web applications. -
Select Create alert.
-
Configure the alert settings. When done, select Create custom event for alerting.
For details on creating an alert, see Metric events.
Use a static threshold of
1if you want Davis to always raise a problem when a particular error occurs. If you're interested only in anomalies for that error, use auto-baselining.