Leverage enhanced endpoints for SDv1
- Latest Dynatrace
- How-to guide
- 8-min read
With Enhanced endpoints for SDv1, every detected endpoint on your SDv1 services automatically produces metrics: response time, throughput, and failure count. No key request configuration is needed. These metrics are available in  Dashboards,
  Notebooks, SLOs, and alerting. They are the same
 dt.service.request.* metrics produced by SDv2 and OpenTelemetry services, so a single dashboard query works across all service detection versions.
No endpoints are created for external services and for the following SDv1 service types: Background activity services, Queue listener services, and Key value store.
Availability and state
The availability and default state of the Enhanced endpoints for SDv1 feature depend on when your Dynatrace environment was created.
| Environment created in | Available in | Default | Possible to control? |
|---|---|---|---|
| Dynatrace version 1.329 and earlier | Dynatrace version 1.333+ | Off | Yes |
| Dynatrace version 1.330 – Dynatrace version 1.332 | Dynatrace version 1.330+ | On | Yes |
| Dynatrace version 1.333+ | Dynatrace version 1.330+ | On | No |
Benefits
- Dedicated metrics for every endpoint: Each detected endpoint produces its own metrics. These metrics are available not only in
 Services, but also in Dashboards, Notebooks, SLOs, and alerting.
 - Same metric keys as SDv2 and OpenTelemetry services: Queries, dashboards, and SLOs built on
dt.service.request.*metrics work identically regardless of whether the service uses SDv1, SDv2, or the OpenTelemetry SDK. - Complete endpoint visibility in Services: Gain a complete list of endpoints for SDv1 services in Services.
If you don't enable the Enhanced endpoints for SDv1 feature, the Endpoints section in
Services either remains empty or only shows key requests.
Endpoint metrics
When the Enhanced endpoints for SDv1 feature is turned on, Dynatrace starts collecting metrics for all detected endpoints of an SDv1 service in Grail.
The following metrics are collected for each endpoint:
| Metric | Key |
|---|---|
| Throughput | dt.service.request.count |
| Failure count | dt.service.request.failure_count |
| Response time | dt.service.request.response_time |
These are the same metric keys used by SDv2 and OpenTelemetry-instrumented services. Queries, dashboards, and SLOs built on these metrics work identically regardless of whether the service uses SDv1, SDv2, or the OpenTelemetry SDK.
Enable enhanced endpoints for SDv1
You can activate the Enhanced endpoints for SDv1 feature for the entire environment or for a specific host group, Kubernetes namespace, and cluster.
Environment
- Go to
 Settings > Process and contextualize > Services.
 - Under Service detection v1, select Enhanced endpoints for SDv1.
- Turn on Enable enhanced endpoints for SDv1.
- Recommended Turn on Resolve request attributes for SDv1 request naming rules. For details, see Request attribute values in SDv1 endpoint names.
Host group
- Go to Settings.
- In the upper-left corner of the page, select Go to entity, filter by Host group, and select the host group you want to configure.
- Go to Process and contextualize > Services > Enhanced endpoints for SDv1.
- Turn on Enable enhanced endpoints for SDv1.
- Recommended Turn on Resolve request attributes for SDv1 request naming rules. For details, see Request attribute values in SDv1 endpoint names.
Kubernetes namespace or cluster
- Go to
") Kubernetes.
Kubernetes. - Select the required namespace or cluster.
- In the upper-right corner of the namespace or cluster details pane, select (Actions menu) > Service detection settings.
- Go to Process and contextualize > Services > Enhanced endpoints for SDv1.
- Turn on Enable enhanced endpoints for SDv1.
- Recommended Turn on Resolve request attributes for SDv1 request naming rules. For details, see Request attribute values in SDv1 endpoint names.
The Enhanced endpoints for SDv1 settings page is not available for the environments created in Dynatrace version 1.333+.
Enabling the Enhanced endpoints for SDv1 feature changes some request names and their associated endpoint names. For this reason, your existing API metric queries, dashboards, and configured alerts for the changed endpoints might be impacted, so you should reconfigure them. See Changes to endpoint names for the details.
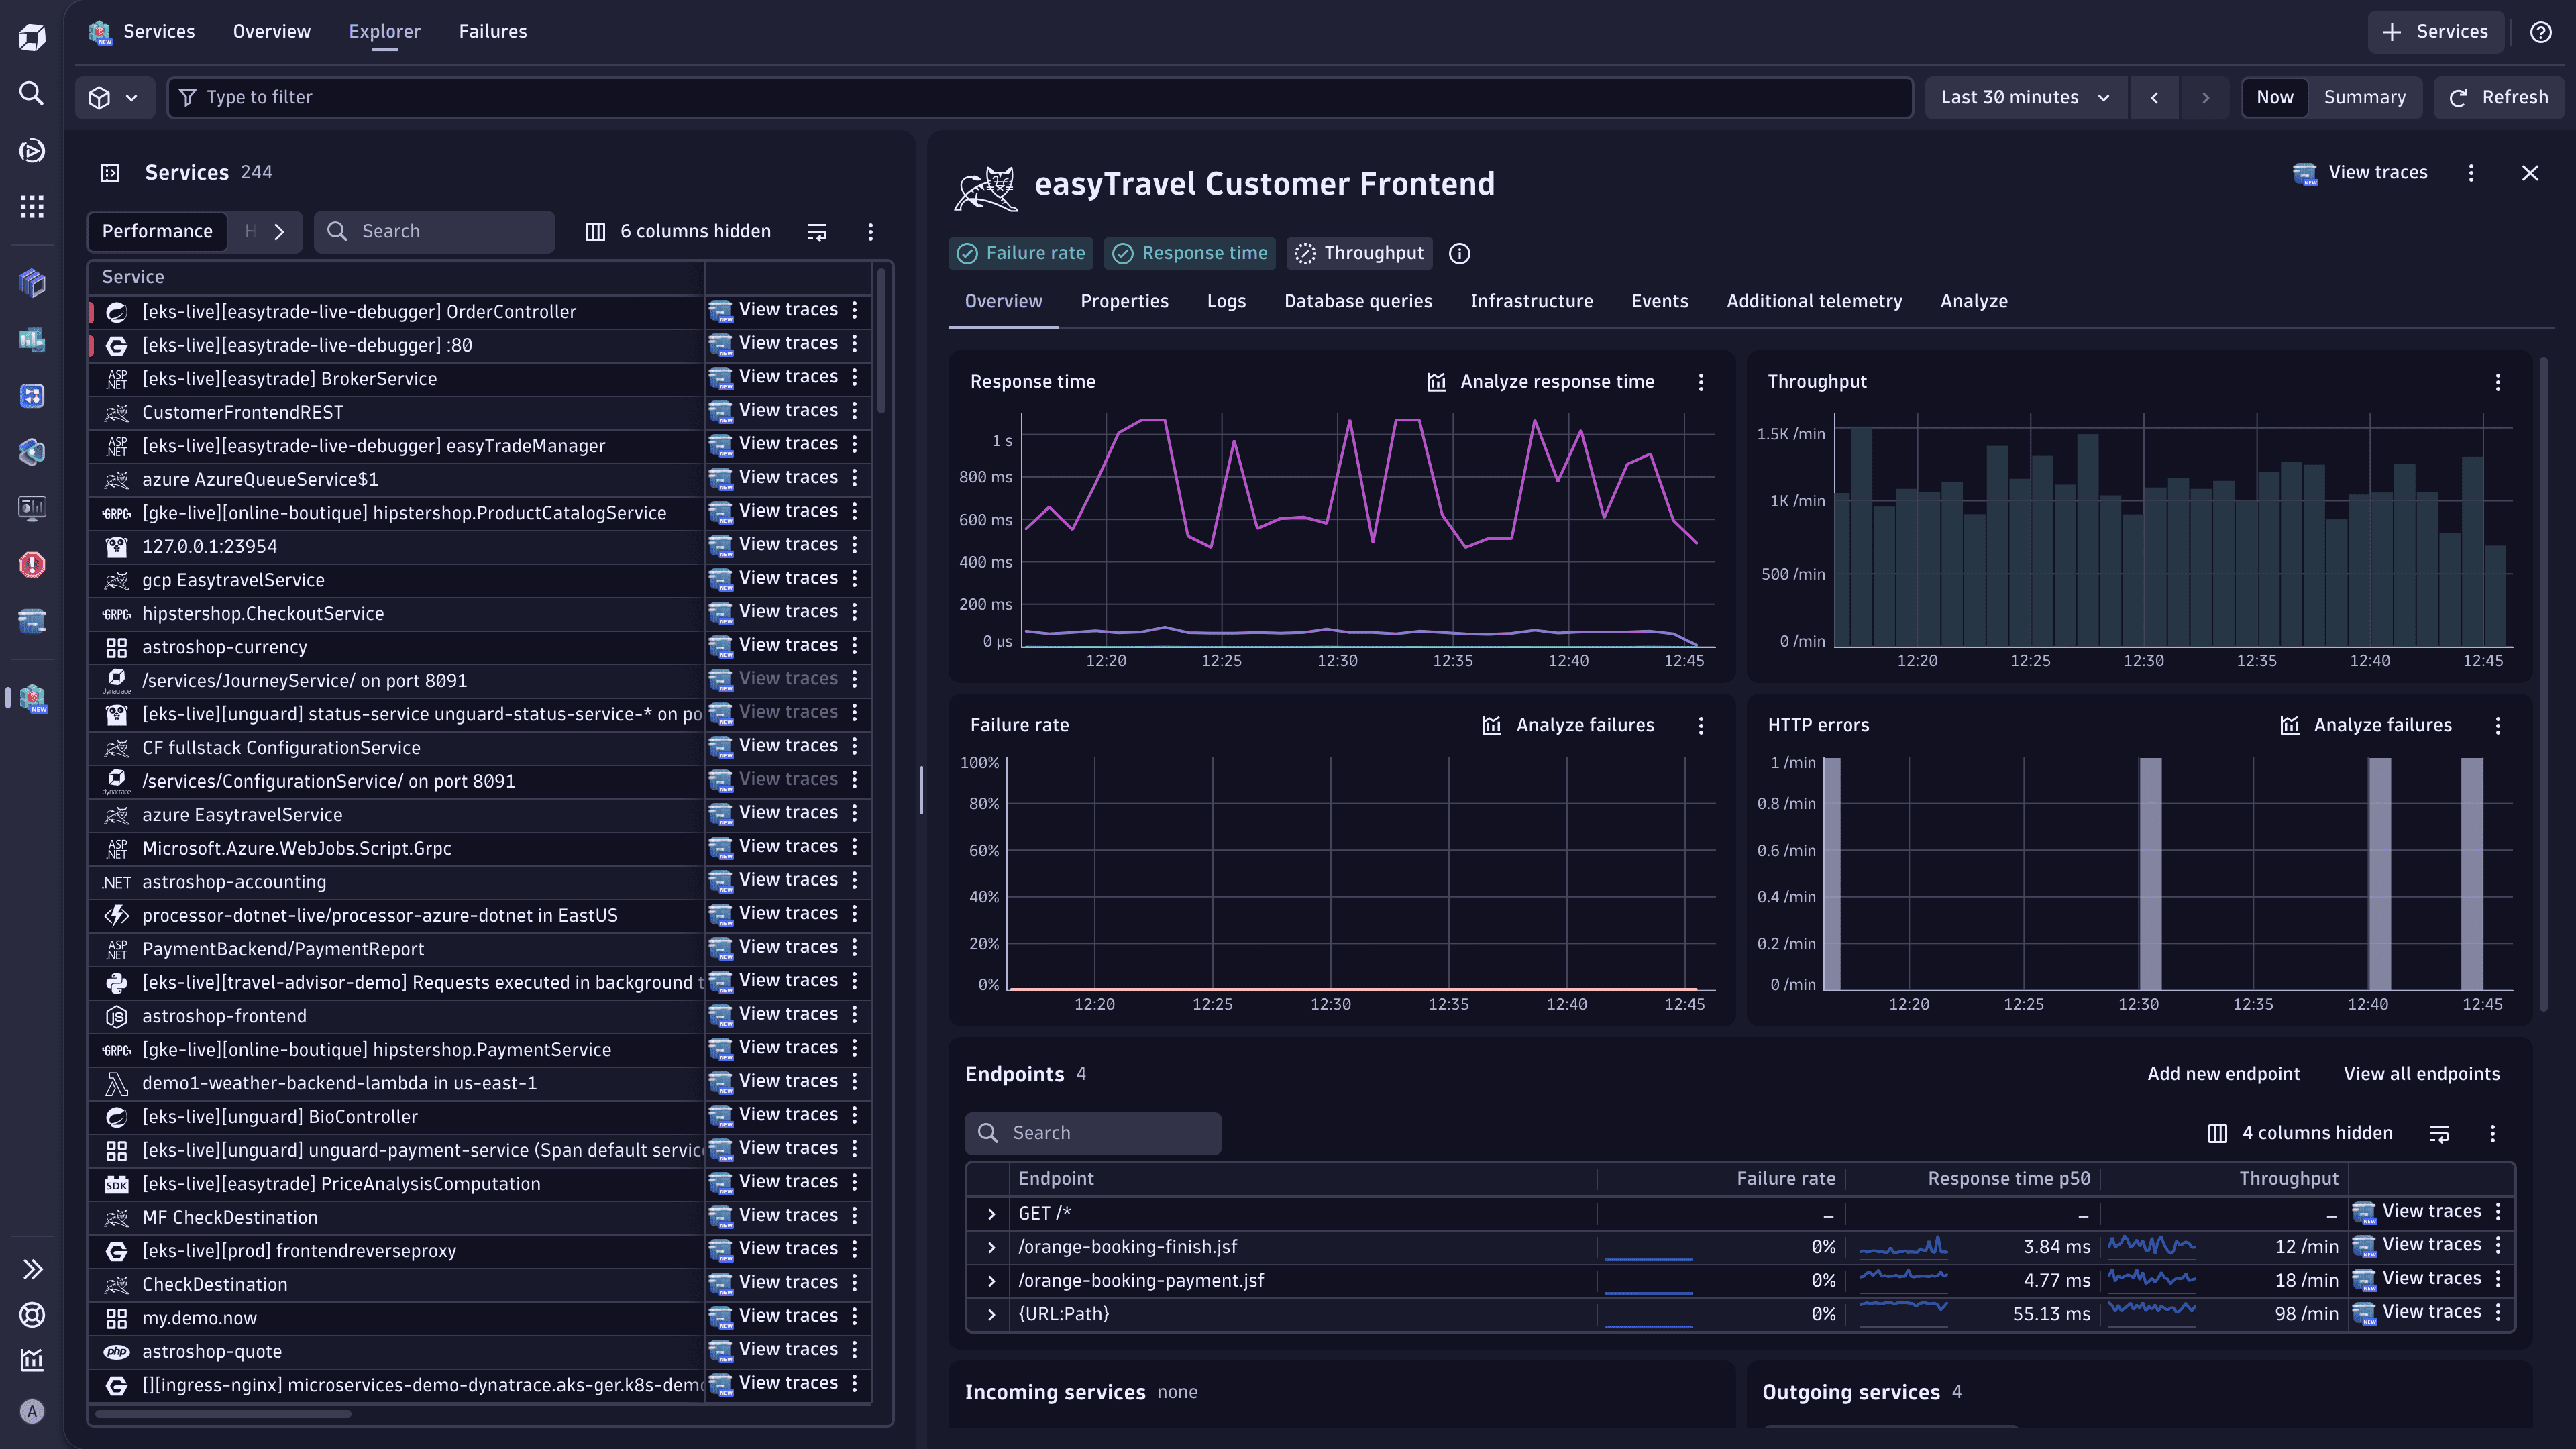
View service endpoints
Service endpoints as well as the related metrics are displayed in Services, in the Endpoints section.
- Go to Services > Explorer.
- Find and select the service for which you want to explore the endpoints.
- On the Overview tab, scroll down to the Endpoints section.
From there, you can view the service endpoints, check the related endpoint metrics, view traces for each endpoint, and more. Select (Actions menu) for the endpoint to view the available options.
Dynatrace auto-detects endpoints for your services. However, you can edit the detected endpoints, for example, to monitor a specific HTTP path that was not caught by the default endpoint detection rules.
To modify auto-detected endpoints, create custom request naming rules.
Use the Endpoint Cardinality Dashboard to see which services have the most endpoints and act accordingly. For more information, see Dashboard with endpoint-heavy services.
Dashboard with endpoint-heavy services
The Endpoint Cardinality Dashboard displays services with the most endpoints (SDv1 and SDv2 services).
This dashboard allows you to quickly identify endpoint-heavy services for which you could adjust the request naming rules (SDv1) or endpoint detection rules (SDv2).
To view services with the most endpoints
- Go to Dashboards.
- In the Dashboards panel on the left, select All dashboards.
- In Search by name, enter Endpoint Cardinality Dashboard.
- Select the dashboard to open it.
To display additional endpoint-heavy services, duplicate this dashboard and edit the DQL query behind the service list (for example, change 100 in limit 100 to the required value). Alternatively, you can add this query to Notebooks and modify it there.
Changes to endpoint names
Enabling the Enhanced endpoints for SDv1 feature changes some request names and their associated endpoint names. Check the flowchart and textual description below for the details.
For all service types, the already existing key requests and request naming rules continue to apply.
If you have set up key requests, the associated endpoints have the same names as their key requests. If you have configured request naming rules, they are also applied to the related endpoint names.
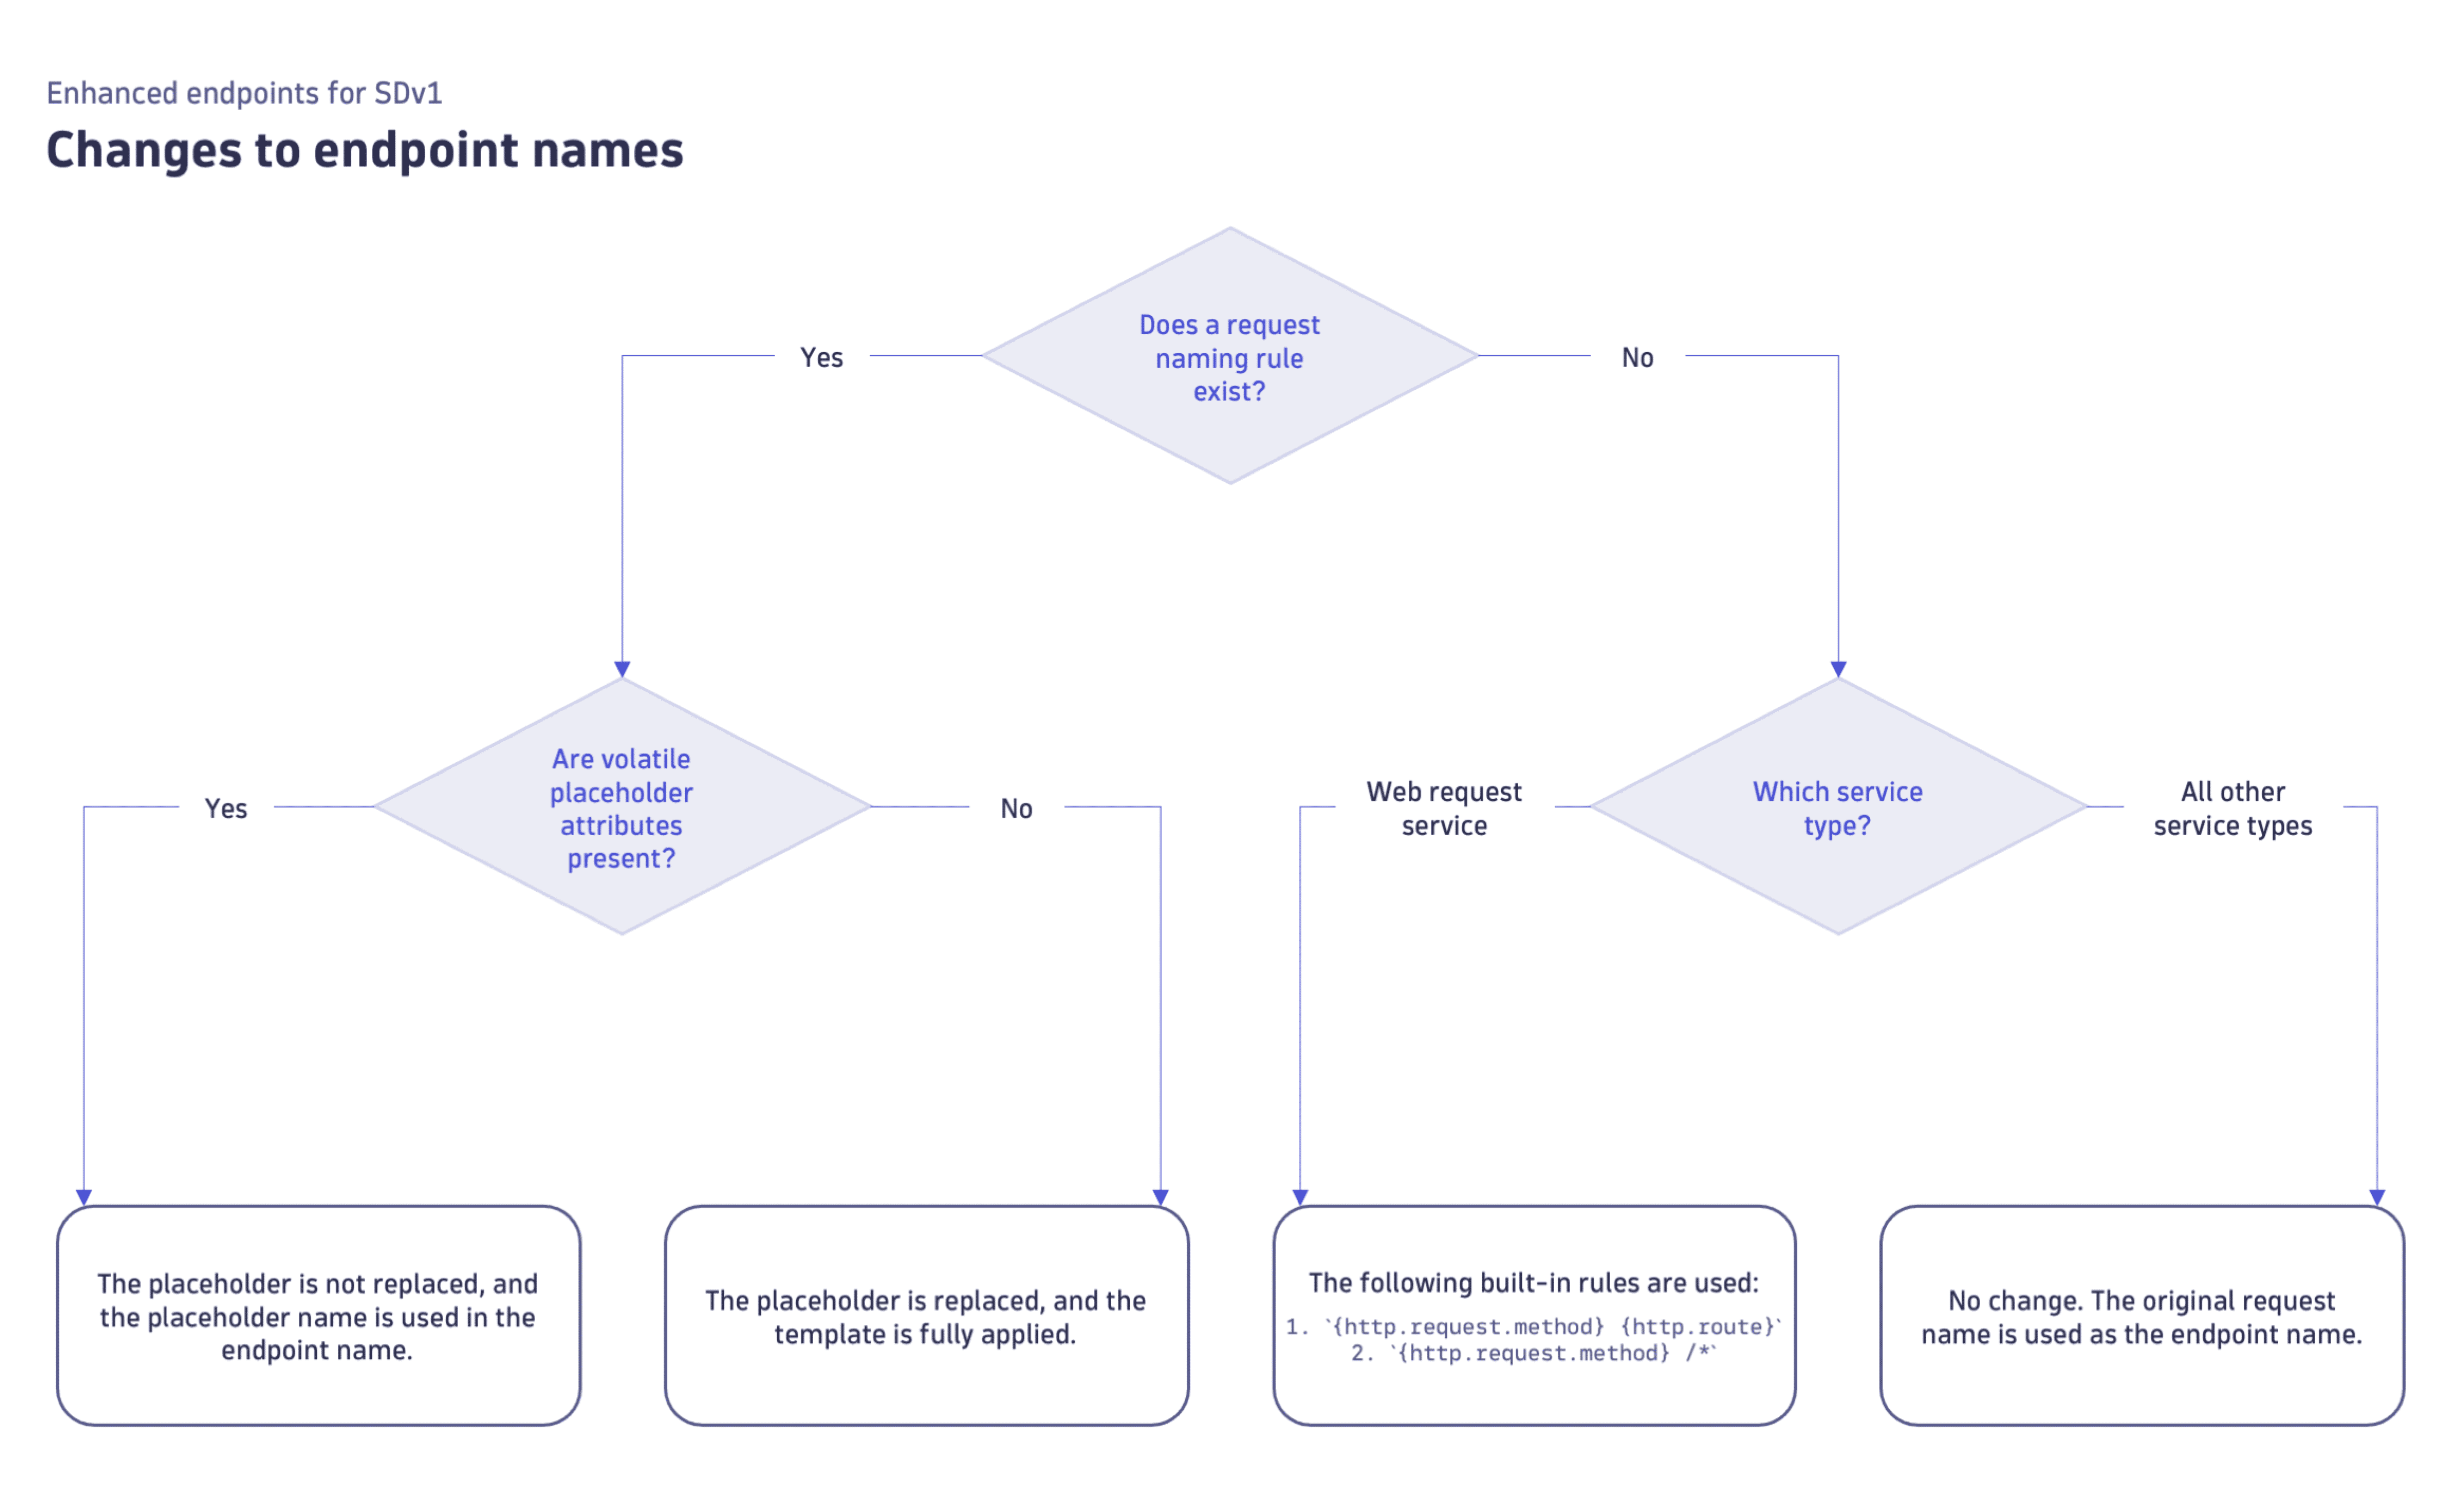
When the Enhanced endpoints for SDv1 feature is on, some endpoint names for web request services and other service types are changed. This depends on whether there's an associated request naming rule and whether volatile placeholder attributes are used in these rules.
For example, if the spans have no {http.route}, the endpoint name is GET /*.
For example, the {HTTP-Method} - {Request:IsKeyRequest} - user authentication endpoint template results in the GET - yes - user authentication endpoint endpoint name. Note that both {HTTP-Method} and {Request:IsKeyRequest} are replaced with their corresponding values (that is, GET and yes), as these are non-volatile placeholder attributes.
For example, the {HTTP-Method} - {URL} - user authentication endpoint template results in the GET - {URL} - user authentication endpoint endpoint name. Note that {HTTP-Method} (non-volatile placeholder attribute) is replaced with GET , while {URL} (volatile placeholder attribute) is not replaced and is used as is.
You can modify endpoint names by creating custom naming rules.
Volatile placeholder attributes
The volatile placeholder attributes are as follows:
{OneAgentAttribute:}excepthttp.route{Relative-URL}{URL:Path}{URL:Query}{URL}- Customer-defined patterns based on one of the above-stated patterns
Required actions
As some request names and their associated endpoint names change after you enable the Enhanced endpoints for SDv1 feature, your existing API metric queries, dashboards, and configured alerts for the changed endpoints might be impacted. For this reason, you should reconfigure the affected entities.
Request attribute values in SDv1 endpoint names
When the Resolve request attributes for SDv1 request naming rules feature is turned on, the {RequestAttribute:_} non-volatile placeholder attribute (used in SDv1 request naming rules) is replaced with the corresponding value, resulting in endpoints that contain explicit request attribute values.
This is the standard behavior, and we recommend turning on the Resolve request attributes for SDv1 request naming rules feature when it's not activated by default. This way, you can see separate endpoints per request attribute value. To verify your setup, see Enable enhanced endpoints for SDv1.
The availability and default state of the Resolve request attributes for SDv1 request naming rules feature depend on when your Dynatrace environment was created.
| Environment created in | Available in | Default | Possible to control? |
|---|---|---|---|
| Dynatrace version 1.333+ | Dynatrace version 1.333+ | On | No |
| Dynatrace version 1.332 and earlier | Dynatrace version 1.333+ | Off | Yes |
If your requests contain high‑cardinality request attributes and you've used the {RequestAttribute:_} placeholder attribute in request naming rules, you might get an excessive number of endpoints. In this case, deactivating the Resolve request attributes for SDv1 request naming rules feature should solve this issue. Complete the instructions in Enable enhanced endpoints for SDv1, but turn off Resolve request attributes for SDv1 request naming rules.
Static resource requests
Static resource requests include Image, Binary, CSS, and JavaScript.
When the Enhanced endpoints for SDv1 feature is turned on, all static resource requests are unmuted and grouped into a single Static resources endpoint that has the same metrics as other regular endpoints.
However, you can mute your static resource requests.
Whether the Static resources endpoint is muted or not, you can always go to  Distributed Tracing to view and analyze spans like CSS, images, or binary.
Mute static resource requests
To mute static resource requests, follow the steps described in Mute monitoring of service requests.
After you mute your static resource requests, the Static resources endpoint is not displayed in the endpoint list in Services, and these requests don't count toward the overall service metrics.
Manage resource request detection
You can add or edit filename extensions that count towards the Static resources endpoint. For details, see Configure resource request detection.
Your existing configuration for resource request detection is still applicable, so if you have already added additional filename extensions, the corresponding requests should also become a part of the Static resources endpoint.
Licensing considerations
When you activate Enhanced endpoints for SDv1, Dynatrace collects metrics for each detected endpoint individually, rather than aggregating non-key-request endpoints into a single NON_KEY_REQUEST entry. This provides significantly better visibility into service behavior. The additional metric volume is typically within the included metric allowance for Full-Stack Monitoring.
Use the Endpoint Cardinality Dashboard to check which services produce the most endpoints and adjust request naming rules if you need to reduce cardinality.
 Services