Profiling
- Latest Dynatrace
- App
- 10-min read
- Published Nov 12, 2026
- Early Access
 Profiling shows where your code spends CPU time, allocates memory, and waits. OneAgent samples your running processes and adds up the cost method by method, so you can find the code behind a slow request, a CPU spike, or growing memory usage in the processes where the problem occurs.
Key capabilities
Use Profiling to answer questions like these:
- Why is this request slow? See which methods take the time, how often they run, and what each call costs.
- What causes this CPU spike? Find the busiest processes and the method hotspots behind their CPU use.
- What puts pressure on memory? For JVM-based processes, see which methods allocate the most memory and which allocations stay alive.
- Why are threads blocked? For JVM-based processes, see whether threads run code or spend their time locking or on disk and network I/O.
The app also gives you these benefits:
- A direct path to the code to fix: Each analysis leads you to specific methods, allocations, or threads, so you know where to start optimizing.
- No code changes: OneAgent collects the profiling data. You don't need to change or instrument your code.
- The right processes in a few selections: Filtering facets in the Explorer view let you narrow your environment by different criteria.
Prerequisites
Before you start using Profiling, make sure your environment meets these requirements. Some analyses have additional requirements, as noted.
- Dynatrace SaaS environment with Profiling installed from
 Hub.
- OneAgent deployed at the host level in one of these monitoring modes:
- Full-Stack: Profiling is always on.
- Infrastructure or Discovery: Activate Observability for Developers. In Discovery mode, you also need code-module injection.
- For Memory and Threads analysis: a JVM-based process.
- For Method executions: distributed traces for the process in the selected timeframe.
Permissions
When you install or first open Profiling, your administrator grants this app access to read the following data on your behalf. The app only reads data and writes only your own saved preferences.
| Permission | Description |
|---|---|
storage:entities:read | Resolve processes, process groups, and process group instances and request profiling analysis. |
storage:profiles:read | Read profiling data for CPU hotspots, thread analysis, and memory allocation. |
storage:spans:read | Build the Method executions view from traces. |
storage:buckets:read | Required to read data from storage alongside the data scopes. |
storage:smartscape:read | List the processes that can be profiled. |
storage:metrics:read | Show CPU usage charts next to the profiles. |
storage:events:read | Mark processes whose OneAgent has profiling activated. |
storage:filter-segments:read | Let you select segments in the Explorer view. |
settings:objects:read | Recognize API frames so that the call tree can label them. |
app-settings:objects:read, app-settings:objects:write | Remember saved views and your preferences. |
state:user-app-states:read, state:user-app-states:write | Remember your table settings, such as visible columns, sorting, and pagination. |
If a part of the app is empty or reports a permission error, ask your administrator to grant you the required permissions.
Get started
Install Profiling, get to know its main views, and find the code behind the high CPU usage in your first process. This section also explains how profiling is billed.
Install app
To install Profiling
- In Dynatrace, go to Hub.
- Search for Profiling, and select its tile.
- In the upper-right corner of the Profiling overlay, select Install.
After installation, you can open the app from Hub > Manage or from the Apps menu.
Explore main app views
Profiling has two main views: Explorer and a process profiling page.
-
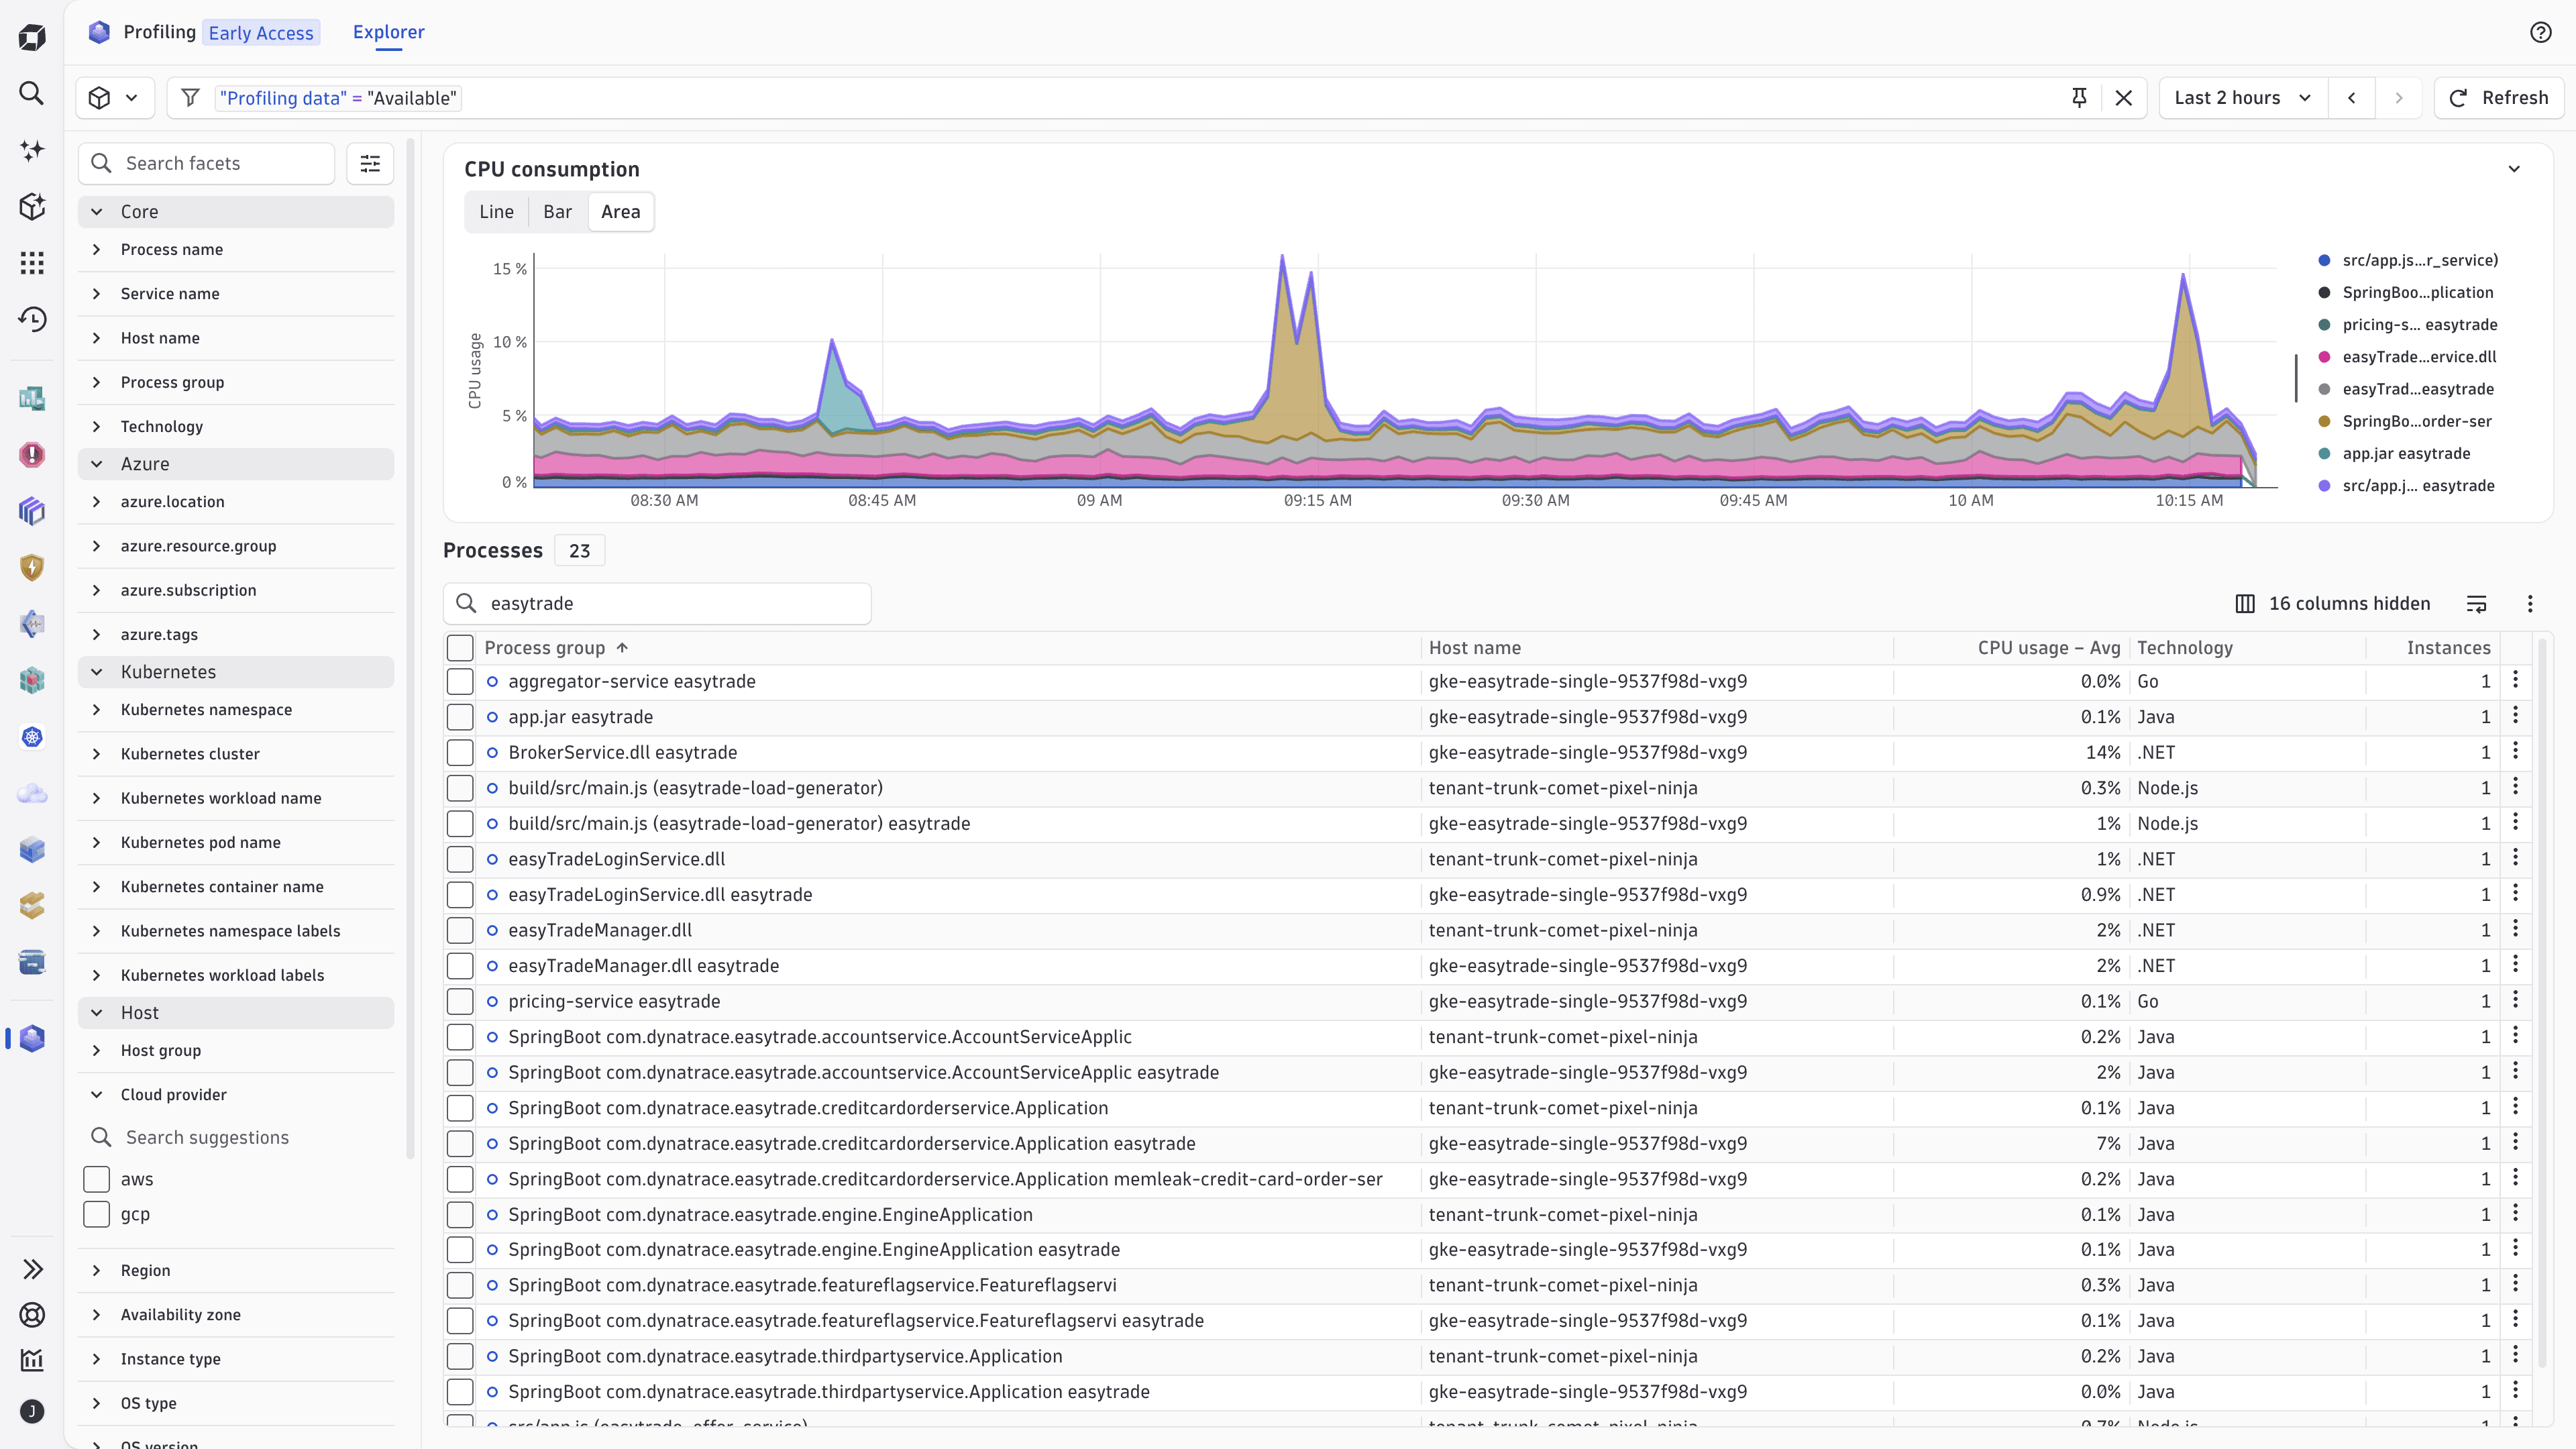
Explorer is available as a tab in the app header. This view lists your processes with profiling data and charts their CPU consumption over time. For details, see Explorer view in Dynatrace apps.
-
A process profiling page shows profiling data for one process group or up to 10 process groups at once.
Find high CPU use
To find the code behind high CPU use in a process
-
Go to
Profiling > Explorer. This view loads data for the last two hours. -
Find the process you want to analyze.
By default, the list shows only processes with profiling data. To narrow the list, enter a process name or its part in Search by name located above the process list.
-
Optional To see the busiest processes first, select the CPU usage column header.
-
Select a process row. The process profiling page opens.
-
On the Method hotspots tab, check the Flame graph. Wide blocks use the most CPU.
-
On the CPU tab, drag across the CPU usage chart and select Zoom to selection to view a shorter period. The selection becomes the new timeframe.
Understand billing
Billing for Profiling depends on the monitoring mode of OneAgent on your hosts.
- Full-Stack mode: Profiling is included in Full-Stack Monitoring. If you also activate Observability for Developers,
 Live Debugger is turned on and billed through Code Monitoring. Deactivating Observability for Developers turns off Live Debugger, but profiling stays on.
- Infrastructure or Discovery mode: Activating Observability for Developers turns on both profiling and Live Debugger, billed through Code Monitoring. Deactivating Observability for Developers turns off both profiling and Live Debugger and stops Code Monitoring billing.
Explorer
The Explorer view is where you decide what to investigate. Use it to narrow your environment to the processes you care about, see which of them use the most CPU, and open their profiling data.
Process list
The process list has one row per process group. By default, it shows the following columns:
- Process group: The process group name, with an icon that shows whether the process has profiling data. Two different icons mark processes with and without profiling data.
- Host name.
- CPU usage: The average CPU usage over the selected timeframe.
- Technology.
- Instances: The number of process instances in the group.
The header above the table shows the number of matching processes and the number of hidden columns. To show more columns, such as Kubernetes, cloud, and host properties, open the column settings. You can't hide the Process group column.
To sort the list, select a column header. Select it again to reverse the order.
Timeframe
Use the timeframe selector in the upper-right corner of the Explorer view. For details, see Timeframe selector.
The timeframe applies to the process list and the CPU consumption chart. The app carries the timeframe over to the process profiling page when you open a process.
Filters
Filters take you from your entire environment to the processes you own, without requiring you to know process names in advance.
The facet panel on the left of the Explorer view groups filterable properties. The following facet groups let you filter by where and how your processes run:
- Core: Process, Service, or hostname, process group, and technology.
- Primary tags: Custom tags that your organization defines, for example,
owner,role, orteamtags. - Azure: Azure location, resource group, subscription, and tags.
- Kubernetes: Kubernetes cluster, namespace, workload name, pod name, container name, namespace labels, and workload labels.
- Host: Properties of the host that runs the process.
- Profiling > Profiling data: Availability of profiling data for the process.
To filter the process list
- Enter a process name or its part in Search by name to narrow the process list to matching process names.
- Use Search facets to find a facet quickly.
- Select values in a facet or enter values in the filter field to build conditions.
- By default, the Explorer view shows only processes with profiling data. To show all processes, select both Available and Not available for the Profiling data facet, and then select Apply.
CPU consumption chart
The CPU consumption chart above the process list shows CPU usage over time for the processes at the top of the list. The legend identifies each line.
Profile process groups
You can profile a single process group or combine up to 10 process groups to analyze them together.
To profile one process group
- Go to Profiling > Explorer.
- Find the process you want to analyze.
- Select a process row. The process profiling page opens.
To profile several process groups together
- Go to Profiling > Explorer.
- Select the checkboxes of the process rows you want to profile.
- Select Profile above the process list. All selected process groups open on one process profiling page.
You can profile up to 10 process groups at a time. Profiling many process groups loads more data and can take longer. If loading is slow, select fewer process groups or a shorter timeframe.
Process profiling page
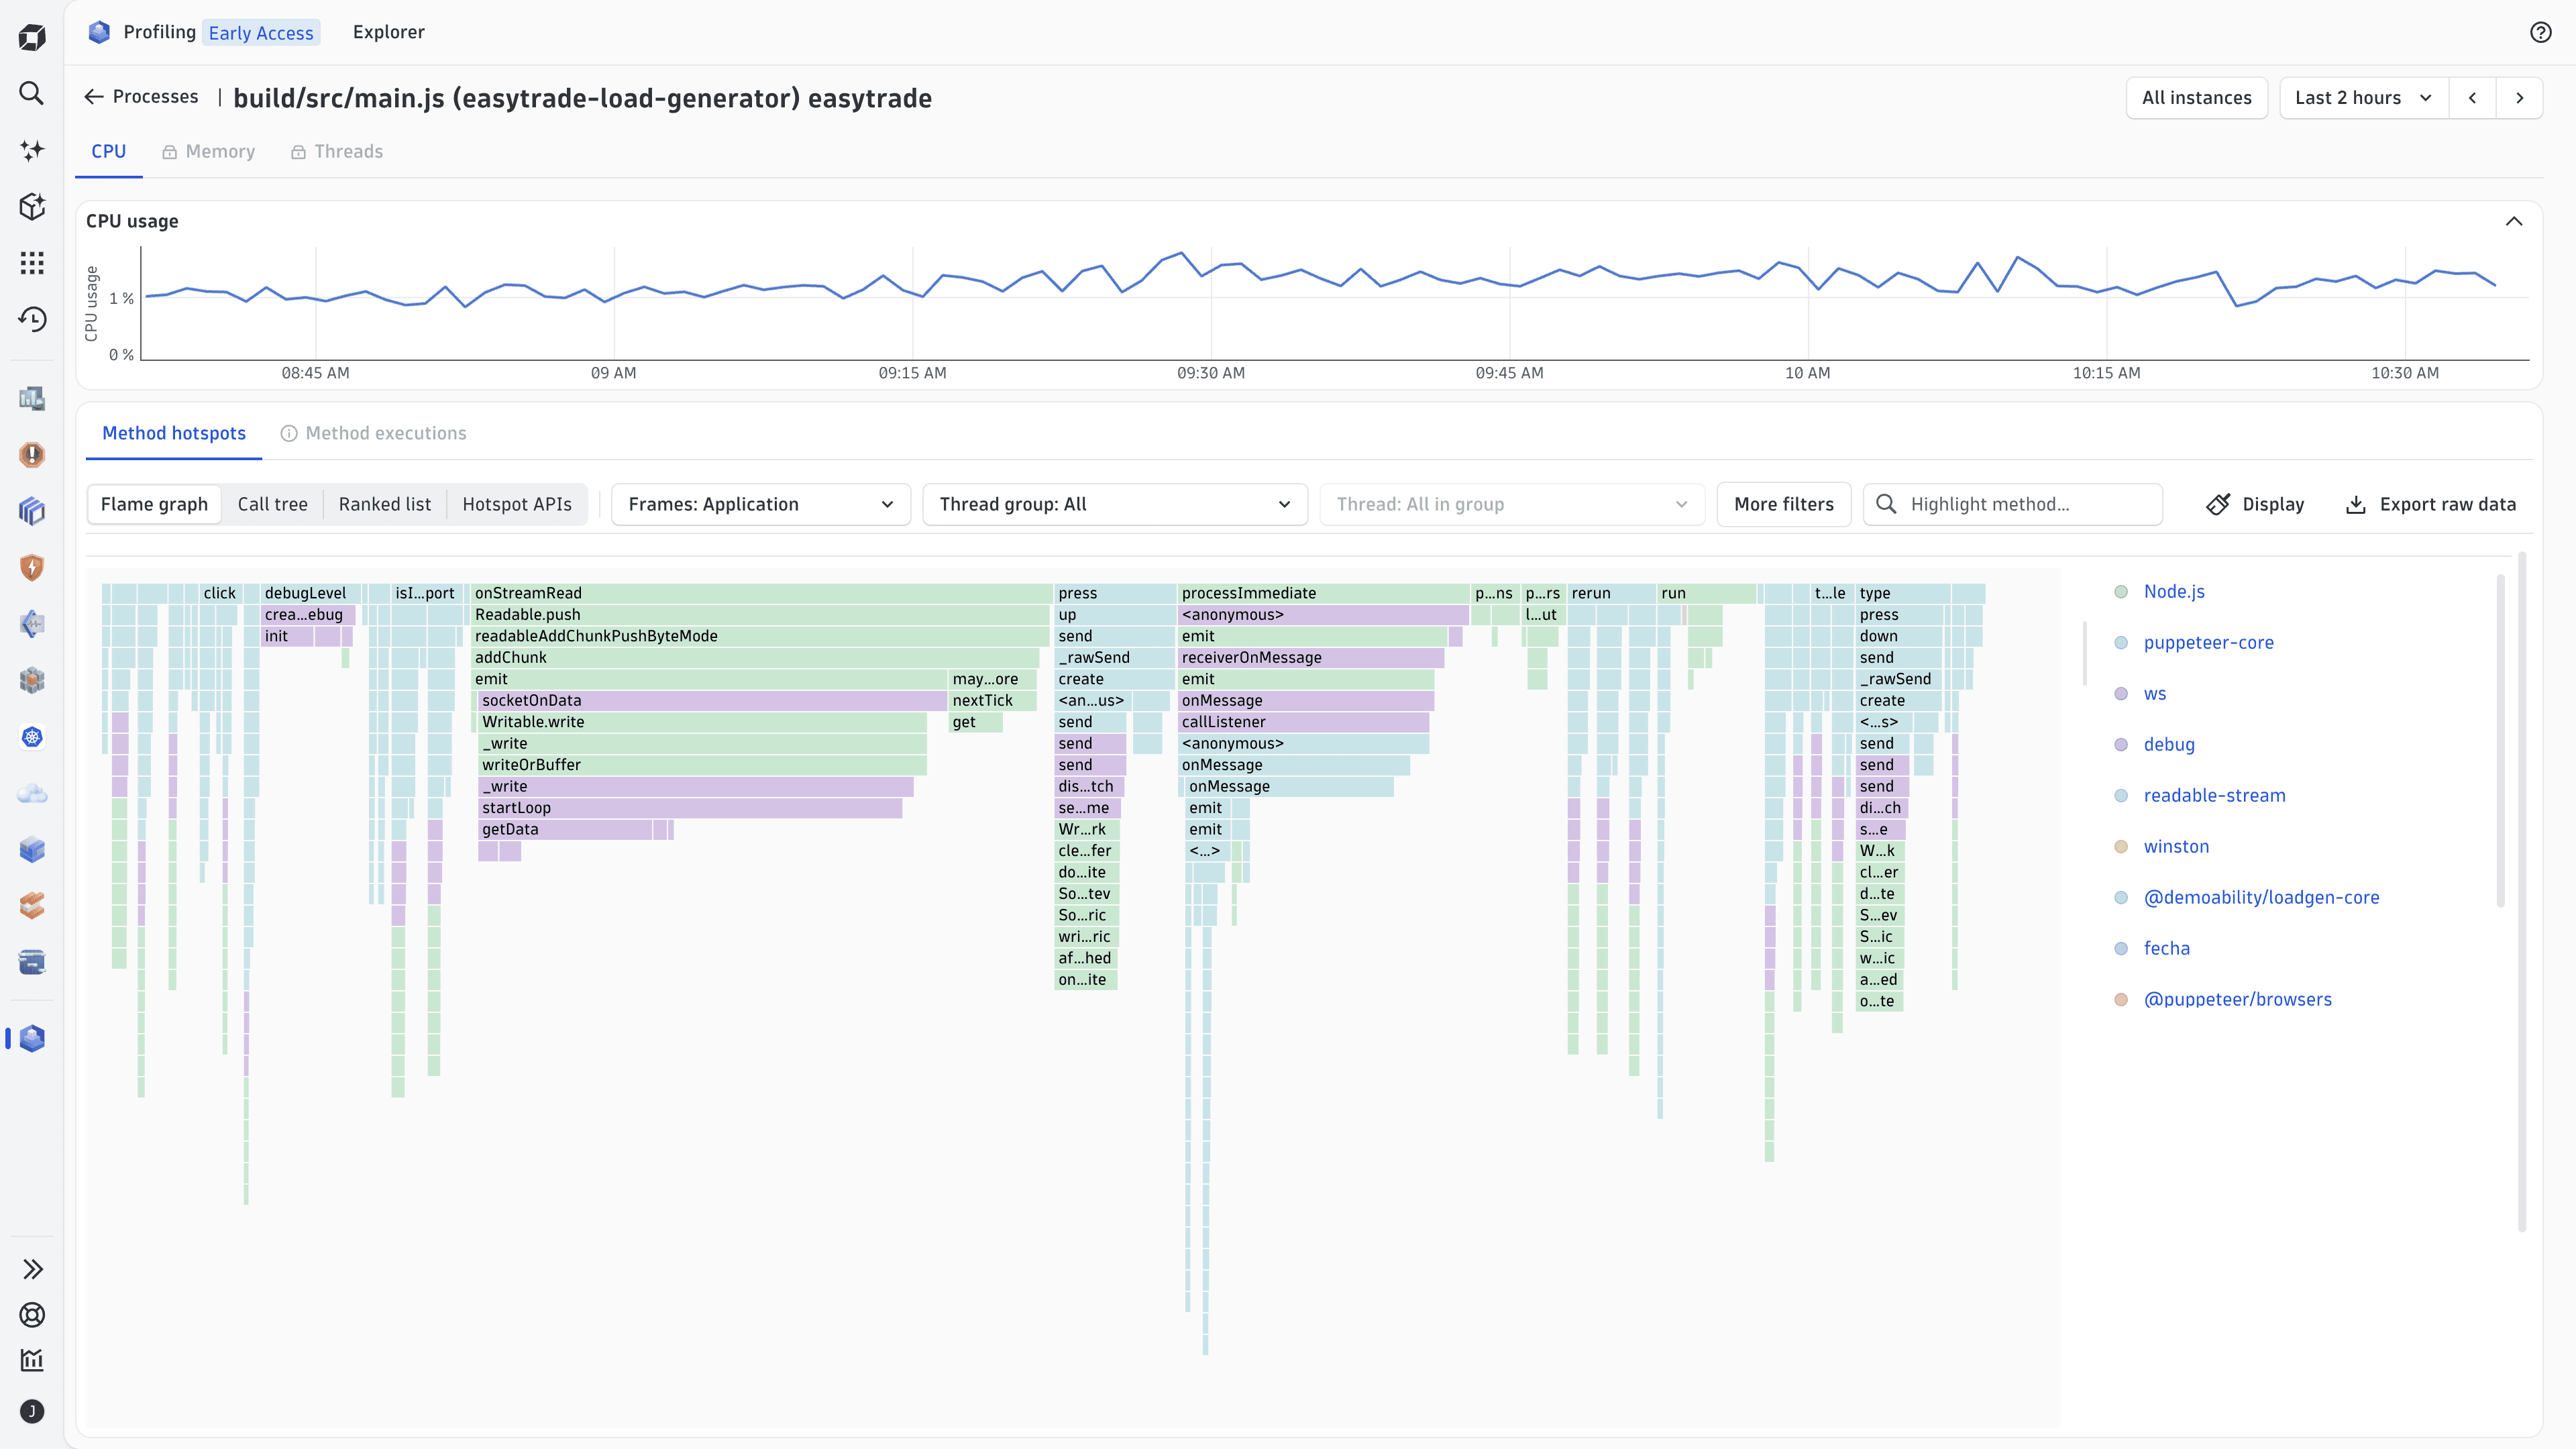
The process profiling page shows CPU, memory, and thread data for the selected process groups, so you can find the methods that consume the most resources.
The process profiling page contains:
- The instance selector. It shows All instances by default. Select a single instance to narrow every tab to that instance.
- The timeframe selector.
- Three tabs:
Profiling data is limited to the most recent 24 hours of the selected timeframe. If you select a longer timeframe, only the latest 24 hours are analyzed.
The URL of the process profiling page keeps the selection, tab, view, and timeframe, so you can copy it to share what you see.
When you select several process groups, the Aggregated label and the Aggregated across n process groups note appear under the process group name. This aggregation means that the data of all selected process groups is combined. Features that require a single process group are deactivated, with an explanation provided.
CPU
The CPU tab starts with a collapsible CPU usage chart. Drag across the chart to select a time range. Next to the selection, a panel shows the range and the number of data points. Select Zoom to selection to make the range the page timeframe and reload the data.
The CPU tab has two subsections below the CPU usage chart:
- Method hotspots is based on profiling samples and offers a flame graph, a call tree, and a ranked list.
- Method executions is based on distributed traces and shows how often methods ran and what each call cost.
Method hotspots
Method hotspots uses profiling samples. Select a view with the toggles on the left of the toolbar.
- Flame graph: The whole call stack, with the width of each block proportional to the time spent. This is the default view.
- Select a frame to zoom in, and select it again to go back up.
- Use Highlight method… to find a method.
- Use the Display menu to adjust the view.
- Call tree: Each method is nested under its caller so that you can follow the cost from an entry point downward. Columns include Method name, API, Contribution breakdown, and the percentage and time for each row. To expand a row, select +.
- Ranked list: Every method ranked by its own time, regardless of the caller, with a contribution bar and an Overall contribution percentage.
- Hotspot APIs.
Use the following toolbar options to refine the result:
- Frames: Show Application frames (your code) or All frames (including libraries and the runtime).
- Samples: Choose which samples to include. Select (Help) next to Samples for a description of each option.
- States: Choose which thread states count toward the result: Runnable, Lock, Disk I/O, Net I/O, and Wait. By default, all states are included.
- Thread group: Narrow the data to one group of threads.
- Export raw data: Download the data that is currently loaded.
Use these tips to find the methods to optimize first:
- The widest blocks in the Flame graph and the top rows of the Ranked list are the methods that take the most time. They're your first candidates to optimize.
- To focus on code you can change, set Frames to Application.
- To see which entry point leads to a costly method, follow it in the Call tree.
- To see where code waits instead of running, change States, for example, to include only Lock.
Method executions
Method executions lists the traced methods that ran in the process, ranked by cost. It answers a question that a sampled profile can't: how many times a method ran and what one call cost. Knowing this helps you tell the difference between code that's slow per call and code that's called often.
- Rank by: Choose how the table is ranked, for example, Wall clock.
- Show: Choose between all code and your application code.
The table contains the following columns. For the definition of a column, select (Information) next to its name.
- Method.
- Role: For example, Entry point or Outbound call.
- Endpoint served.
- Time: A bar relative to the top method.
- Total time.
- On CPU: The share of elapsed time spent on the CPU.
- Own code: The share of CPU time spent in the method's own code.
- Calls: The estimated number of calls.
- Time per call: The average time per call.
The last row, Everything else, shows the time not attributed to the listed methods.
To investigate a method, open the actions menu of its row and select one of these options:
- View traces: Opens
 Distributed Tracing for that method.
- Show callers: Shows the call chain leading to the method.
Totals add up across all threads and include time spent in called methods, so they can exceed the timeframe.
Use these patterns to decide what to optimize:
- A high Time per call means each call is expensive. Optimize the method itself.
- A high Calls count with a low Time per call indicates the cost is driven by volume. Look at why your code calls the method so often. Show callers shows you where the calls come from.
- A low On CPU share means the method spends most of its time waiting, for example, on an outbound call. View traces shows you the requests involved.
Method executions might be deactivated in the following cases. Select (Information) to see the reason:
- More than one process group is selected. Narrow the selection to one process group.
- No traces for the process were found within the selected timeframe.
Memory
The Memory tab is available for JVM-based processes. It shows memory over time, with the total allocated and survived memory in the chart title, and a legend for Memory Allocated and Survived.
Below the Memory over time chart, you can switch between these views:
- Flame graph: Allocations by call stack, colored by API, for example, Java, Built-In JRE, Built-In Spring, and Built-In Apache.
- Allocation hotspots: A table of methods with allocated and survived memory, allocated and survived object counts, a Retention figure, a Score, and the types that each method allocates. High retention values are highlighted. They point to memory that stays alive and might indicate a memory leak.
- Hotspot APIs: Allocations grouped by API.
- Hotspot types: Allocations grouped by object type.
Use the Frames toolbar option to show All frames or only application frames. On the flame graph, use Show to choose which allocations to display. By default, all allocations are displayed. The flame graph offers Highlight method…, the tables offer Search, and every view offers Export raw data.
Use these tips to find the code behind memory pressure:
- The methods at the top of Allocation hotspots allocate the most memory. Reducing allocations there lowers memory pressure.
- Methods with high Retention keep memory alive. Check them first when you suspect a memory leak.
- Hotspot types shows which object types take up the memory, and Hotspot APIs shows whether your code or a library allocates it.
Threads
The Threads tab is available for JVM-based processes and shows one process at a time. The Thread breakdown chart shows the thread activity over the timeframe, with the number of analyzed stack trace samples in its title.
- Use the View options to switch between Thread states (average number of threads per state, such as Code execution, Locking, Disk I/O, and Network I/O) and CPU time.
- Select Include waiting threads to also count threads in a waiting state.
Below the Thread breakdown chart, a table lists the thread groups with their Overall execution breakdown, Estimated CPU time, and Process count. Use Search to find a thread group.
- To see the individual threads of a thread group, select the group name. To return to the list, select Thread groups at the top of the table.
- To go to the CPU tab scoped to a thread group or thread, select CPU hotspot in the Actions column.
Use these tips to find out why threads are blocked:
- A large share of Locking means threads wait for each other. A large share of Disk I/O or Network I/O means threads wait on storage or remote calls.
- To find out which threads are affected, select the thread group and look at its individual threads.
- To see the code a blocked thread runs, select CPU hotspot for that thread. The CPU tab shows the underlying methods.
Concepts
- Profiling
Sampling the methods that run in a process to show where it spends CPU time, allocates memory, and waits. OneAgent collects the data, so you don't change or instrument your code.
- Process group
A set of processes that run the same workload. The Explorer view lists one row per process group, and you can profile up to 10 process groups together.
- Method hotspot
A method that accounts for a large share of the samples in a profile. In the flame graph, hotspots are the widest blocks. In the ranked list, they're the top rows.
- Flame graph
A visualization of call stacks in which the width of each block is proportional to the time spent in that method and the methods it calls. Use it to see the cost of a whole call path at a glance.
- Call tree
A view that nests each method under its caller, so you can follow the cost from an entry point down to the methods that spend it.
- Sample
A snapshot of the call stack of a running thread. Method hotspots are based on samples, so they show where time is spent, but not how often a method ran.
- Method execution
A traced call of a method. Method executions is based on distributed traces and shows how often a method ran and what each call cost, which helps you distinguish slow code from frequently called code.
- Application frames
Frames that belong to your own code, as opposed to libraries and the runtime. Set Frames to Application to focus on code you can change.
- Thread state
What a thread is doing at the time of a sample: running code (Runnable), or waiting on a lock (Lock), disk (Disk I/O), network (Net I/O), or another thread (Wait). Thread states indicate whether threads are running code or waiting.
- Allocated and survived memory
Allocated memory is all memory that methods request. Survived memory is the part that remains alive after garbage collection. A high share of survived memory (retention) can indicate a memory leak.
Use cases
Use Profiling to find the code behind slow requests, CPU spikes, memory pressure, and blocked threads. The following use cases show what you can do with the app.
- Find your processes with filters: Narrow the Explorer view in Profiling with the context your team already uses.
- See which methods burn CPU: Method hotspots in a flame graph, call tree, or ranked list point you to the exact methods to fix. Switch to Application frames to focus on your own code.
- Tell slow code from busy code: Method executions, based on distributed traces, shows how often each method ran and what each call cost.
- Track down memory pressure: For JVM-based processes, allocation hotspots show which methods allocate the most memory and which memory stays alive, which can be a sign of a leak.
- Find blocked threads: For JVM-based processes, thread analysis shows time spent on locking, disk I/O, and network I/O, and takes you to the CPU hotspots of a thread group in one step.
- Profile several process groups at once: Analyze up to 10 process groups together on one page.
Profiling