Explorer view in Dynatrace apps
- Latest Dynatrace
- Explanation
- 4-min read
- Published May 06, 2026
The Explorer view is a shared interface pattern used across many Dynatrace apps—such as  Clouds,
  Kubernetes,
  Infrastructure & Operations,
  Databases, and
  Services—to monitor and analyze entities of a given technology.
This page explains the concepts that are common to all Explorer views.
Basic layout
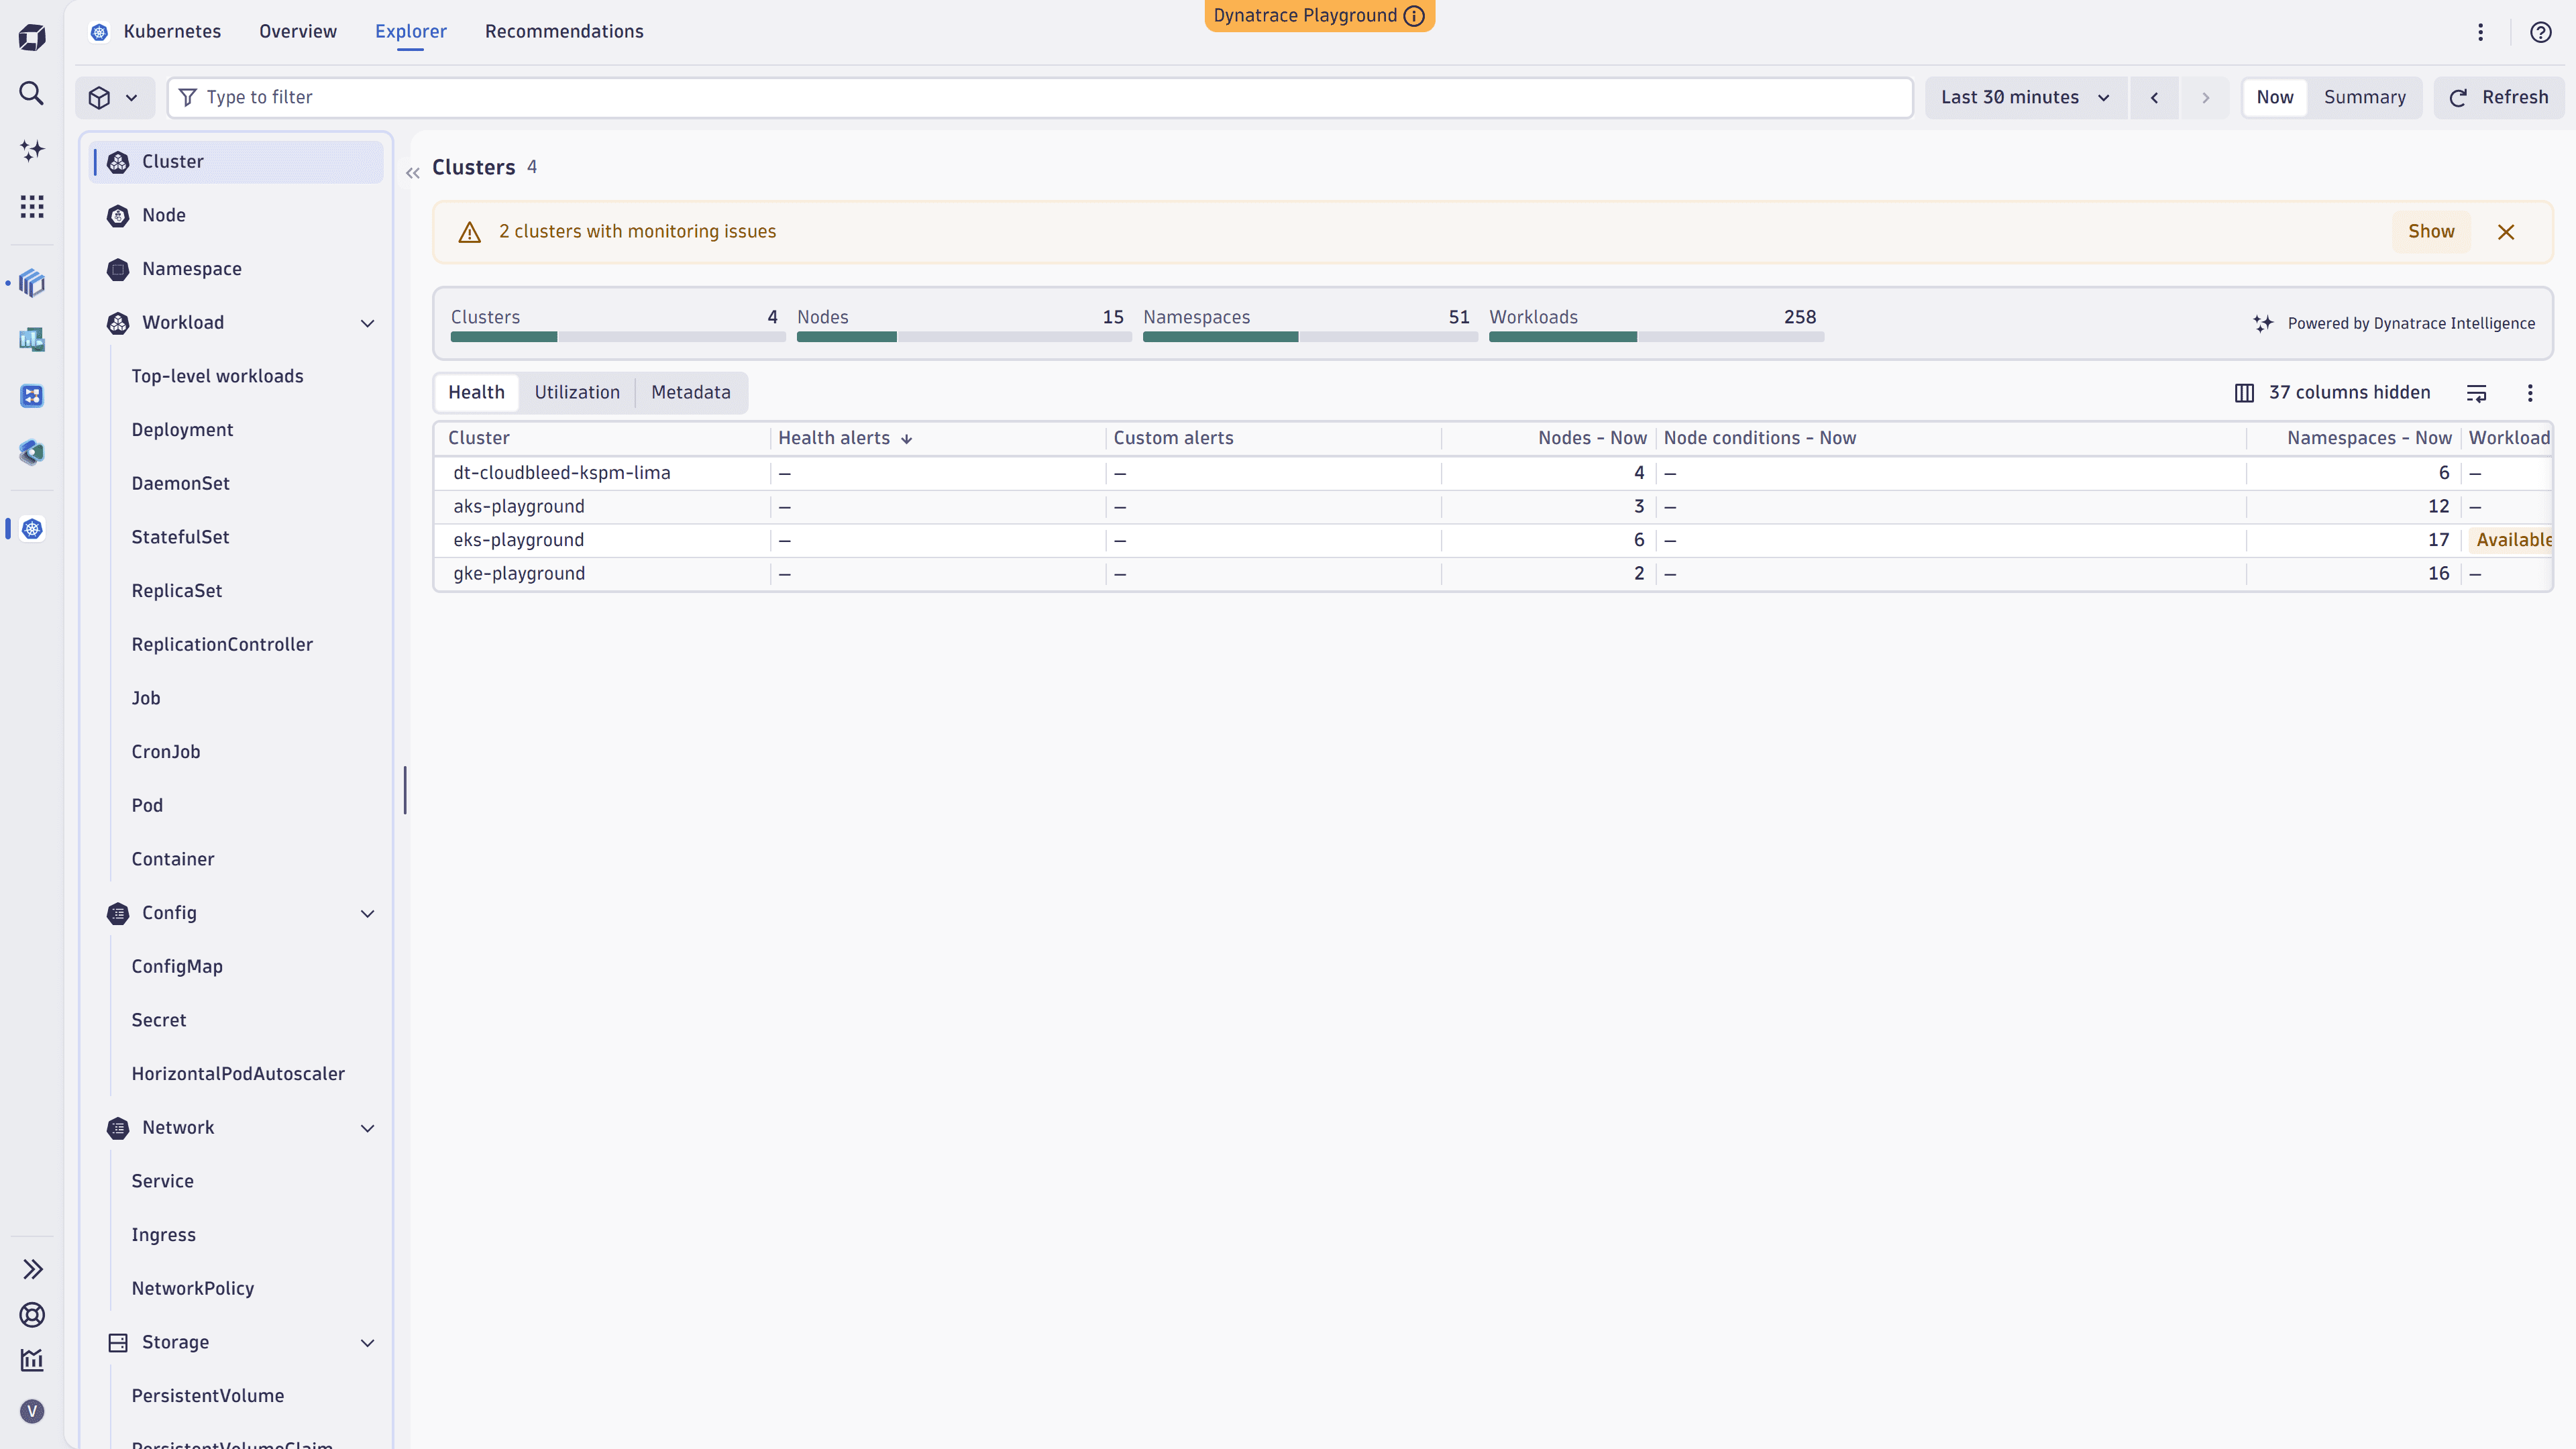
The Explorer view follows the same structure:
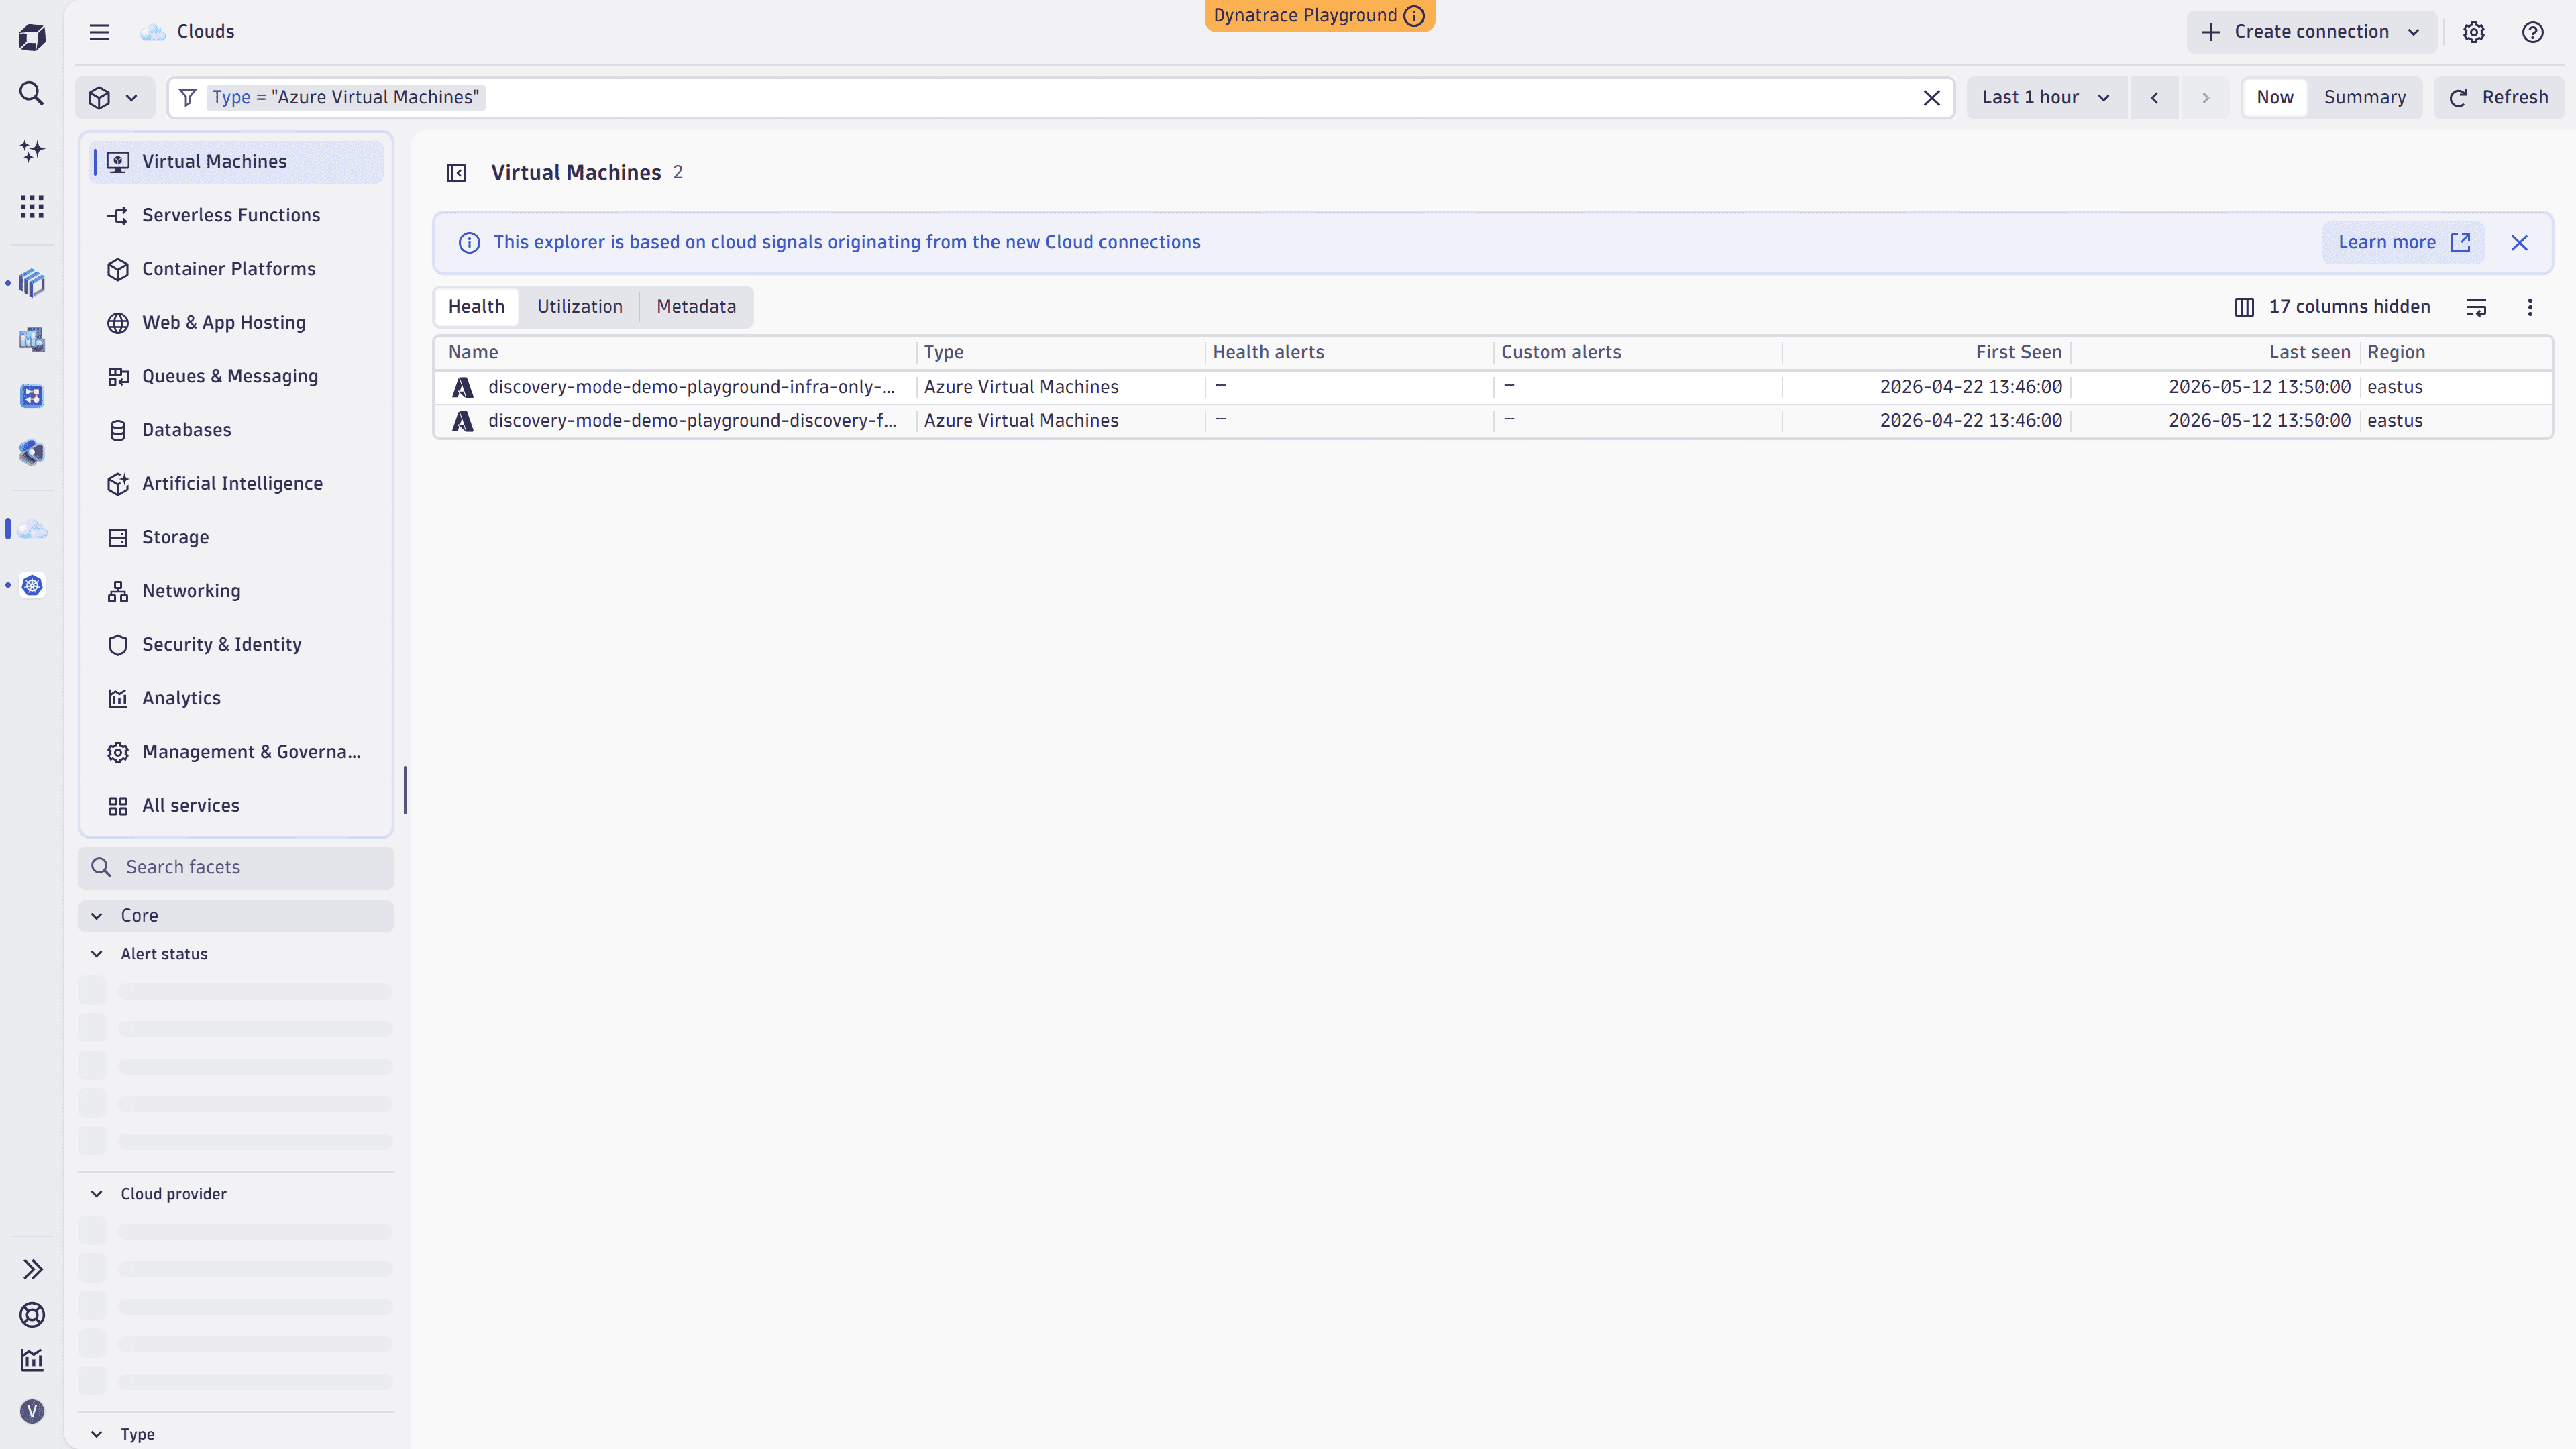
- Sidebar: On the left, groups entities by type or category (for example, Kubernetes objects in Kubernetes, service categories in Clouds, or hosts, containers, processes, and network devices in Infrastructure & Operations). Selecting a category scopes the list and the available filters.
- Filter bar: At the top of the list, lets you narrow down results using attributes, tags, and alert status. For details, see Filter bar.
- Aggregated health bar: Above the list, summarizes the health state of the displayed entities and their child entities.
- Entity list: The main table. Use Column settings to choose which columns to display. Switch perspectives to change the metric set.
- Detail view: Selecting an entity opens a side panel or full page with health, utilization, logs, events, metadata, configuration, and topology. The detail view is consistent regardless of filters applied to the list.
Within this structure, each app can surface its own entities (such as cloud services, Kubernetes objects, hosts, database instances, or services).
Filter bar
The filter bar at the top of the Explorer view lets you narrow the list using suggested attributes, tags, and alert status. Criteria of the same type are combined with OR; criteria of different types are combined with AND.
For details, see Filter field.
Perspectives
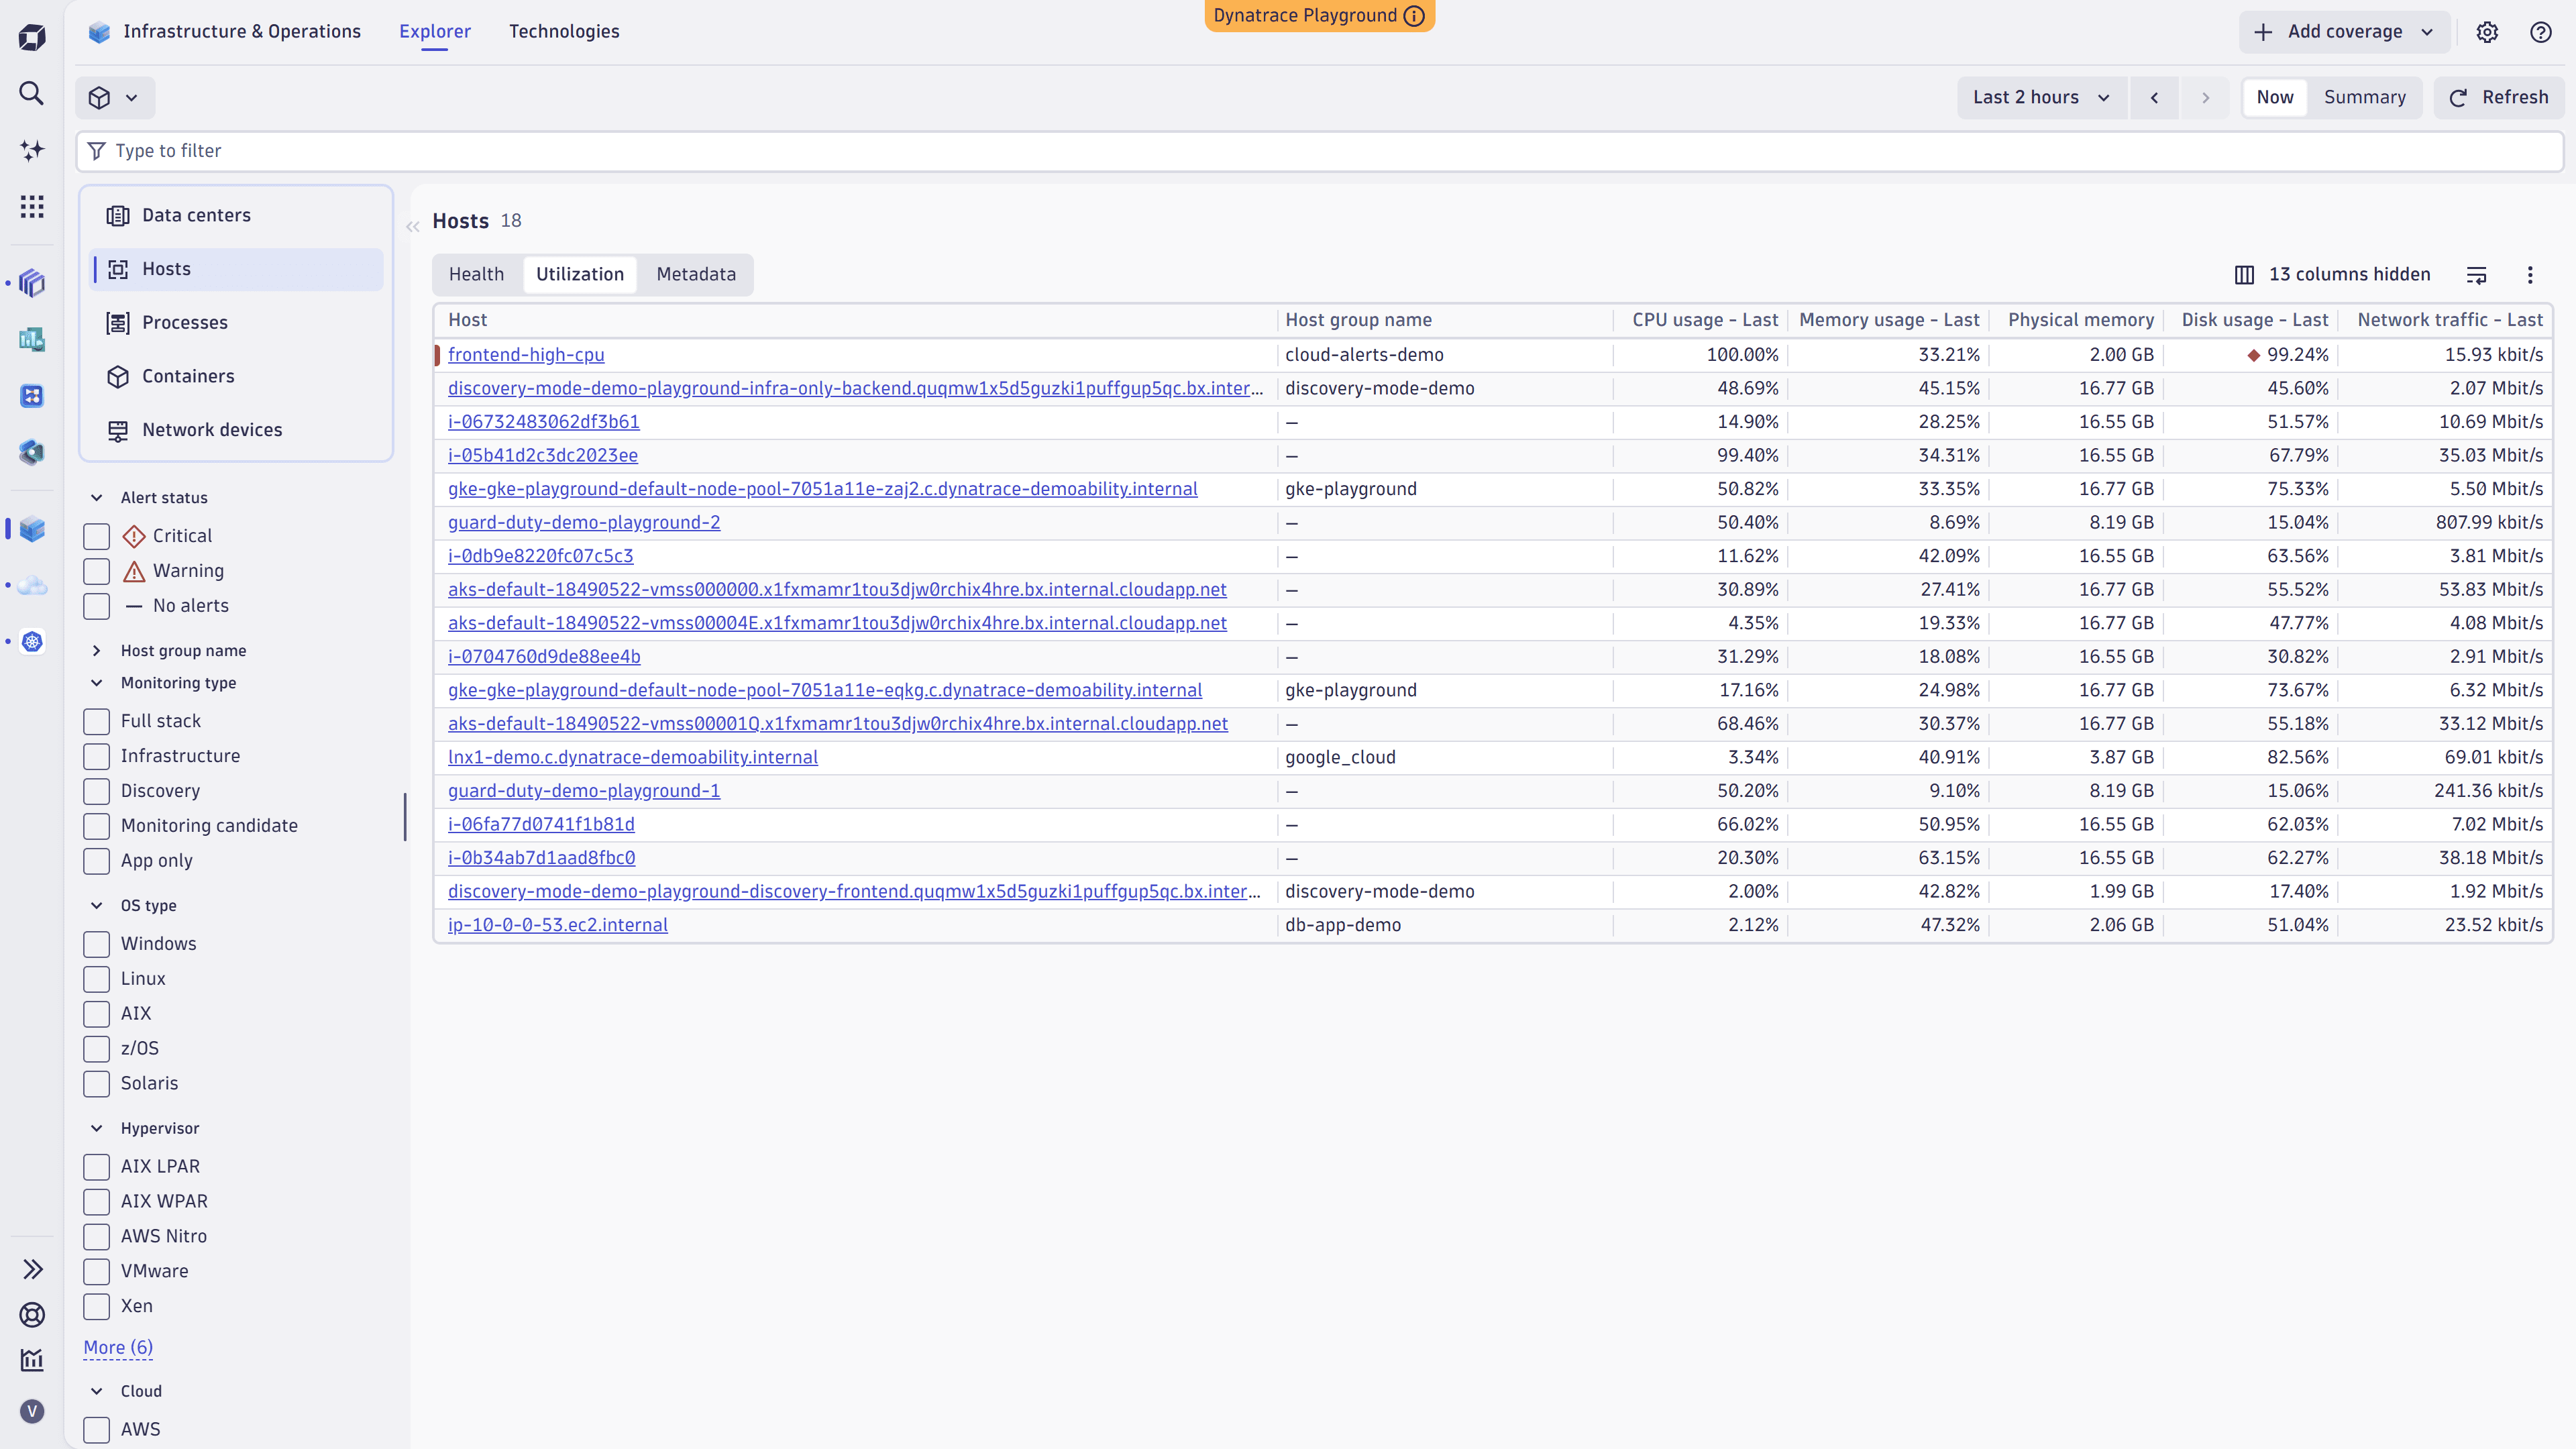
A perspective is a preset column layout that focuses the list on a specific use case. Switching perspectives changes which metrics appear in the table without changing the filters or selection. Common perspectives include:
- Health: Health status, active alerts, and warning signals.
- Utilization: Resource usage such as CPU, memory, disk, or service-specific consumption metrics. Available where it applies (for example, compute services in Clouds or workloads in Kubernetes).
- Metadata: Identifying attributes such as tags, regions, accounts, and other context.
You can customize the columns within a perspective. Your column choices persist in your browser, and you can reset them from the perspectives menu.
Health
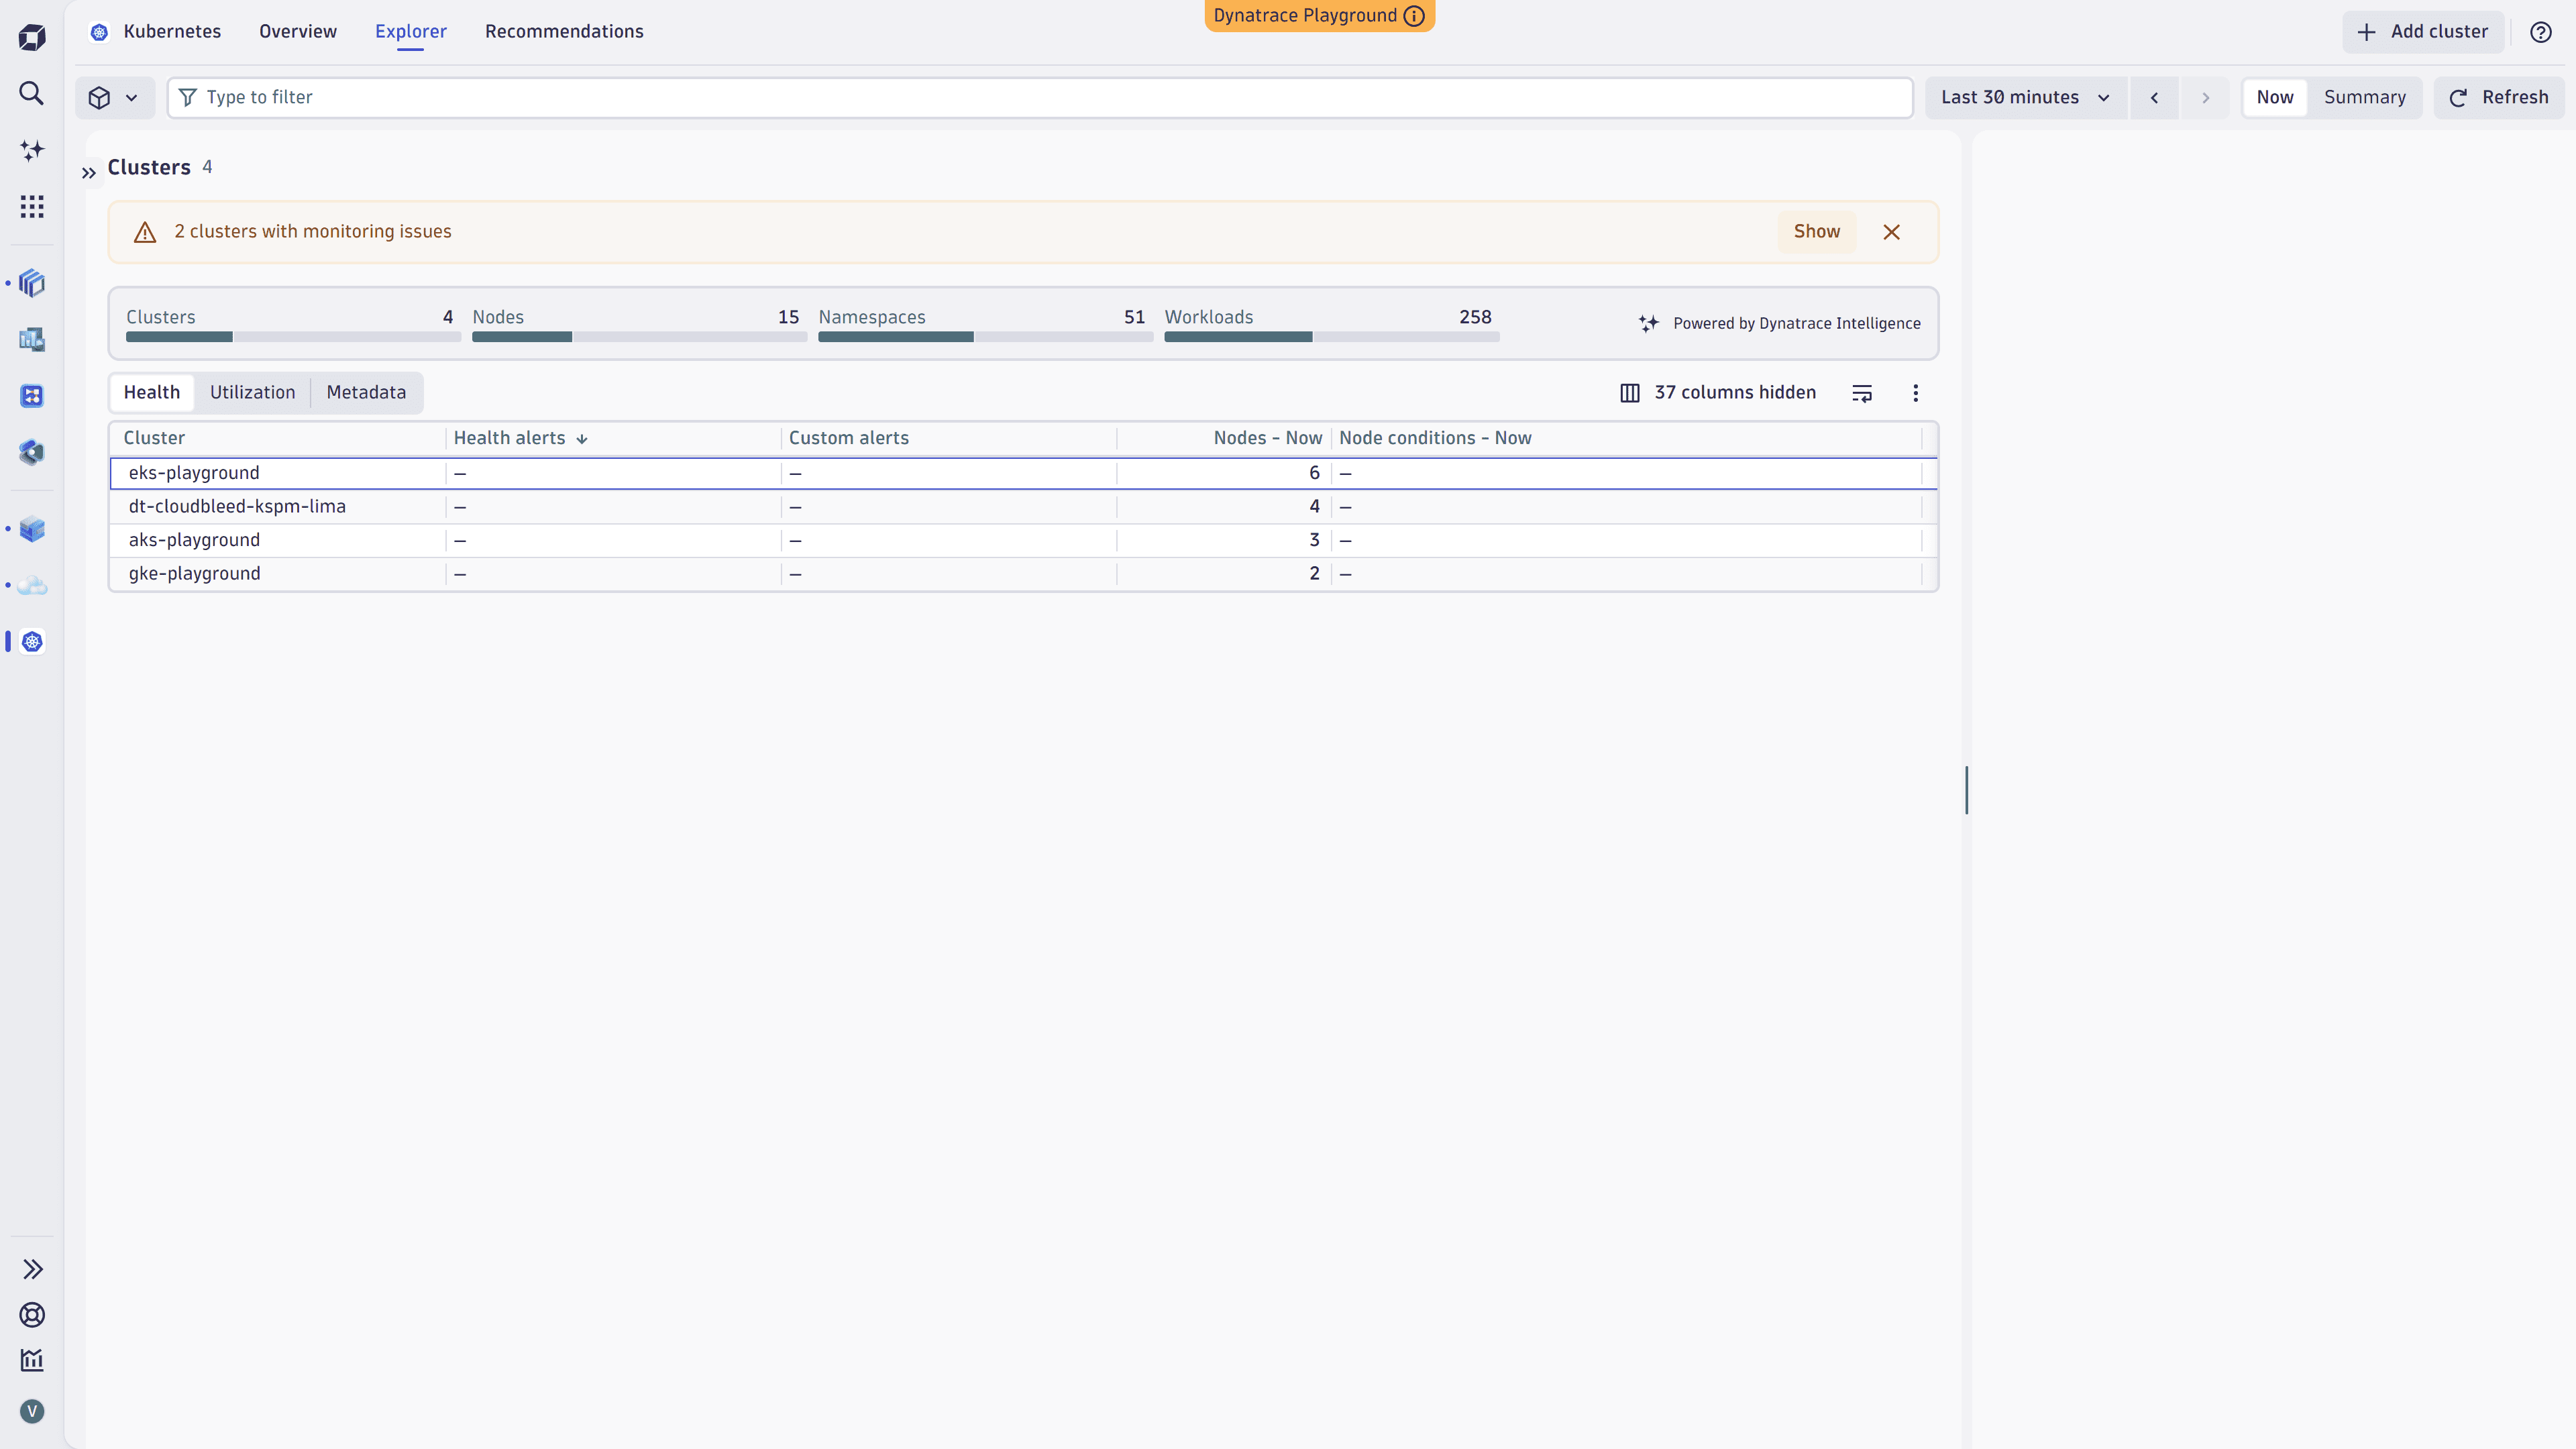
Each Explorer view exposes health signals for the listed entities, with information powered by Dynatrace Intelligence. Health is determined by ready-made and custom health alerts evaluated against your data, and is aggregated up the topology—for example, a cluster is unhealthy if any of its nodes is unhealthy.
Two related signals appear in the list:
- Health alerts: Critical conditions that create a problem in
 Problems and trigger root-cause analysis.
 - Warning signals: Non-critical observations that indicate potential issues but do not raise a problem.
To configure alerts, go to  Settings > Analyze and alert > Alerts, or use
  Anomaly Detection for custom alerts.
For details, see Health alerts and warning signals.
Problem mode and Investigate problem
When an entity has an active health alert, you can enter Problem mode to focus the Explorer view on that specific issue.
To do this, select Investigate problem on the alert badge in the list or detail view.
- The view narrows the timeframe to the start and end of the problem and highlights the metrics most relevant to the alert.
- You can jump to the underlying problem in Problems for full root-cause analysis, or use Dynatrace Intelligence for AI-assisted investigation and remediation suggestions.
Problem mode is also active automatically when you navigate from a specific problem in Problems into one of the apps that supports the Explorer view. The active problem is highlighted next to the filter bar.
Segments
Segments let you logically structure and filter observability data using saved, shareable definitions that work across any app that supports them—including the Explorer view. Use segments to:
- Define filters once and reuse them across apps.
- Combine multiple criteria into a single named filter.
- Share consistent views across teams.
Segments can be defined on primary Grail fields (for example, aws.account.id, k8s.cluster.name) and on Smartscape topology nodes.
For details, see Segments and Filter Smartscape nodes with segments.
Drill down and navigate to other apps
The Explorer view is an entry point to deeper analysis in other Dynatrace apps. Selected timeframe, filters, and segments are carried over wherever applicable. Common navigation paths include:
-
Entity details: Select an entity in the list to open its detail view, with tabs for health, utilization, logs, events, metadata, configuration, and topology.
-
Ready-made dashboards: Select
 Go to dashboard to open a curated dashboard for the selected entity in Dashboards.
 -
Notebooks: From a chart or graph, select > Open in Notebooks to continue analysis in
 Notebooks.
 -
Problems: From a health alert, jump to the related problem in
Problems. -
Cross-app navigation: Move between related entities, for example:
- From a database instance in Databases to its host in Infrastructure & Operations.
- From a Kubernetes workload to the services running on it in Services.
- From a cloud service in Clouds to the underlying compute resources.
- From a database instance in