Drill down to frontend context from Distributed Tracing app
- Latest Dynatrace
- How-to guide
- 4-min read
- Published Aug 04, 2026
Dynatrace SaaS version 1.344+
When a backend trace originates from a real user interaction in a browser or mobile app,  Distributed Tracing surfaces the linked frontend context and lets you navigate directly to the user session, specific JavaScript error, or page-level performance view. Drill-down options are available in the single trace perspective header in Distributed Tracing.
Use these drill-down options to identify whether an issue originated on the frontend or backend and get the full context of the affected user session—including what happened before and after the request was triggered.
For technical details, see Frontend linking.
Prerequisites
- Frontend: RUM JavaScript or Dynatrace Mobile SDK.
- Backend: Instrumented with OneAgent or OpenTelemetry.
- Permissions: In addition to the standard permissions, the following permissions are required.
storage:user.events:readto load frontend event details and navigate to frontend events.storage:user.sessions:readto navigate to user sessions.
For additional details, see Frontend and backend compatibility.
Navigate from a trace to the frontend context
From the single trace perspective in Distributed Tracing, you can navigate to the frontend context: the specific frontend event within the user session, a JavaScript error, or the page-level performance view.
To navigate to the frontend context
-
In
Distributed Tracing, find the table row of the trace you're interested in and select the trace start time. The single trace perspective opens in the bottom half of the page. -
From the single trace perspective, choose the required frontend context to open the associated Dynatrace app with the linked session, error, or page instance pre-selected and filtered to the trace time window.
- User session: Select View user session to open
 Users & Sessions.
 - User error: Select (Actions menu) > View user error to open
 Error Inspector.
 - Frontend page event: Select (Actions menu) > View frontend event to open
 Experience Vitals.
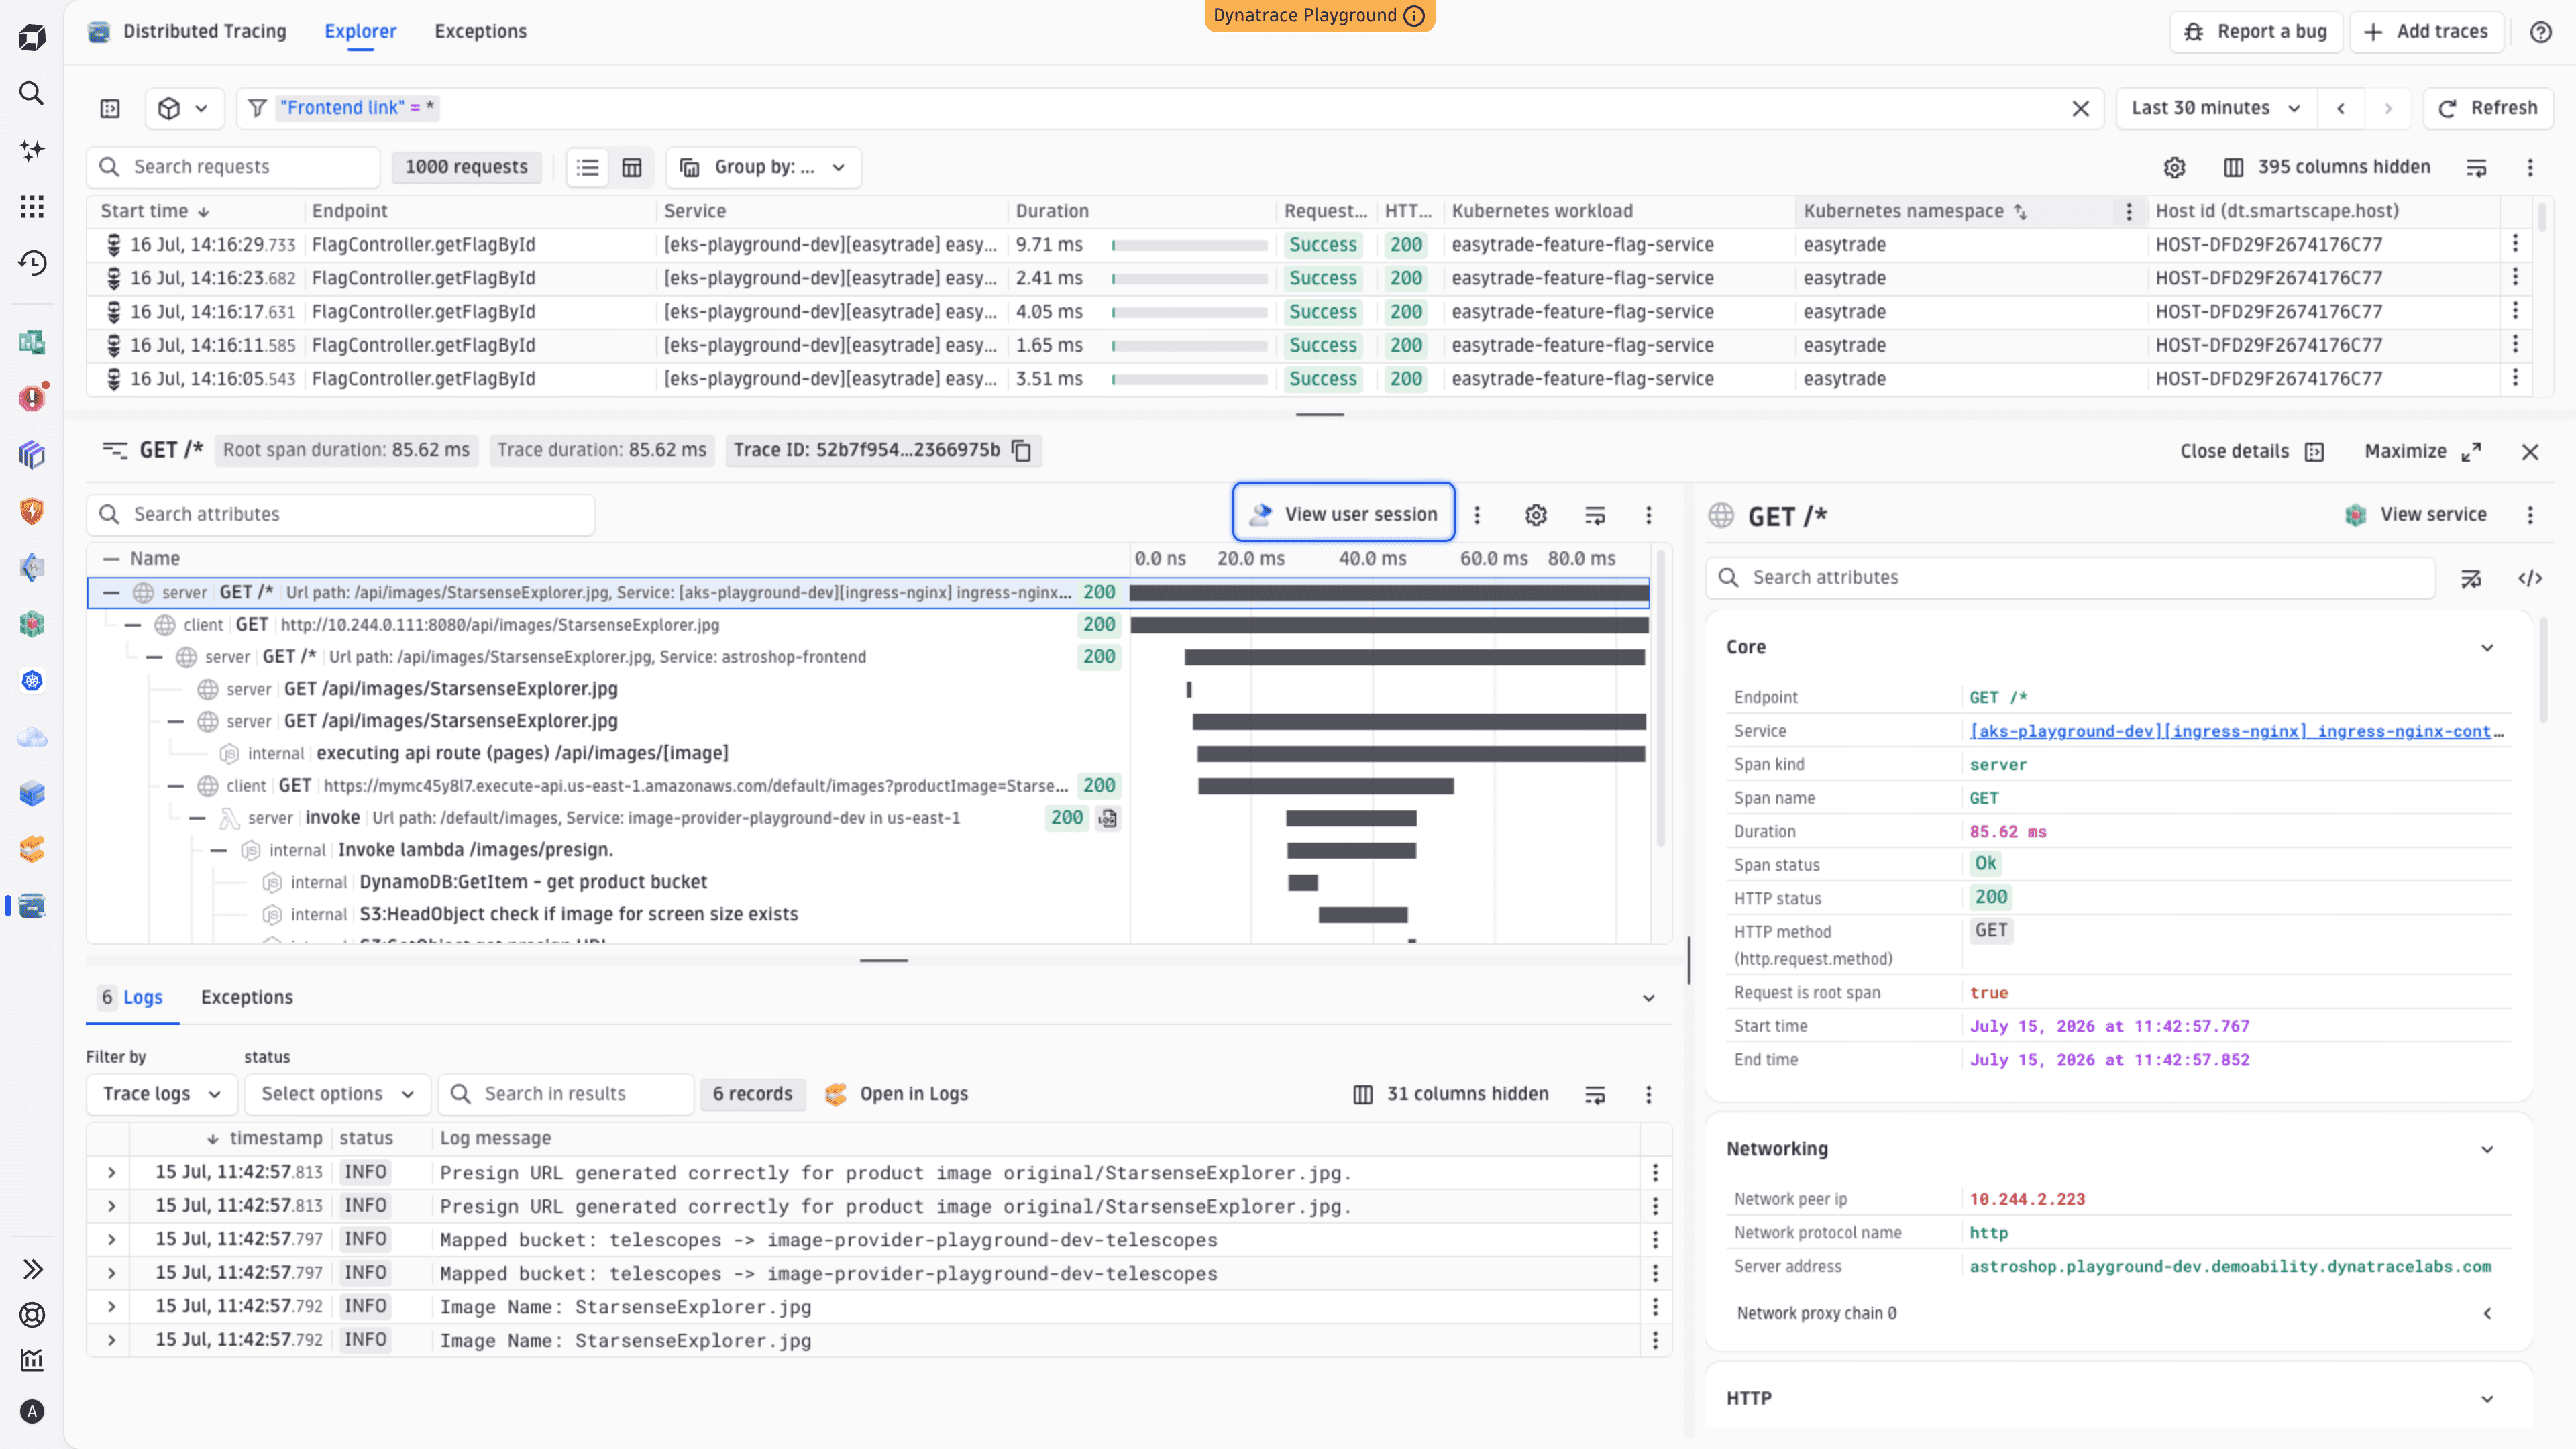
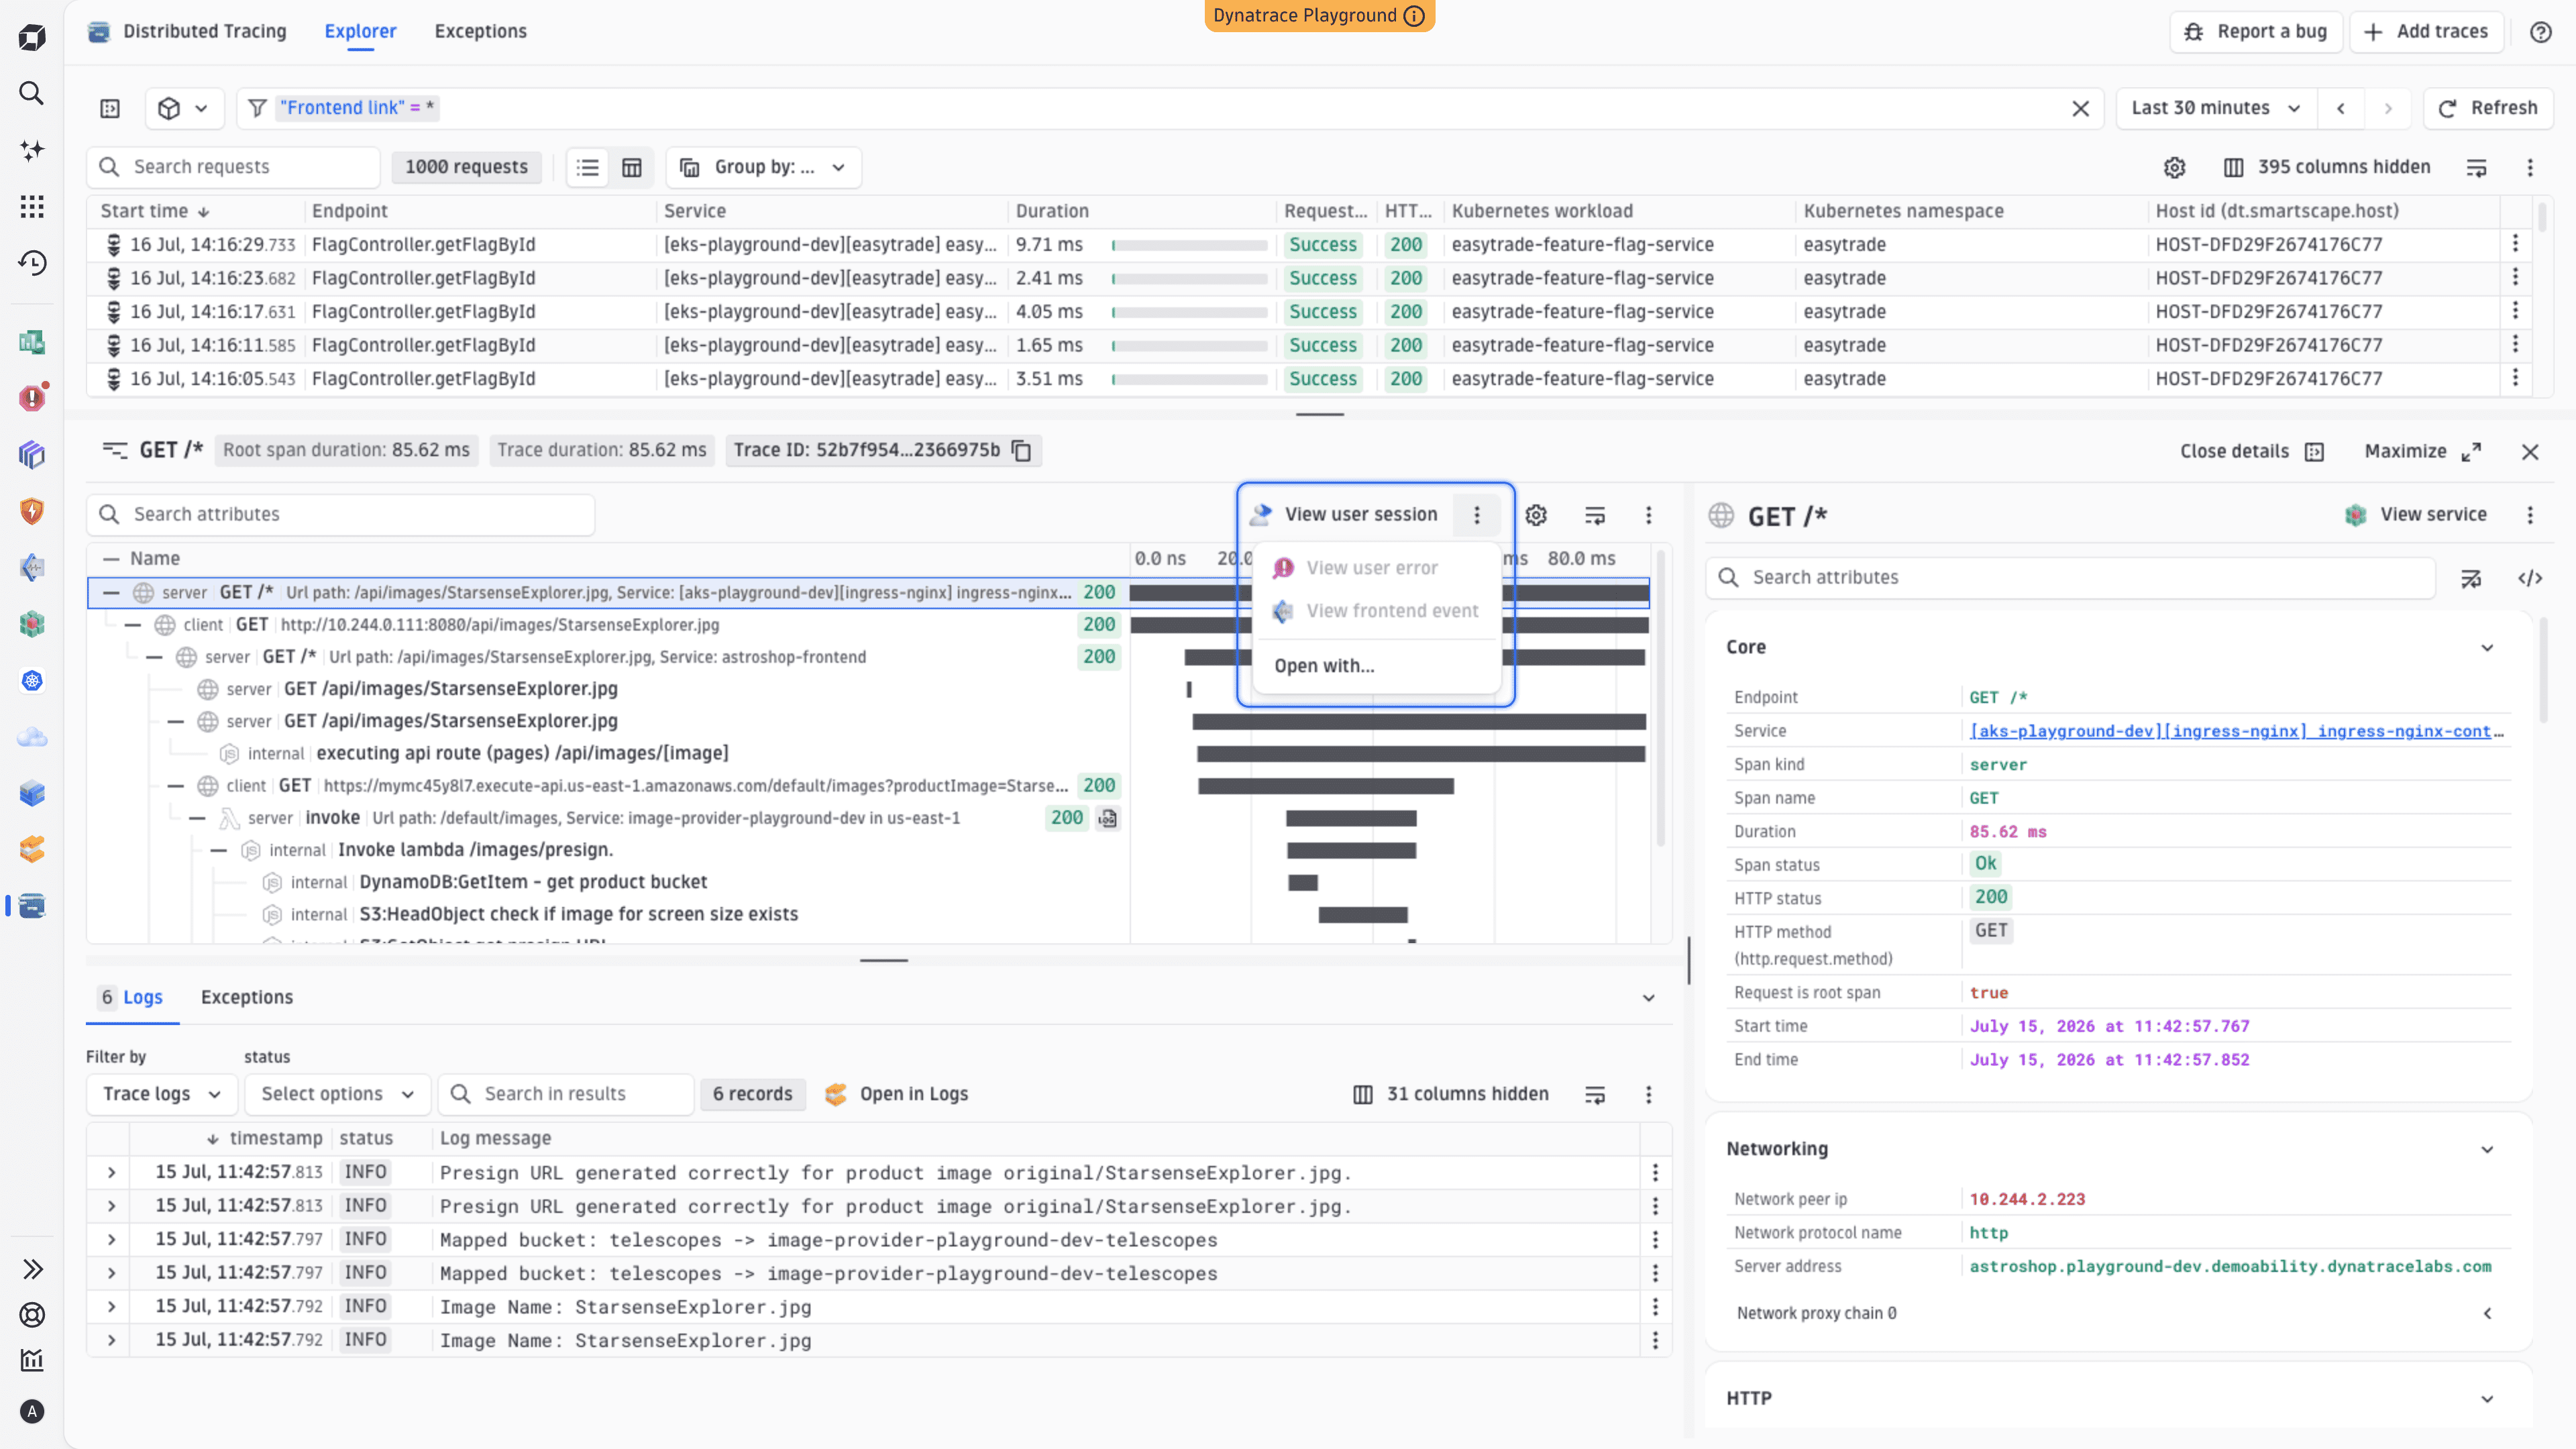 1 of 2"View user session" option for navigating from the single trace perspective in Distributed Tracing to the session details
 - User session: Select View user session to open
If View user session is deactivated, a tooltip explains why: no frontend link is found, a required permission is absent, or the session belongs to a synthetic monitor.
Tooltip messages, reasons, and solutions
-
No user session data available
Explanation: The trace has no
frontend.linkattribute. No user session data is available for this trace. -
Synthetic user sessions are not yet supported by the User Sessions app.
Explanation: The session belongs to a synthetic monitor. Navigation to
Users & Sessions isn't yet supported for synthetic monitor sessions. -
Missing permissions to read user sessions
Explanation: You don't have the
storage:user.sessions:readpermission.
Solution: Contact your administrator to grant this permission. -
You are missing the
user.events:readpermissionExplanation: You don't have the
storage:user.events:readpermission. Frontend event details can't be loaded.
Solution: Contact your administrator to grant this permission.
Find traces with a frontend link
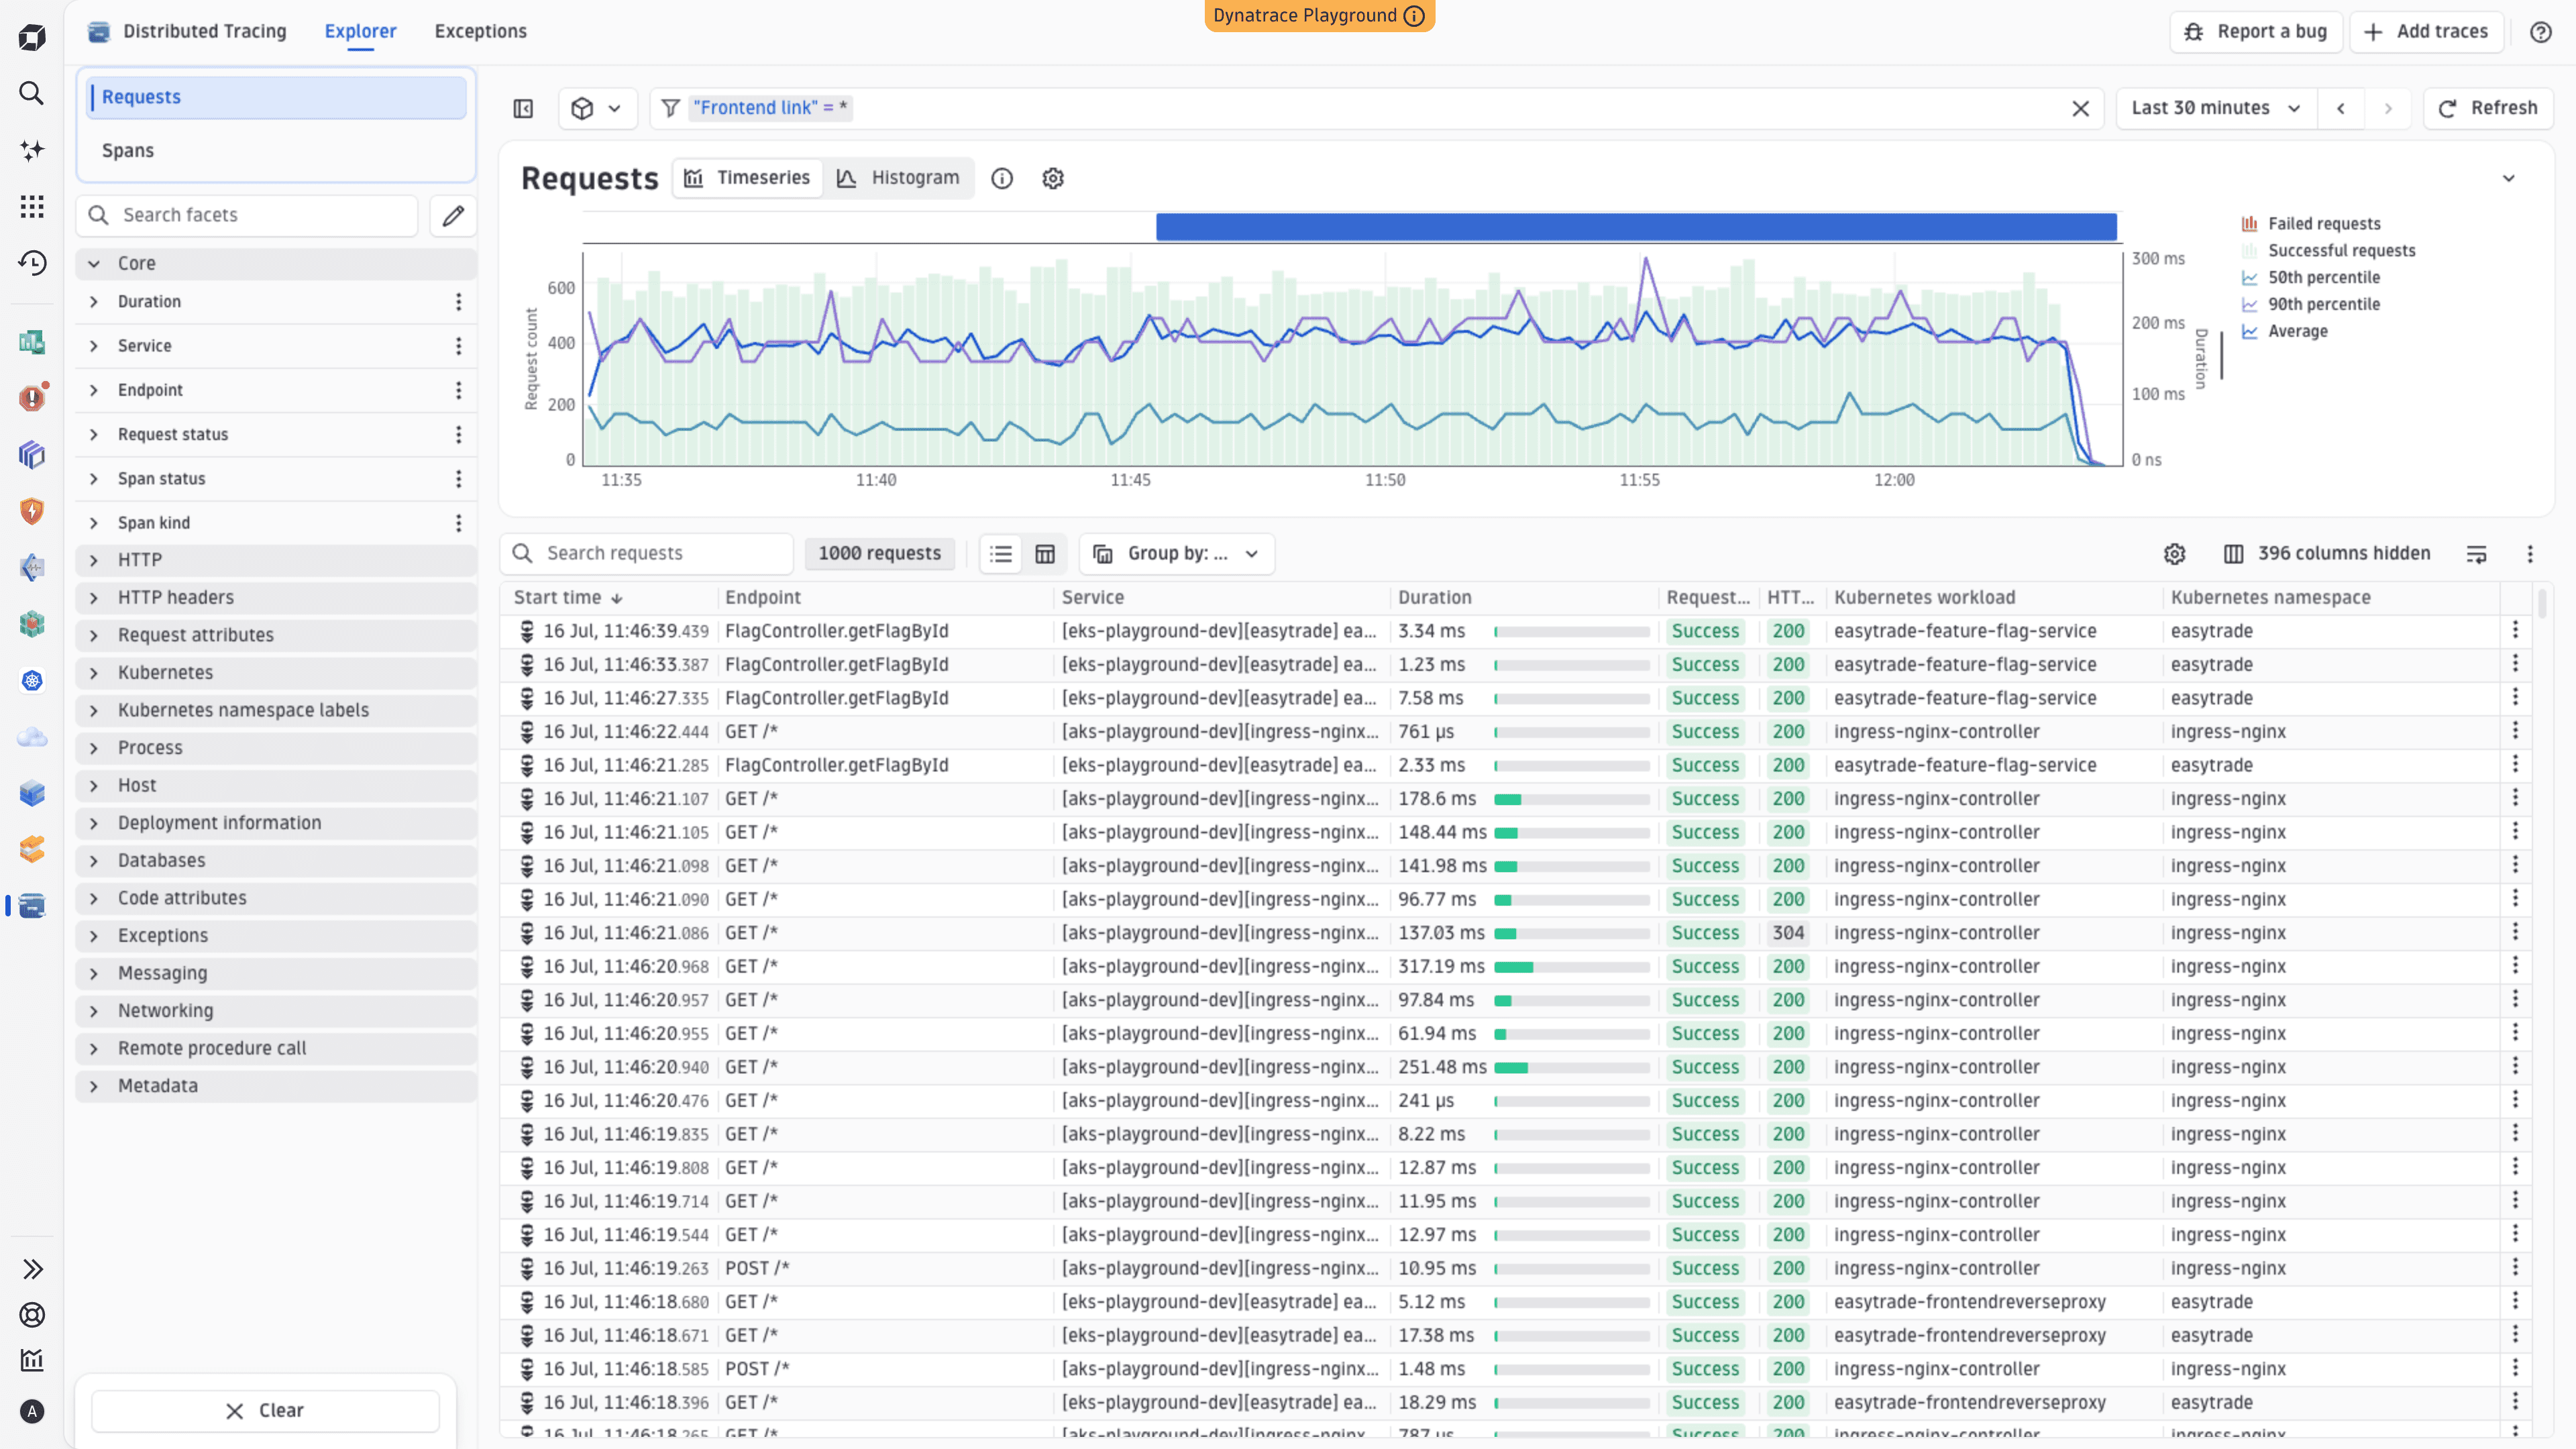
In Distributed Tracing, use the filter field and frontend.link span attribute to show only traces that originated from an end-user interaction.
To show only traces with a frontend link
- In Distributed Tracing, enter
"Frontend link" = *in the Type to filter field. - Select Update.
The trace list shows only traces where a frontend user event or user session was linked to the backend trace.
Frontend linking
Traces that originate from an end-user interaction carry a frontend link on the entry span. This frontend.link span attribute serves as a frontend-backend tracing link that connects a span to frontend user events (page/navigation events and errors) and user sessions. Unlike span links, which reference other spans, this attribute links tracing data to frontend monitoring, such as Real User Monitoring (RUM) and Synthetic Monitoring.
For additional details, see Frontend-backend linking.
Frontend and backend compatibility
Frontend-backend linking works with both OneAgent and OpenTelemetry backends for XHR/Fetch and mobile requests. The table shows which combinations of frontend instrumentation and backend support navigation to the frontend context.
| Frontend | Backend | Supported |
|---|---|---|
RUM JavaScript—XHR/Fetch requests | OneAgent | Yes |
RUM JavaScript—XHR/Fetch requests | OpenTelemetry | Yes |
RUM JavaScript—page loads | OneAgent 1 | Yes |
RUM JavaScript—page loads | OpenTelemetry | No 2 |
Dynatrace Mobile SDK | OneAgent | Yes |
Dynatrace Mobile SDK | OpenTelemetry | Yes |
OneAgent or OpenTelemetry | Yes 3 | |
OneAgent or OpenTelemetry |
OneAgent version 1.331+ is required for page-load linking.
Page-load linking uses the Server-Timing response header, which is added by OneAgent and isn't part of the OpenTelemetry specification.
For traces originating from synthetic monitors, the frontend.link attribute is present, but navigation to Users & Sessions isn't yet supported.
Synthetic test/step context only.
Next steps
Once in the frontend context, you can explore the full user journey in Users & Sessions, investigate JavaScript errors in Error Inspector, or analyze page-level performance in Experience Vitals.
Related topics
Distributed Tracing