Observe cloud network traffic with logs
- Latest Dynatrace
- Tutorial
- 6-min read
- Published Apr 24, 2023
In today's complex digital landscape, maintaining visibility and understanding system behavior is important for effective operations. Logs offer a detailed insight of system events and errors. However, extracting actionable insights from vast log data can be challenging without the right tools and methodologies in place.
Dashboards can be created using DQL queries, that can handle any data type stored within Grail.
Introduction
This guide describes approach for using Dynatrace to observe your cloud network in AWS to identify incoming HTTP(S) traffic to your VPC. Logs contain important information for observability. They capture various events, actions, and errors that occur during the operation of the system.
You can either use DQL log queries or metrics to build dashboards that provide valuable insight about any occurring errors, their frequency, duration, and impact.
Target audience
This article is intended for site reliability engineers (SRE) who are responsible for monitoring of the network activity to detect incoming HTTP(S) traffic directed towards the Virtual Private Cloud (VPC).
Scenario
You want to monitor and analyze incoming HTTP(S) traffic to your Virtual Private Cloud (VPC) in Amazon Web Services (AWS). To achieve this, you need to utilize VPC Flow Logs, a feature that captures information about the IP traffic going to and from network interfaces in your VPC.
Prerequisites
Make sure all of these are true before you start:
- Configure logging IP traffic using VPC Flow Logs.
- Send logs to Dynatrace. You can choose from the following integration options to stream logs:
- Recommended Amazon Data Firehose;
- Amazon S3.
- Knowledge of:
- Make sure the following permissions are enabled:
- Grail:
storage:logs:read. For instructions, see Assign permissions in Grail.
To access permissions, go to the Settings menu in the upper-right corner of the Workflows app and select Authorization settings.
- You should have the necessary permissions to configure and access monitoring tools within Dynatrace.
- You should have permissions to ingest log data into Dynatrace.
- Grail:
Steps
When your logs are already in Dynatrace, follow the steps below:
- Open the Dashboards application.
- Select the + button, and create a new Query Grail section.
- Input the DQL query provided below in the Query section, and select Run to display the results.
fetch logs| filter matchesValue(aws.log_group, "*vpc*") and matchesValue(aws.log_group, "*flow-logs*")| filterOut matchesValue(content, "*SKIPDATA*")| filterOut matchesValue(content, "*NODATA*")| parse content, "STRING:account_id SPACE STRING:action SPACE STRING:az_id SPACE INT:bytes SPACE IPV4:dstaddr SPACE INT:dstport SPACE STRING:end SPACE STRING:flow_direction SPACE STRING:instance_id SPACE STRING:interface_id SPACE STRING:log_status SPACE INT:packets SPACE STRING:pkt_dst_aws_service SPACE IPADDR:pkt_dstaddr SPACE STRING:pkt_src_aws_service SPACE IPV4:pkt_srcaddr SPACE INT:protocol SPACE STRING:region SPACE IPV4:srcaddr SPACE INT:srcport SPACE STRING:start SPACE STRING:sublocation_id SPACE STRING:sublocation_type SPACE STRING:subnet_id SPACE INT:tcp_flags SPACE STRING:traffic_path SPACE STRING:type SPACE STRING:version SPACE STRING:vpc_id"| filter isNotNull(vpc_id)| filter flow_direction=="egress"| filter srcport == 80 or srcport == 443| summarize bytes_sum=sum(bytes), by: vpc_id
Query result
| vpc_id | bytes_sum |
|---|---|
vpc-03d503e892fa5ca6c | 175.45 |
vpc-03e6789b7b1ca80e7 | 55.10 |
vpc-04a3112f5612b0e8f | 108.34 |
vpc-95a855f0 | 313.22 |
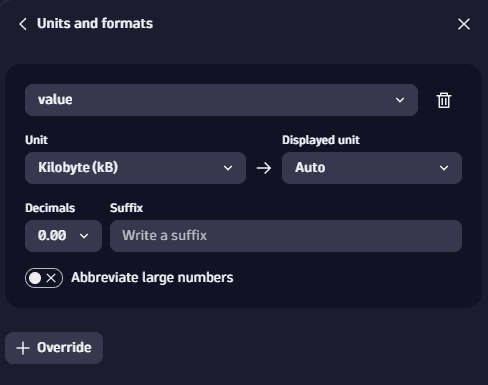
- Configure the units in which you want the results to be displayed. Go to Visualize > Units and formats. Select Override and set the Unit, for example, as Kilobyte (kB).
To achieve the same results, you can create a log metric based on the query.
 Create a processing rule to extract the necessary attributes:
- Go to Settings > Log Monitoring > Processing and for the metric Settings > Log monitoring > Metrics extraction.
- Create a log processing matcher. Define the Label, Name and ID fields. The matcher in this example is
matchesValue(aws.log_group, "*flow-logs*") AND matchesValue(aws.log_group, "*vpc*"). - Create a processor definition. If the incoming log line is the same as the matcher, then the transformation defined in the processor will take place. In the Processor definition field, input the following example rule:
PARSE(content, "STRING:account_id SPACESTRING:action SPACESTRING:az_id SPACEINT:bytes SPACEIPV4:dstaddr SPACEINT:dstport SPACESTRING:end SPACESTRING:flow_direction SPACESTRING:instance_id SPACESTRING:interface_id SPACESTRING:log_status SPACEINT:packets SPACESTRING:pkt_dst_aws_service SPACEIPADDR:pkt_dstaddr SPACESTRING:pkt_src_aws_service SPACEIPV4:pkt_srcaddr SPACEINT:protocol SPACESTRING:region SPACEIPV4:srcaddr SPACEINT:srcport SPACESTRING:start SPACESTRING:sublocation_id SPACESTRING:sublocation_type SPACESTRING:subnet_id SPACEINT:tcp_flags SPACESTRING:traffic_path SPACESTRING:type SPACESTRING:version SPACESTRING:vpc_id")| FIELDS_ADD(log.type:("aws.vpc"),srcaddr_orig:srcaddr,dstaddr_orig:dstaddr)| FIELDS_ADD (dstaddr : IF(flow_direction=="egress" AND pkt_dst_aws_service=="-" AND NOT (IP_TRUNC(dstaddr,8)==IPADDR("10.0.0.0") OR IP_TRUNC(dstaddr,12)==IPADDR("172.16.0.0") OR IP_TRUNC(dstaddr,16)==IPADDR("192.168.0.0")),IPADDR("0.0.0.0") ,dstaddr),srcaddr : IF(flow_direction=="ingress" AND pkt_src_aws_service=="-" AND NOT (IP_TRUNC(srcaddr,8)==IPADDR("10.0.0.0") OR IP_TRUNC(srcaddr,12)==IPADDR("172.16.0.0") OR IP_TRUNC(srcaddr,16)==IPADDR("192.168.0.0")),IPADDR("0.0.0.0"),srcaddr))
- Test the rule. In the Rule testing section, input the log sample, as per the example below.
{"event.type": "LOG","content":"469103632743 REJECT use1-az2 44 10.128.28.180 27779 1689064141 ingress i-04bb973d2eed6b020 eni-0de8f47fff9b3a6e4 OK 1 - 10.128.28.180 - 35.203.210.29 6 us-east-1 35.203.210.29 50134 1689064083 - - subnet-0f2348e654d860382 2 - IPv4 5 vpc-03d503e892fa5ca6c" ,"status": "INFO","timestamp": "1669634833000","aws.account.id": "908047316593","aws.log_group": "vpc-flow-logs","aws.log_stream": "eni-0e05139020bdc4ebd-all","aws.region": "us-east-1","cloud.account.id": "908047316593","cloud.provider": "aws","cloud.region": "us-east-1","loglevel": "INFO","cloud.log_forwarder": "908047316593:us-east-1:siwek-tgw-flow-logs-lambda"}
- Select Test the rule, and view the result.
{"srcaddr": "0.0.0.0","dstport": "27779","vpc_id": "vpc-03d503e892fa5ca6c","pkt_srcaddr": "35.203.210.29","dstaddr": "10.128.28.180","type": "IPv4","pkt_dst_aws_service": "-","content": "469103632743 REJECT use1-az2 44 10.128.28.180 27779 1689064141 ingress i-04bb973d2eed6b020 eni-0de8f47fff9b3a6e4 OK 1 - 10.128.28.180 - 35.203.210.29 6 us-east-1 35.203.210.29 50134 1689064083 - - subnet-0f2348e654d860382 2 - IPv4 5 vpc-03d503e892fa5ca6c","packets": "1","protocol": "6","cloud.log_forwarder": "908047316593:us-east-1:siwek-tgw-flow-logs-lambda","traffic_path": "-","tcp_flags": "2","sublocation_id": "-","pkt_src_aws_service": "-","dstaddr_orig": "10.128.28.180","action": "REJECT","end": "1689064141","aws.log_group": "vpc-flow-logs","sublocation_type": "-","timestamp": "2022-11-28T11:27:13.000000000Z","pkt_dstaddr": "10.128.28.180","cloud.region": "us-east-1","start": "1689064083","version": "5","az_id": "use1-az2","log.type": "aws.vpc","aws.log_stream": "eni-0e05139020bdc4ebd-all","cloud.provider": "aws","instance_id": "i-04bb973d2eed6b020","account_id": "469103632743","log_status": "OK","interface_id": "eni-0de8f47fff9b3a6e4","aws.region": "us-east-1","flow_direction": "ingress","cloud.account.id": "908047316593","bytes": "44","loglevel": "INFO","event.type": "LOG","aws.account.id": "908047316593","subnet_id": "subnet-0f2348e654d860382","srcport": "50134","region": "us-east-1","srcaddr_orig": "35.203.210.29","status": "INFO"}
 Configure the metric:
- Go to Settings > Log Monitoring > Metrics extraction.
- Enter a Metric key, the Matcher, and set the Metric measurement as Attribute value, and the Attribute as bytes.
- Set the Dimension as vpc_id.
To see the results, explore the metrics in the Query Grail dashboard. Filter by the Metric key, set Aggregation as sum, By vpc_id and Convert to value as sum.
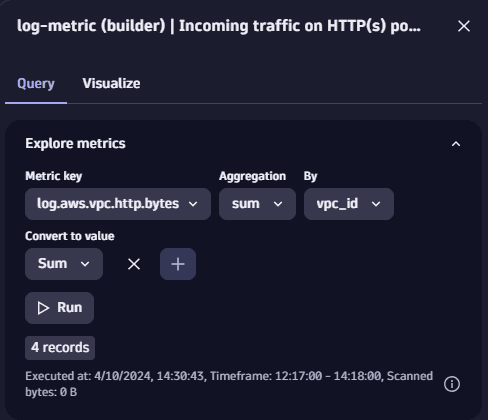
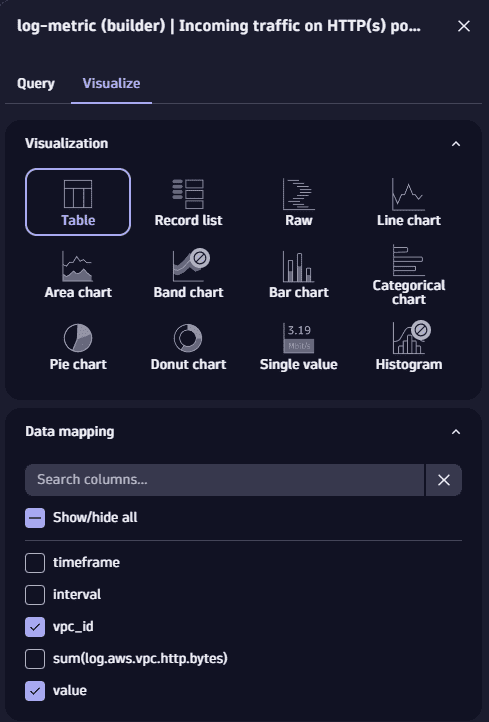
Select Run, and choose how you want to display the results in the Visualize tab. You can also view the results from a specific time frame.
Read about the differences between different dashboarding strategies by accessing the Optimize performance and costs of dashboards running log queries page. Read more about excluding the logs but keeping the log metric in the Bucket assignment page.
Conclusion
Pinning log queries to dashboards offers significant benefits and can perfectly align with your specific use cases, particularly when you're concerned about a list of individual records. Instead of rerunning the same query repeatedly, you can capture its results and display them in your dashboard for easy reference and monitoring.
In situations when you rely on aggregates (using the Summarize or the makeTimeseries command in your DQL query) you should consider using log metrics to optimize your dashboards in terms of performance.
Further reading
- Log dashboard strategies
- Log processing if you must extract additional attributes from logs.
- Replace the PARSE command in your query with the log processing rule.
- Using log metrics for alerting.