Data Observability
- Latest Dynatrace
- Explanation
- 7-min read
Dynatrace is well-positioned to take advantage of the exponential rise in data generation. The rise, however, when paired with the multiple possibilities of data ingestion into Grail, brings new challenges in data management. One of those is the need to ensure the availability, reliability, and quality of data—a concept known as Data Observability.
Data Observability, borrowing ideas from Software Observability, pertains to the ability to understand the full data lifecycle in an organization. It involves monitoring and managing the internal state of data systems from ingestion to storage and usage. It is about gaining insight into the data pipeline, understanding how data evolves, and identifying any issues that could compromise its integrity or reliability.
Dynatrace functionality addresses many issues you can experience around the health, quality, freshness, and general usefulness of externally sourced data in Grail, enabling you to make better-informed decisions and optimize your efforts in digitalization and data-driven operations.
Five pillars of data observability
Having been a frontrunner in handling large amounts of data for nearly two decades, Dynatrace defines the following five pillars of Data Observability.
Freshness
Freshness refers to the timeliness of the data. In an ideal data ecosystem, all data is as current as possible. Observing the freshness of data helps to ensure that decisions are based on the most recent and relevant information.
Example
A flight status system stopped sending data into Dynatrace two hours ago. During this time, the downstream dashboards and systems automations were showing wrong charts and reports due to missing data. Once the flight status system was up and running again, it sent the outdated data from 2 hours ago, which wrongly triggered remediation workflows because these were based on outdated information.
Distribution
Distribution is the statistical spread or range of the data. Data distribution is essential in identifying patterns, outliers, or anomalies. Deviation from the expected distribution can signal an issue in data collection or processing.
Example
A hardware fault caused a single temperature sample from an IoT water buoy to register several orders of magnitude higher than the average, causing a massive jump in the reported average water temperature, negatively influencing dependent systems and automations that rely on them.
Volume
Volume is the quantity of data generated or processed during a certain time period. Unexpected increases or drops in the data volume are usually good indicators of undetected issues. The volume aspect often overlaps with data freshness. At times, it's challenging to determine whether the expected but missing data will arrive later or if it's permanently lost.
Schema
Schema is the structure or format of the data, including the data types and relationships between different entities. Observing the schema can help identify and flag unexpected changes, like the addition of new fields or the removal of existing ones.
Example
A developer spotted and fixed a typo in a database name (acount to account), causing breaks in downstream systems, reports, and dashboards that were still expecting the old name (acount).
Lineage
Lineage refers to the journey of the data through a system. It provides insights into where the data comes from (upstream) and what it affects (downstream). Data lineage plays a crucial role in root cause analysis as well as informing impacted systems about an issue as quickly as possible.
Example
The hourly_consumption table was deprecated and removed as there were no known downstream consumers of this data, breaking a monthly integration check used for consumption reporting toward shareholders.
Data observability best practices
Data collected and analyzed within Grail falls into two categories:
- Dynatrace-sourced data, which originates from built-in and supported Dynatrace sources (for example, OneAgent). It has a predefined and resilient pipeline, including clusters of load-balanced ActiveGates, a set data schema, and a sampling interval.
- Externally sourced data, which comes from custom data ingest pipelines (for example, company-specific ETL processes). It's entirely proprietary.
This section introduces best practices that encompass all five Data Observability pillars.
Observe data pipelines
As a first step for externally sourced data, the quality and availability of a data pipeline must be ensured.
Data records are collected from various sources and data pipelines. Various data sources operate so-called Extract Transform and Load (ETL) processes. These processes collect raw data, transform and normalize it, and then load the resulting datasets into a data lakehouse such as Grail.
ETL processes often run in batch processing mode and can vary in quality and stability. As the stable operation of such ETL processes is the basis for data quality in terms of completeness, it's essential to observe the availability and performance of all the critical data pipeline steps.
As a leading observability and security platform, Dynatrace provides comprehensive monitoring capabilities to ensure data pipeline stability.
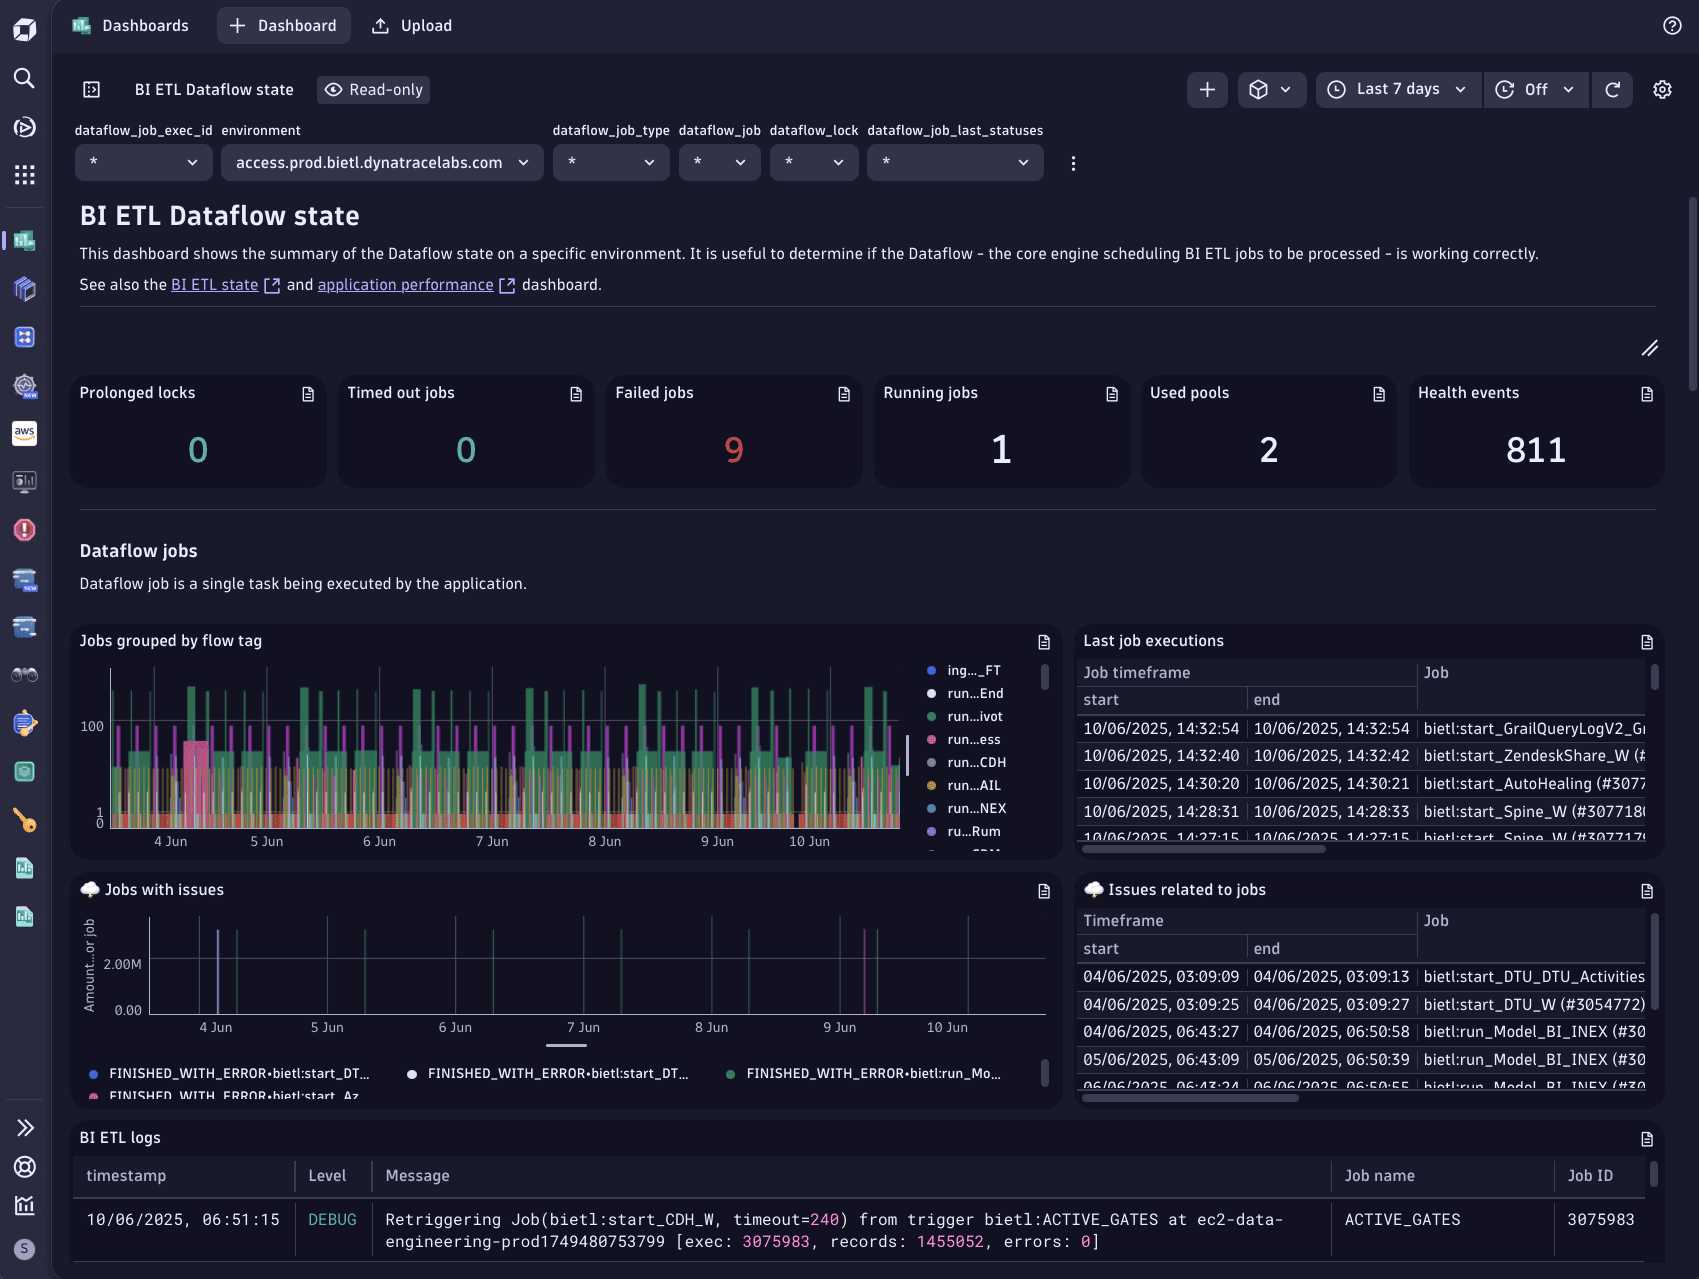
Depending on your pipeline's deployment, you can utilize the OneAgent for full stack server monitoring or opt for the cloud-native deployment to seamlessly monitor pipelines in the cloud, containers, or Kubernetes.
The image below shows a dashboard observing the health of our own data pipeline:

Detect anomalies in data volume
Your data pipeline continuously pushes batches of data records into Grail. Those batches contain various data, such as log lines, events, or metric measurements. The most important characteristics of your incoming data records are the volume over time and the ingestion frequency.
- The volume of the ingested data is an important indicator that helps to detect a partial or complete data loss.
- The frequency indicates how often the data is added to your pipeline and whether the data is streamed in real-time or collected in delayed, grouped batches (for example, hourly or daily).
Dynatrace anomaly detection monitors these critical parameters and automatically raises alerts, promptly informing the data engineering teams when the ingestion pattern goes off the baseline.
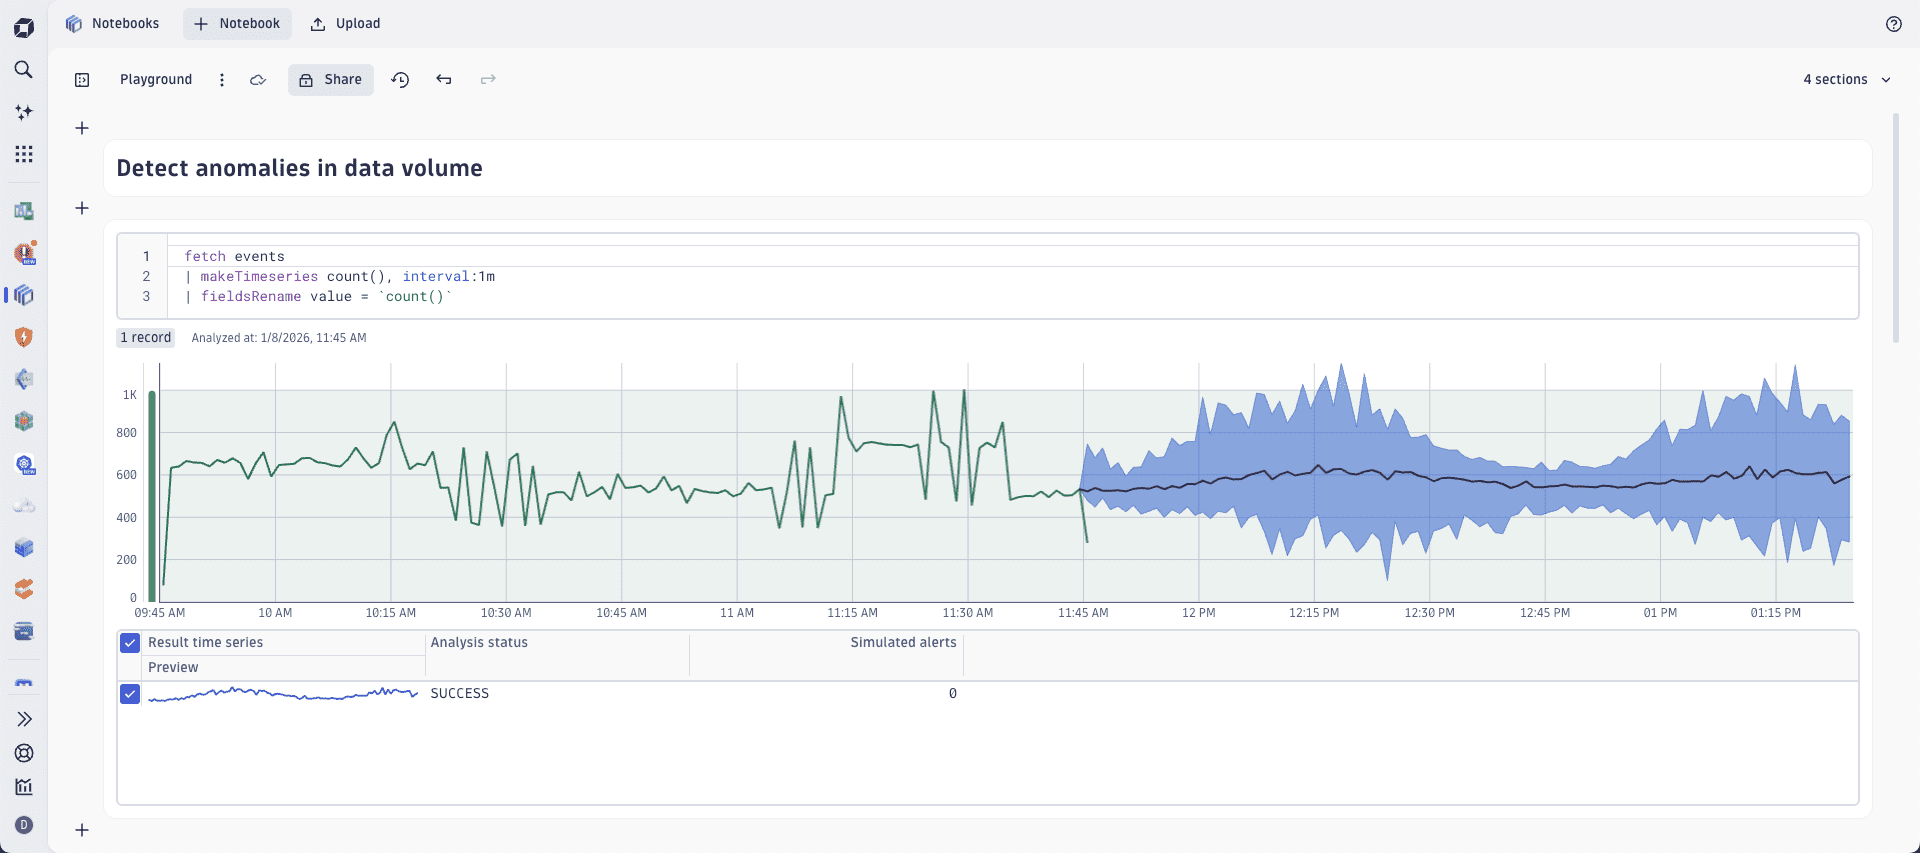
Dynatrace Notebooks help you to explore all incoming data records. With a right DQL query, you can filter and aggregate your data to focus on specific data subsets. You can even get a prognosis of the expected future load via Dynatrace Intelligence forecast, which uses the current load and presents the lowest and the highest probabilistic level as well as the predicted value for the future.
The image below shows a forecast of the expected number of future records created by Davis.

Detect anomalies in a data schema
Observing the schema can help identify and flag unanticipated changes, such as the addition of new fields or deletion of existing ones.
Changes in data schema can have the same negative result as a data loss, as derived aggregates such as charts, dashboards, and long-term reports rely on a specific data format. If the schema changes, either by dropping an important field or changing a field's name, all field-dependent data integrations break.
Detect anomalies in data freshness
In an optimal data ecosystem, the goal is to have data as current as possible, with all data records flowing into the pipeline instantly in near real-time.
This means that the delay between the data capture on the data source and data storage in Grail should be minimized. Observing the freshness of data helps to ensure that decisions are based on the most recent and relevant information.
An example here is a metric measurement of CPU on a host recorded at 12:00:00. If the data pipeline needs 60 seconds to process and store the metric measurement, the earliest point in time when you can query the same record is at 12:01:00. The data freshness in that example is measured as 1 minute, called near real-time.
Observe data distribution
The distribution of data is essential in identifying patterns, outliers, or anomalies in the data. Deviation from the expected distribution can signal an issue in data collection or processing.
Grail offers a dedicated DQL command—fieldsSummary—that enables you to explore the distribution of data record field values of any type. It calculates the cardinality of field values that the specified fields have.