Issue-tracking integration
- Dynatrace Classic
- How-to guide
- 2-min read
- Published Sep 14, 2020
To get statistics about release issues for your monitored entities and configure dynamic queries, you can integrate your issue-tracking system with Dynatrace.
Supported integrations
Dynatrace currently supports integration with
- Jira on-premises
- Jira cloud
- GitHub
- GitLab
- ServiceNow
Integrate your issue-tracking system
To integrate your issue-tracking system
- Go to Settings Classic > Cloud Automation > Issue-tracking for releases.
- Select Add issue-tracking query.
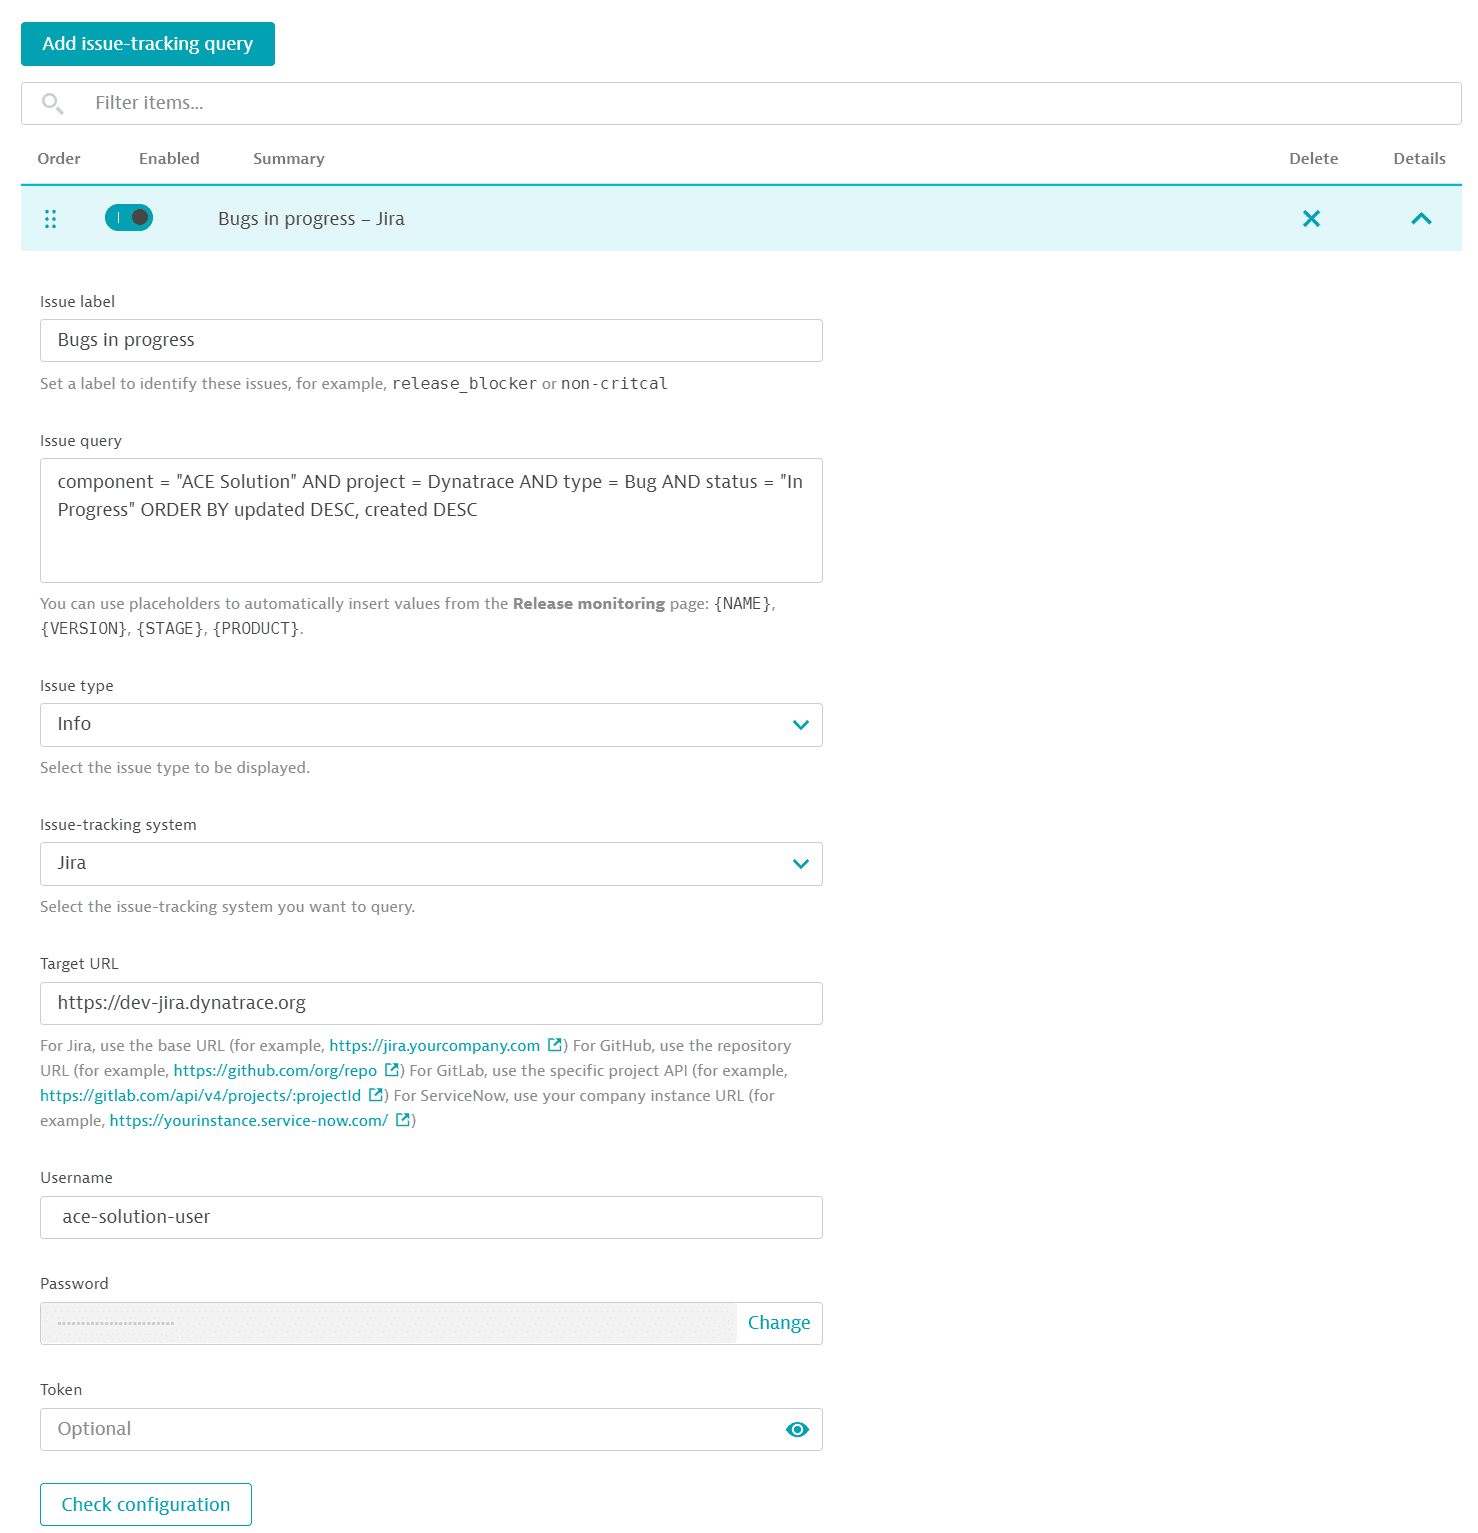
- Enter the information required (Issue label, Issue query, Issue type, Issue-tracking system, Target URL1, Username, and Password or Token).
- If there are configuration errors, an error message will be displayed at the bottom of the page (
Please resolve errors before saving...). Select Show errors to view the configuration errors (marked in red). - Optional Select Check configuration to check connectivity between Dynatrace and the issue-tracking system.
- Select Save changes to save your configuration.
For GitLab, to define queries to multiple projects, you can enter the /groups API endpoint.
Example configuration

Issue query
In the Issue query field, you can specify queries with placeholders that are resolved at runtime (for dynamic filtering).
Examples:
- Jira on-premises/Jira cloud:
issueType = Bug and component in ({PRODUCT}) and affectedVersion in ({VERSION}) - GitHub:
is:issue is:open label:{PRODUCT} label:{VERSION} - GitLab:
search={PRODUCT} {VERSION}&state=opened&scope=issues
Exception
For ServiceNow, placeholders aren't supported. You can query incidents by incident attribute values using the format <col_name><operator><value>.
Example: correlation_displayLIKEDYNATRACE^active=true. In this case, filtering will apply for records that contain DYNATRACE within the correlation_display column and that are currently active.
For other operators, consult the ServiceNow API documentation.
Any query that can be written as a sysparm_query request parameter is supported.
Credentials
The Username, Password, and Token fields are required as follows:
- For GitHub, enter a username and an OAuthToken
- For GitLab, enter an API token with read permissions
- For Jira on-premises, enter a username and a password
- For Jira cloud, enter a username and an OAuthToken
- For ServiceNow, enter a username and a password
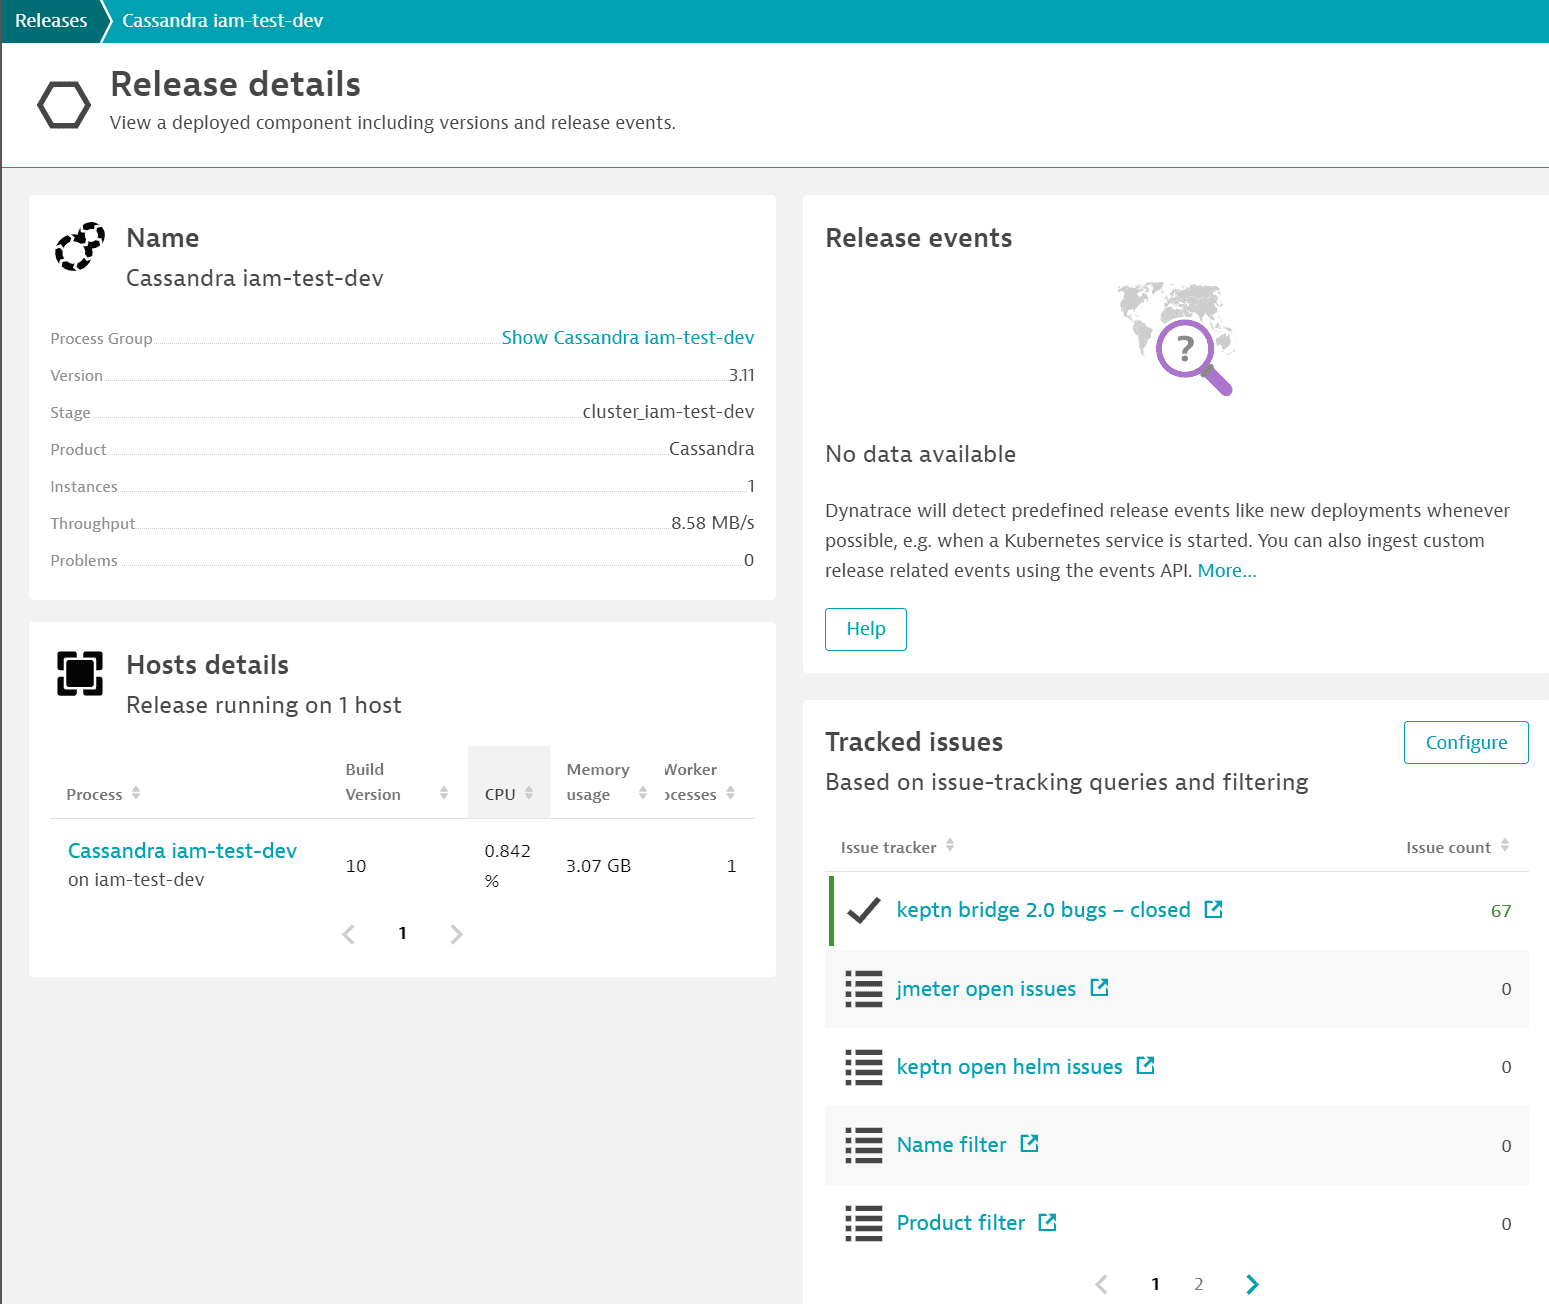
Once you add your issue tracker to Dynatrace, you can see issue statistics related to the monitored entities in the Release inventory on the Releases page. For example, if the release inventory shows entries for the application Cassandra with version 3.11, the issue-tracking integration will provide the count of bugs for Cassandra version 3.11.
Example issue tracker integration

Limitations
You can create a maximum of 20 issue-tracking configurations.
Troubleshooting
The following is a solution to a problem some people had with Automated release monitoring issue-tracking integration: no query results matching the filter.
 Releases